Effective Trajectory Data Analysis Using
Continuous K-Means Clustering
P.Kanmani
Assistant ProfessorSri Ramakrishna Institute of Technology Coimbatore, India
R.N.Devendrakumar
Assistant ProfessorSri Ramakrishna Institute of Technology Coimbatore, India
K.Ramalakshmi
Assistant ProfessorSri Ramakrishna Institute of Technology Coimbatore, India
Abstract---Network monitoring tools are designed to analyze the network traffic status. Network transaction information is observed from the frame headers. Data transmission, communication and computational overheads are analyzed from the network monitoring tools. Network load deviation estimation is a complex task. K-means clustering algorithm is used to estimate the network load. All the network transactions are passed into the clustering process. Threshold values are used to find out the load differences. The K-means clustering based monitoring model uses the centroid values to assess the network load difference. The system analyzes the network load under single server and multiple server environments. Network load adjustment process is initiated with reference to the load variations. Computational load and communication load are adjusted with the load variation information collected from the monitoring application. The system analyzes the node movement status. The proposed system is designed to improve the monitoring K-means based monitoring mechanism with distance measures. The distance measure is enhanced with support information. Support information reflects the attribute relationship with the entire transaction set. Attribute support functions are integrated with the distance estimation models. Dynamic distance measurement is used in the system.
Keywords---TKM (Threshold-based k-means monitoring method), HC*(an improved HC), confinement circle (CC),Continuous K-means clustering
I. INTRODUCTION
The k-means computation is crucial in many practical applications, facility location planning, spatial decision making and clustering. Our work focuses on continuous k-means monitoring [1] over moving objects, which has numerous practical applications. For instance, real-time traffic control systems.
1. We present TKM, a general framework for continuous k-means monitoring over moving objects.
2. We propose HC*, an improved HC, which minimizes the cost of each iteration by only considering a small subset of the objects.
3. We model the threshold assignment task as a constrained optimization problem, and derive the corresponding mathematical formulas.
4. We design different mechanisms for the dissemination of thresholds, depending on the computational capabilities of the objects.
Figure-1: TKM FRAMEWORK
II. K-MEANS COMPUTATION FOR STATIC DATA
Most data mining literature has applied HC for solving k-means. Fig. 2 shows a general version of the algorithm.
---HC(dataset P,K)
1. Choose k random seeds as the initial center set M
2. Repeat
3. For Each point
p
P
4. Assign p to its nearest center in M 5. For each center m in M
6. Replace m with the Centroid of all pP assigned to m
7. Until no Change happens in M
---We propose a new method hereafter referred to as ZDT, for predicting the best possible cost that can be achieved by HC. Let M be the current k-means set after one iteration of HC. At present, each center m in M is the centroid of its cluster. For a point p, we use mp to denote the currently assigned center of p, which is not necessarily the nearest. A key observations that there is a constant >, such that in all subsequent HC iterations, no center can deviate from its position in M by more than
G
. Equivalently, as shown in Fig. 3, each m
M is restricted to a confinement circle (CC) centered at its current position with radiusG
. Therefore, when HC eventually converges to a local optimum M* , each center in M*must be within its corresponding CC. It remains to clarify the computation ofG
. Let MbbeFigure-2: Centers Restricted in Confinement Circles
III. PROBLEM DEFINITION
Network monitoring techniques are used to monitor the node density, traffic flow, communication and computational load information. Most of the monitoring tools use the protocol information and service details for the analysis. Statistical analysis is used for the network monitoring process. Network load fluctuation is analyzed with the statistical methods. The system is designed to monitor single server and multiple server environments. Monitoring results are used to perform load-balancing operations. The K-means clustering based monitoring mechanism is used for the network monitoring process. The threshold value is used to estimate the load fluctuations. Threshold estimation is the complex problem. The system alerts the clients that are located in the load density area. Automatic threshold estimation is not provided in the system. Node mobility and communication overhead are analyzed. The analysis results are used to adjust the traffic and communication overheads.
The proposed system is designed to improve the monitoring K-means based monitoring mechanism with distance measures. The distance measure is enhanced with support information. Support information reflects the attribute relationship with the entire transaction set. Attribute support functions [3] are integrated with the distance estimation models. Dynamic distance measurement is used in the system.
IV. THRESHOLD-BASED K-MEANS MONITORING
Let P ={p1,p2,p3} be a set of n moving points in the d dimensional space. We represent the location of an object pi (
W
-)={ pi (W
) [1], pi (W
) [2], …pi (W
) [d]},where pi (W
)[j](1Ej Ed) denotes the coordinate of pion jth axis.We assume that the user specifies a quality tolerance
'
,and the system optimizes efficiency while always satisfying'
.'
is defined based on the REF . Specifically, let MREF (W
)
MREF (W
)) be the k-means set maintained byREF(TKM) [2] at
W
.At any time instantW
and for all 1<i <k and dist(m IREF(W
)
mITKM (W
) i.e., each centerin MTKM(
W
) is within 7 distance of its counterpart in MREF (W
) . Given this property, we can prove thatcost(MTKM(
W
) ) E cost(MREF (W
)) + n72 TKM [ works as follows: AtW
=0,each object sends its location to theserver, which computes the initial k-means set. Then, the server transmits to every object pi a threshold Hi such that pi sends a location update if and only if it deviates from its current position (i.e., pi[0]) by at least
T
i. Alternatively,Figure-3: Example Update (a) Timestamp (b) Timestamp 1
Where p1 - p7 start at positions p1(0)-p7(0), and receive thresholds
T
1
T
7
from the server, respectively. version of HC, hereafter referred to as HC*. HC* computes exactly the same result as HC and performs the same iterations, but visits only a fraction of the data set in each iteration. HC*exploits the fact that the point assignment for the seed is usually similar to the converged result.V. THRESHOLD ASSIGNMENTS
5.1. Mathematical Formulation of Thresholds
The threshold assignment routine takes as input the objects locations P ={p1,p2...pn} and the k-means set M ={m1,m2,…mk}, and outputs a set of n real values
T
{
T
1
,
T
2
..
T
n
}
, i.e., the thresholds. We assume that the average time interval between two consecutive location updates of each object pi is proportional toT
i. Intuitively, the larger the threshold, the longer the object can move in an arbitrary direction without violating it. Considering that all objects have equal weights, the (minimization) objective function is¦
ni
i
11
/
T
ZDT [5] relies on the assumption that each center is the centroid of its assigned points. To bridge this gap, we split the tolerance
'
into'
='
1+'
2, and specify two constraints called the geometric-mean (GM), and the CC constraint. By applying ZDT on the input P M and M M, and using'
2 as the radius of the CCs, we obtainLB (Mb) > cost (M1 )
Where LB(Mb) =
6
dist2( p1 , mp)+min m(|P1m |'
2 2) -6
p1
P move Y(p1) p1
P1Y(p1)= dist2( p1 , m1p+
'
2)2 – (max(0, min m1
M \ { m M p}dist(p1,m1) -'
2))2and P1move ={p | Y(p1)>0}.
Comparing LB(Mb) and cost(MM), we reduce the inequality LB(Mb) > cost(M1) to
6
Y(p1)< ( |Pm 1 |'
22) p1
Pmove ,Y(p) is an upper bound of the maximum cost reduction by shifting point p to another cluster. We thusderive an upper bound UB_ Y(p)of Y(p) using the upper bound and lower bound of dist(p 1,m 1) point/center pair p M and m . is always Summarizing, we formulate constraint CC into
6
UB _Y (p) <min m(|Pm 1|'
2 2) , whereUB _Y (p)= (dist( p , mp)+
'
+T
p.)2 – (maxm
M\ {mp} dist( p, m)-'
-T
p))2and P move={p| UB_Y(p)>0}.5.2. Dissemination of Thresholds
broadcasts
'
. After the first k-means set is computed, the broadcast information includes the center set M,'
1. Each object computes its own threshold based on the broadcast information. The second approach assumes that objects have limited computational capabilities. Initially, the server sends'
1 to all objects through single-cast messages [10]. In subsequent updates, it sends the threshold to an object only when it has changed. Note that most objects, besides those in Pmove, have identical threshold.'
1. Usually Pmove is only a small fraction of Pmove,therefore, the overhead of sending these the thresholds is not large. Let Pu be the set of objects that have issued
updates, and
T
old be the set of thresholds before processing these updates. After reevaluating the k-means, theserver computes the set of thresholds Hnewfor all objects. Then, it constructs the threshold set H as follows: For each
point in Pu, its threshold in Hnewis the same as in, whereas all other thresholds remain the same as in Hold. If
T
newis valid, i.e., each threshold is nonnegative, the server disseminates
T
new to objects in Pu; otherwise, itdisseminates
T
newto all affected objects.5.3. Partitioning methods
1. Reallocation method - start with an initial assignment of items to clusters and then move items from cluster to cluster to obtain an improved partitioning [8].It involves movement or “reallocation ” of records from one cluster to other to create best clusters. It uses multiple passes through the database fast.
Algorithm 1:
---Step 1: Select K data points as the initial representatives.
Step 2: for i = 1 to N, assign item xi to the most similar centroid (this gives K-clusters)
Step 3: for j = 1 to K, recalculate the cluster centroid Cj
Step 4: Repeat steps 2 and 3 until there is (little or) no change in clusters
---Algorithm 2:
---Step 1: Pre-select the number of clusters desired
Step 2: Randomly pick a record to become the center or “seed” for each of these clusters
Step 3: Go through the database and assign each record to the nearest cluster.
Step 4: Recalculate the centers of the clusters.
Step 5: Repeat steps 3 and 4 until there is a minimum or no change in clusters.
---2. Single Pass method -simple and efficient, but produces large clusters, and depends on order in which items are processed The database must be passed through only once in order to create clusters (i.e – each record is read from the database only once).
Algorithm:
---Step 1: Read in a record from the database and determine the cluster that is best fits into.
Step 3: Read in the next record.
---VI. NETWORK MONITORING USING DISTANCE FACTOR
Network traffic analysis is carried out with a variety of clustering techniques. The K-means clustering algorithm is used to categorize the network traffic information. The network traffic categories are used to estimate the node movement. The node movement deviations are analyzed using the threshold-based methods. The threshold estimation is a complex task in the network monitoring system. The system monitors a set of nodes with their movement and load. Network load is analyzed with communication and computational overhead. The nodes can adjust the load within the network area. Multiple server based monitoring is provided in the system. The distance measure is used to find deviation between the network transactions. The system adjusts the threshold dynamically based on the load levels. Support based distance is used to estimate network load fluctuation.
6.1. Effective Density Queries for Moving Objects in Road Networks
The advances in mobile communication and database technology have enabled innovative mobile applications monitoring moving objects. In some applications, the object movement is constrained by an underlying spatial network, e.g., vehicles move on road networks and trains on railway networks. Objects cannot move freely in space, and their positions must satisfy the network constrains. A network is usually modeled by a graph representation, comprising a set of nodes and a set of edges. Depending on the application, the graph may be directed, i.e. each edge has an orientation. Additionally, moving objects are assumed to move in a piecewise linear manner, i.e., each object moves at a stable velocity at each edge. The distance between two arbitrary objects is defined as the network distance between them on the network. Several types of queries have been studied in the road network, such as kNN queries, range queries, aggregate nearest neighbor queries, and reverse nearest neighbor queries.
The problem is with dynamic density queries for moving objects in road networks. The objective is to find dense areas with high concentration of moving objects in a road network efficiently. The density query can be used in the traffic management systems to identify and predict the congested areas or traffic jams. For example, the transportation bureau needs to monitor the dense regions periodically in order to discover the traffic jams.
Existing research works on the density query assume the objects moving in a free style and define the density query in the Euclidean space. The general density-based queries are difficult to be answered efficiently and their focus is hence turned to simplified queries or specialized density queries without answer loss. These methods use the grid to partition the data space into disjoint cells and report the rectangle area with the fixed size. However, the real dense areas may be larger or smaller than the fixed-size rectangle and appear in different shapes. Simplifying the dense query to return the area with fixed size and shape cannot reject the natural congested area in real-life application. The focus is on the density query in the road-network setting, where the dense area consists of road segments containing large number of moving objects and may be formed in any size and shape. The real congested areas can therefore be obtained by finding the dense segments. In addition, for querying objects moving in a road network, the existing methods based on a regular spatio-temporal grid ignore the network constraint and therefore result in inaccurate query results.
evaluations demonstrate it is much cheaper than keeping the complete information about individual locations of objects to process the dynamic density queries. Contributions are summarized as follows:
x The density query for moving objects in road networks that is amenable to obtain the effective answers is defined.
x A cluster-based algorithm to efficiently monitor the dense areas in a road network.
x Query algorithms achieve high efficiency and accuracy.
The formal definition of moving clusters and the proposal of methods that automatically discover them from a long history of recorded trajectories. Intuitively, a moving cluster is a sequence of spatial clusters that appear in consecutive snapshots of the object movements, such that two consecutive spatial clusters share a large number of common objects. Spatial Database Systems (SDBS) are database systems for the management of spatial data such as points and polygons representing a part of the surface of the earth. The task of clustering in spatial databases, in particular the problem of detecting clusters of points which are distributed as a homogeneous Poisson point process restricted to a certain part of the space. This type of distribution is also called uniform distribution or random distribution [11]. The clusters may have arbitrary shape. This problem arises in many applications, e.g. seismology, minefield detection and astronomy.
6.2. A Framework for Generating Network-Based Moving Objects
One of the most challenging and encouraging applications of state-of-the-art technology is the field of traffic telematics, which combines techniques from the areas of telecommunication and computer science in order to establish traffic information and assistance services. This process was set off (1) by the urgent need of the road users for information and assistance and (2) by the development of new technologies. In order to offer the required services to customers, a provider needs the access to a large heterogeneous database storing alphanumerical data like customer records as well as spatial data: Very important is a detailed representation of the street network. For fleet services, it is necessary to keep track of the positions of the vehicles. Also other traffic telematics services such as toll charging via GPS/GSM, theft protection, and the integration of individual and public transport need the management of large sets of moving spatial objects.
The support of motion requires that the spatial database system stores moving objects efficiently and performs spatial queries with time conditions in respect to the actual time, in respect to the past and, especially, in respect to the (near) future. The larger the number of moving objects, the more important performance issues will become. The management of spatiotemporal data is one of the most vivid research activities in these days. One important task in the field of spatiotemporal databases is to benchmark such systems or some of their components. An example is the evaluation or/and the comparison of the execution time of access methods for supporting spatiotemporal queries. In order to evaluate such spatiotemporal access methods, experiments with synthetic and real data are required. One important requirement to future research activities is the preparation and use of well-defined test data and benchmarks enabling the comparison of different access methods and algorithms.
A framework for spatiotemporal dataset generators [13] for “smoothly” moving objects – motivation is an application modeling fishing boats. There exist no or only few restrictions in motion: e.g., shoals of fish may attract ships,uses a network for leading or attracting the moving objects.
VII. EXPERIMENTAL EVALUATIONS
Comparing TKM against REF using two data sets. In the first one, denoted as spatial, we randomly select the initial position and the destination of each object from a real data set, California Roads illustrated in Fig.4. Each object follows a linear trajectory between the two points. Upon reaching the endpoint, a new random destination is selected and the same process is repeated. The second data set, denoted as road , is based on the generator using subnetworks of the SanFrancisco road map (illustrated in Fig. 10b) with about 10,000 edges. Specifically, an object appears on a network node, completes the shortest path to a random destination and then disappears.
In both data sets, the coordinates are normalized to the range [0..1] on each dimension, and every object covers distance 1/1,000 at each timestamp.
Figure-4: Dataset (a) Spatial (b) Road
In spatial, movement is unrestricted; whereas in road, objects are restricted to move on the network edges. REF employs HC to recompute the k-means set, whereas TKM utilizes HC*. Since every object moves at each timestamp, there are threshold violations in most time-stamps, especially for small tolerance values. This implies that TKM usually resorts to recomputation from scratch and the CPU gains with respect to REF are mostly due to HC*.For the dissemination of thresholds, we use the singlecast protocol, where the server informs each object individually about its threshold. Table 1 summarizes the parameters. To design different mechanisms for the dissemination of thresholds, depending on the computational capabilities of the objects.
Parameter Spatial Road
Cardinality n (x103)
16,32,64,128,256 4,8,16,32,64
Number of means k
2,4,8,16,32,64 2,4,8,16,32,64
Toleance
'
0.0125,0.025,0.05,0.1,0.2 0.05,0.1,0.2,0.4,0.8
Table 1: Experimental Parameters
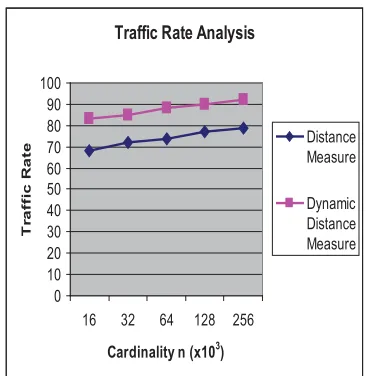
Cardinality n (x103)
Distance Measure
Dynamic Distance Measure
16 68 83
32 72 85
64 74 88
128 77 90
256 79 92
Table 2: Experimental Parameters
Traffic Rate Analysis
0 10 20 30 40 50 60 70 80 90 100
16 32 64 128 256
Cardinality n (x103)
T raf fi c R at e Distance Measure Dynamic Distance Measure
Figure 5: Traffic Rate Analysis
VIII. CONCLUSION
This paper proposes TKM, which achieves considerable savings by assigning each object a threshold, such that the object needs to inform the server only when there is a threshold violation. Here we develop an optimized HC technique for reducing the CPU cost, and discuss optimizations of TKM for the case that object speeds are known. Finally, we design different threshold dissemination protocols depending on the computational capabilities and use multiple servers for monitoring locations of distinct set of objects and their updates when it crosses the range boundary.
REFERENCES
[1] Zhenjie Zhang, Yin Yang, Anthony K.H. Tung, and Dimitris Papadias “Continuous k-Means Monitoring over Moving Objects” 2010.
[2] Caifeng Lai, Ling Wang, Jidong Chen, “Effective Density Queries for Moving Objects in Road Networks”,2005. [3] Dan Pelleg Andrew Moore “Accelerating Exact k-means Algorithms with Geometric Reasoning”, 2008.
[4] Dayakar Reddy, Dr.Govardhan Talari Swapna “Continuous K-means computation over moving objects by designing different threshold dissemination protocols” in International Journal of Computer Applications,2010.
[5] Dieter Pfoser, Yannis Theodoridis “Generating Semantics-Based Trajectories of Moving Objects”,2000.
[6] Haibo Hu, Jianliang Xu and Dik Lun Lee “A Generic Framework for Monitoring Continuous Spatial Queries over oving Objects” in ACM,2005.
[7] Nico Van de Weghe1, Anthony G. Cohn “Representation Of Moving Objects Along A Road Network”,2004.
[8] Panos Kalnis, Nikos Mamoulis, and Spiridon Bakiras “On Discovering Moving Clusters in Spatio-temporal Data”, 2003.
[9] D. Arthur and S. Vassilvitskii, “How Slow is the k-Means Method,” Proc 22nd ACM Symp. Computational Geometry (SoCG),2006. [10] S. Har-Peled and B. Sadri, “How Fast is the k-Means Method,”Proc. 16th Ann. ACM-SIAM Symp. Discrete Algorithms (SODA),2005. [11] L. Kaufman and P.J. Rousseeuw, “Finding Groups in Data: An Introduction to Cluster Analysis”. John Wiley & Sons, 1990.
[12] S. Lloyd, “Least Squares Quantization in PCM,” IEEE TransInformation Theory, vol. 28, no. 2, pp. 129-136, 1982.
[13] R. Ng and J. Han, “Efficient and Effective Clustering Method for Spatial Data Mining,” Proc. 20th Int’l Conf. Very Large Data Bases (VLDB), 1994.
[14] S. Papadopoulos, D. Sacharidis, and K. Mouratidis, “Continuous Medoid Queries over Moving Objects,” Proc. 10th Int’l Symp. Spatial and Temporal Databases (SSTD), 2007.
[15] D. Pelleg and A. Moore, “Accelerating Exact k-Means Algorithms with Geometric Reasoning,” Proc. Fifth ACM SIGKDD Int’l Conf.Knowledge Discovery and Data Mining (KDD), 1999.
[16] CH.Dayakar Reddy Dr A Govardhan Talari Swapna “Continuous K-means computation over moving objects by designing different threshold dissemination protocols” International Journal of Computer Applications, 2010.
[17] Nico Van de Weghe1, Anthony G. Cohn “Representation Of Moving Objects Along A Road Network” 2004.
[18] Xiaowei Xu, Martin Ester, Hans-Peter Kriegel, Jörg Sander “A Distribution-Based Clustering Algorithm for Mining in Large Spatial Databases” Published in the Proceedings of 14th International Conference on Data Engineering (ICDE’98).