75 |
P a g e
PREDICTION OF PROTEIN TERTIARY STRUCTURE
USING CROSS VALIDATION TECHNIQUE
Manish Kumar
1, Hari Om
21,2
Department of CSE, IIT(ISM), Dhanbad, (India)
ABSTRACT
Owing to the strict relationship between protein structure and their functions, the 3D structure prediction and
classification of protein sequences has become one of the most challenging tasks in recent years. Despite of all the
recent advancement in the field of molecular biology, the structural and behavioural nature of most of the protein
and DNA sequences is still intractable. Notwithstanding with the large and new verities of new techniques which are
proposed in recent years, sequence alignment and structure prediction is still an open problem. Therefore, in this
paper we present a novel approach based on cross validation technique to predict the tertiary protein structure. The
results so obtained are based on gravitational search methodology and were evaluated with reference to other
existing methods for structure prediction and classification over structural benchmark datasets. The results which
we gained after the experimental analysis, clearly demonstrates the robustness of the presented approach in
achieving high prediction accuracy (it terms of percentage).
Keywords: Bioinformatics, Classification, Cross Validation, Protein, Structure Prediction
I INTRODUCTION
76 |
P a g e
above mentioned problems [3]. In order to have insight knowledge of researches performed in the area of protein structure prediction and its classification, a detail review has been made in the paragraphs that are follows.Like DNA, Proteins are also considered as building blocks for living organisms. Their role is very much important for biological interplay. Some of the major functions of protein include DNA replication/ modification ,metabolism, intracellular signalling , transcription/ translation, cell-cell communication, coordinated motions, transport, defence and immunity functions, regulation, protein folding/ degradation, mechanical support, storage, generation and transmission of nerve pulse and any other life process one might figure [4].
To know about the procedures and changes in any organisms, protein functions and structure must be known. This knowledge helps us to know about the early detection of disease and proper designing of drugs. There is a four level hierarchy considered for protein structure. Protein‟s first structure is the very linear sequence of its amino acids. The secondary structure of protein is formed by local interaction among the neighbouring amino acids through peptide bounds. There are three main secondary structures protein are known they are α-helix, β-sheets and coils. Because of such compositions among protein sequences, different types of forces act in between the structures. These forces are hydrophobic, repulsion and attraction. These forces along with different types of bonds make protein tertiary structure. At the highest level of protein structure, lies the Quaternary structure. This structure tells us how the polypeptide chains works together to form a complex functional protein. Same as the tertiary structure, the quaternary of protein structure is also determined by hydrophobic and ionic interactions between amino acids [5]. Since protein function is well associated with its structure, therefore it can easily be determined from 3D structure [6]. However it is still exist as a challenging task. In order to overcome the challenges faced by protein functions it is suggested to use secondary structure. In addition to that, this secondary structure of protein can be used as input feature for many other bioinformatics tasks [7].
There are two methods by which we can determine the structure of biological molecules. The methods are known as computational methods and experimental methods. The experimental methods were used before the invention of computational methods. Experimental method includes nuclear magnetic resonance, X-ray crystallography and electron microscopy. The negative aspects of this method are the time. This method takes too much time for its operation. It may take several months which may extend up to years for predicting a structure. Furthermore, it is very costly and may cost thousand dollars and is not applicable to all proteins. Because of all the reasons mentioned above, the need for an accurate and rapid method is required and therefore the development of computational method took place [8].
77 |
P a g e
revision. The revision is required because of the obscure patterns existing in protein data. Consequently, the variety of computational proposed methods is very broad. Most of the literature„s studies have suggested for creation for of a statistical models that would be helpful for knowing the structure of protein sequences. To pursue the end, in this research it is tried to provide a brief review of strategies to predict the protein tertiary structure with the help of gravitational search algorithm (GSA).Protein structures are classified based on their folding patterns. The two most known and common classification are SCOP and CATH. In CATH the proteins are classified as homologous super families and are chopped into structural domains. These classifications are based on four-levels of structural annotation (topology, architecture, class, homology), and five levels of sequence identity within a family. CATH combines the concepts of manual and automated techniques which consist of empirical and statistical evidence, computational algorithms, literature review and expert analysis [13].
SCOP classification process is based on full proteins structure instead of domains. The SCOP hierarchy also has four levels: super family, family, class and fold. Same as the principle of CATH‟s levels, the different definition of each level provides a distinct hierarchy structure [14] [15]. The SCOP classification is [16] totally depends upon human expertise.
In this paper, we present a cross validation technique also known as “10- fold validation technique” [4] to predict the tertiary structure of protein sequences. As we all known that, there are total of eleven different classes of protein. And among these eleven classes we have chosen four classes (all-β, all-α, α/β ,α+β ) for our experimental study. We have predicted the structure of different protein sequences and made an accuracy comparison between different protein sequences in term of percentages. We have performed the experimental analysis using gravitational search algorithm and compared our proposed method with different standard methods currently available for protein tertiary structure prediction. All tests were performed using standard structural datasets such as 640,1189 and ASTRAL [17].
Later in this paper, we have described about our proposed approach with detail discussion on cross validation techniques. After that, we have detailed about the results obtained with standard datasets with graphical representation.
II. PROPOSED APPROACH
78 |
P a g e
Cross-validation or rotation estimation is a validation technique model for testing the results of statistical analysis. It is mainly used for prediction analysis and for achieving high accuracy results. The main function of fold cross validation is to "test" a given dataset and reduce the chance of over fitting. This validation technique can easily be understood by the following example. Taking the example of 1189 datasets which includes 1189 low - conformity tertiary structures of protein sequences. With 10-fold validation test method, a total of ten percentage is extracted from all the classes considered in the research i.e all-β, all-α, α/β , and α+β. Now, these 10% of extracted data`s will be treated as testing data and the reaming data`s in all classes are act as a training sample or data. TABLE 1 represents commonly and vastly used datasets for protein tertiary structure prediction. In this research, we have used 10 fold validation techniques and it was observed that the results obtained with this technique are of optimal quality. However, 5 fold validation techniques were also evaluated. But, the results obtained using 5 fold validation was not good enough in predicting protein structure as compared to 10 fold validation technique.Structural classification of protein sequences is an important problem in structural Bioinformatics. Literature studies have demonstrated different methods employed for the classification of protein tertiary structures. The structural classification of proteins (SCOP) currently include eleven classes [16]: 1) protein low-resolution proteins; 2) multi-domain proteins; 3) peptides; 4) small proteins; 5) all-β structure protein; 6) designed proteins; 7) α+β structure protein; 8) coiled coils protein; 9) all-α structure; 10) α/β structure protein and 11) membrane & cell surface proteins. Among the classes mentioned above, the 3D (tertiary) structure of protein include all-β, all-α, α/β and α+β. All these classes have low homology (around 40%) among each other and are quite easier to predict and classify. Classes having high homology may contains some errors such as noise or misleading protein structure and will not be suitable for predicting protein structure. In this research, we have used a cross validation technique known as “10 fold validation” for finding patterns between all-β, all-α, α/β and α+β classes of protein sequences. To test the behaviour of these classes (class I represents all-α, class II represents all-β, class III represents α/β and class IV represents α+β) and in order to predict their structure characteristic we have made a classification model and based on this model we have tested all the four classes over standard structure benchmark datasets known as 1189, ASTRAL and 640. The obtained results clearly demonstrate the novelty of the presented approach in predicting and classifying protein tertiary structures.
III RESULTS
79 |
P a g e
These figures govern the superiority of the presented method over different existing methods. However, in few cases the proposed methodology is not able to perform well. But, in overall comparison the proposed method has performed better among all presented methods.TABLE 1: Datasets Used for the Experiment
DATASET all-α all-β α/β α+β Total
ASTRAL 639 661 749 764 2813
1189 223 294 334 241 1092
640 138 154 171 177 640
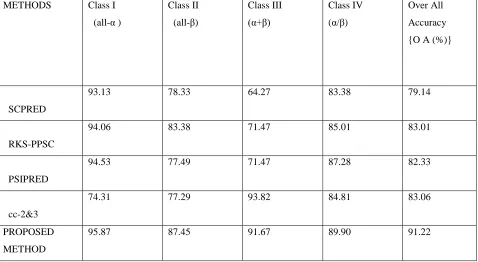
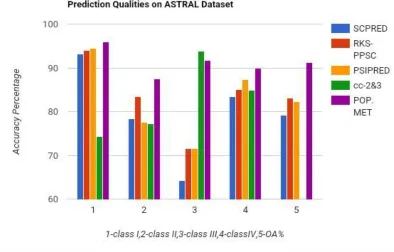
TABLE 2: Experimental Result for Structural Prediction Based on ASTRAL Dataset
METHODS Class I
(all-α )
Class II (all-β)
Class III (α+β)
Class IV (α/β)
Over All Accuracy {O A (%)}
SCPRED
93.13 78.33 64.27 83.38 79.14
RKS-PPSC
94.06 83.38 71.47 85.01 83.01
PSIPRED
94.53 77.49 71.47 87.28 82.33
cc-2&3
74.31 77.29 93.82 84.81 83.06
PROPOSED METHOD
80 |
P a g e
Figure1: Bar graph comparison result between different methods over ASTRAL datasets
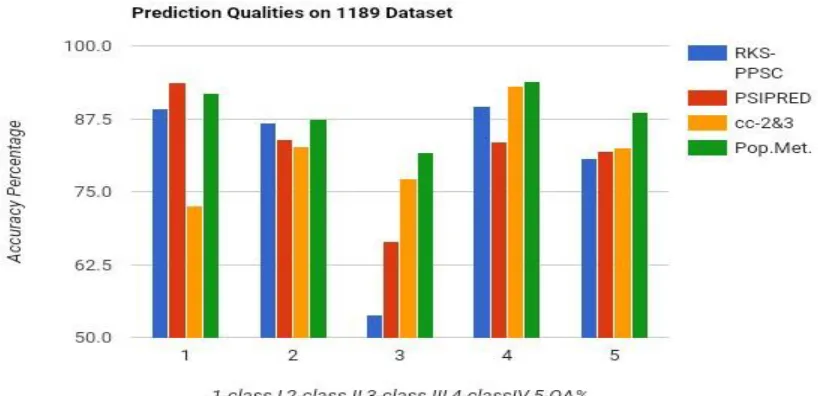
TABLE 3: Experimental Result for Structural Prediction Based on 1189 Dataset
METHODS Class I
(all-α )
Class II (all-β )
Class III (α+β)
Class IV (α/β)
Over All Accuracy {O A (%)}
RKS-PPSC 89.20 86.70 53.80 89.60 80.60
PSIPRED 93.72 84.01 66.39 83.53 81.96
cc-2&3 72.49 82.65 77.24 93.04 82.56
PROPOSED METHOD
81 |
P a g e
Figure2: Bar graph comparison result between different methods over 1189 datasets
TABLE 4: Experimental Result for Structural Prediction Based on 640 Dataset
METHODS Class I (all-α ) Class II (all-β) Class III (α+β) Class IV (α/β) Over All Accuracy
{O A (%)}
RKS-PPSC
89.10 85.10 71.40 88.10 83.10
PSIPRED
93.72 84.01 66.39 83.53 83.44
cc-2&3 76.92 81.25 83.87 94.73 84.51
PROPOSED METHOD
82 |
P a g e
Figure3: Bar graph comparison result between different methods over 640 datasets
IV CONCLUSION
Identifying similarity between different structures of proteins is seen as the most interesting topic in today`s research. Structure prediction of protein sequences, are generally used for finding the structural homology between two protein structures based on their 3D conformation. In this paper, we have presented an evolutionary based approach for predicting the protein tertiary structure. To evaluate the proposed approach, we have used structural protein datasets and the experimental results show`s that the presented approach outperforms some of well know methods generally used for protein structure prediction. In our future research work, we will do the structure prediction of reaming classes of protein sequences which are not covered in this research. Furthermore, we will also try to implement the proposed technique using some other soft computing approaches.
REFERENCES
[1]. E. Buxbaum, “Fundamentals of Protein Structure and Function”, Springer, 26352-6, 2007.
83 |
P a g e
[3]. W. Guoren, Y. Zhao, D. Wang. "A protein secondary structure prediction framework based on the extreme learning machine." Neurocomputing72(1), 2008, 262-268.
[4]. Ding, C.H.Q., Dubchak, I. Multi-Class Protein Fold Recognition Using Support Vector Machines And Neural
Networks. Bioinformatics,17 (4), 2001 ,349-358.
[5]. K. Chen, L.A. Kurgan, J.S. Ruan, Prediction of protein structural class using novel evolutionary collocation-based sequence representation, J. Comput. Chem. 29 ,2008 1596-1604.
[6]. Y. Chou Peter, and G. D. Fasman. "Prediction of protein conformation."Biochemistry 13(2) ,1974: 222-245.
[7]. Y. Ashraf, Li. Yaohang "Context-based features enhance protein secondary structure prediction accuracy." Journal of chemicalinformation and modeling 54(3), 2014: 992-1002.
[8]. M. Rithvik, and G. N. Rao. "A Comparative Study of Methodologies of Protein Secondary Structure." Computational IntelligenceTechniques for Comparative Genomics. Springer Singapore, 2015. 37-45.
[9]. J. He, H-J. Hu, R. Harrison, P. C. Tai, Y. Pan, “Rule Generation for Protein Secondary Structure Prediction
With Support Vector Machines and Decision Tree”, IEEE Transactions, Nanobioscience, 5(1), 2006.
[10]. M. HosseinZangooei , S. Jalili, “Protein secondary structure prediction using DWKF based on SVR-NSGAII”, Elsevier, Neurocomputing,94,2012,87–101.
[11]. R. Heffernan, K. Paliwal, J. Lyons, A. Dehzangi, A. Sharma, J. Wang, A. Sattar, Y. Yang and Y. Zhou, “Improving prediction of secondary structure, local backbone angles, and solvent accessible surface area of proteins by iterative deep learning”. Scientific Report, 2015.
[12]. Y. Bingru, et al. "Predicting protein second structure using a novel hybrid method." Expert Systems with Applications 38.(9),2011: 11657-11664.
[13]. Reza Zohouri Aram, Nasrollah Moghadam Charkari. A two-layer classification framework for protein fold recognition. Journal of Theoretical Biology 365,2015, 32–39
[14]. Kavousi, K., et al. Evidence theoretic protein fold classification based on the concept of hyperfold. Math. Biosci 240 (2),2012, 148–160.
[15]. Shu-Lin Wang, Yihai Zhu, Wei Jia, and D.S.Huang," Robust classification method of tumor subtype by using correlation filters," IEEE/ACM Transactions on Computational Biology and Bioinformatics, 9(2), 2012,580-591.
[16]. Andreeva A., Howorth D., Chandonia J.M., Brenner S.E., Hubbard T.J.P., Chothia C., Murzin A.G. Data Growth And Its Impact On The SCOP Database: New Development,2007.