Open Access
Research article
A principal components approach to parent-to-newborn body
composition associations in South India
Sargoor R Veena*
1, Ghattu V Krishnaveni
1, Andrew K Wills
2,
Jacqueline C Hill
3and Caroline HD Fall
2Address: 1Epidemiology Research Unit, Holdsworth Memorial Hospital, Mysore, South India, 2MRC Epidemiology Resource Centre, Southampton
General Hospital, Southampton, UK and 3Department of Obstetrics and Gynaecology, Cure International Hospital, Kabul, Afghanistan
Email: Sargoor R Veena* - [email protected]; Ghattu V Krishnaveni - [email protected]; Andrew K Wills - [email protected]; Jacqueline C Hill - [email protected]; Caroline HD Fall - [email protected]
* Corresponding author
Abstract
Background: Size at birth is influenced by environmental factors, like maternal nutrition and parity, and by genes. Birth weight is a composite measure, encompassing bone, fat and lean mass. These may have different determinants. The main purpose of this paper was to use anthropometry and principal components analysis (PCA) to describe maternal and newborn body composition, and associations between them, in an Indian population. We also compared maternal and paternal measurements (body mass index (BMI) and height) as predictors of newborn body composition.
Methods: Weight, height, head and mid-arm circumferences, skinfold thicknesses and external pelvic diameters were measured at 30 ± 2 weeks gestation in 571 pregnant women attending the antenatal clinic of the Holdsworth Memorial Hospital, Mysore, India. Paternal height and weight were also measured. At birth, detailed neonatal anthropometry was performed. Unrotated and varimax rotated PCA was applied to the maternal and neonatal measurements.
Results: Rotated PCA reduced maternal measurements to 4 independent components (fat, pelvis, height and muscle) and neonatal measurements to 3 components (trunk+head, fat, and leg length). An SD increase in maternal fat was associated with a 0.16 SD increase (β) in neonatal fat (p < 0.001, adjusted for gestation, maternal parity, newborn sex and socio-economic status). Maternal pelvis, height and (for male babies) muscle predicted neonatal trunk+head (β = 0. 09 SD; p = 0.017, β = 0.12 SD; p = 0.006 and β = 0.27 SD; p < 0.001). In the mother-baby and father-baby comparison, maternal BMI predicted neonatal fat (β = 0.20 SD; p < 0.001) and neonatal trunk+head (β = 0.15 SD; p = 0.001). Both maternal (β = 0.12 SD; p = 0.002) and paternal height (β = 0.09 SD; p = 0.030) predicted neonatal trunk+head but the associations became weak and statistically non-significant in multivariate analysis. Only paternal height predicted neonatal leg length (β = 0.15 SD; p = 0.003).
Conclusion: Principal components analysis is a useful method to describe neonatal body composition and its determinants. Newborn adiposity is related to maternal nutritional status and parity, while newborn length is genetically determined. Further research is needed to understand mechanisms linking maternal pelvic size to fetal growth and the determinants and implications of the components (trunk v leg length) of fetal skeletal growth.
Published: 24 February 2009
BMC Pediatrics 2009, 9:16 doi:10.1186/1471-2431-9-16
Received: 20 August 2008 Accepted: 24 February 2009 This article is available from: http://www.biomedcentral.com/1471-2431/9/16
© 2009 Veena et al; licensee BioMed Central Ltd.
Background
A large body of recent research has linked birth weight and simple body proportions at birth like ponderal index (weight/length3) to a range of diseases of adult life [1,2].
For example lower birthweight and ponderal index are associated with an increased risk of adult cardiovascular disease [3], and both low and high birthweight with an increased risk of type 2 diabetes mellitus and the meta-bolic syndrome [4-8]. These studies have led to intense interest in fetal growth and its determinants. Factors known to influence fetal growth include the 'maternal environment' (for example the mother's nutritional status and parity) and maternal and paternal genes [9,10].
Birthweight is a crude composite measure encompassing bone, fat, muscle and visceral mass. The proportions of these components may differ between populations [11], and have different determinants and associations with long-term outcomes. Relatively little is known in this area. Several studies have examined associations between the anthropometry of mothers (and sometimes fathers) and their babies [12-14], but such data can be difficult to inter-pret, due to strong correlations between the different indi-ces of body composition. Others have overcome this by using principal components analysis [PCA], a statistical technique that transforms multiple observed variables into a smaller number of uncorrelated components that are interpretable [15-18]. In white Caucasian populations, PCA has fairly consistently identified fat (skinfold meas-urements) and skeletal size (length) as the main fetal components, with maternal body fat (skinfolds, BMI) and the skeletal size (height) of both parents respectively as their strongest predictors [15-17]. These findings have been corroborated by studies using more sophisticated measures of parental and newborn body composition, such as dual X-ray absorptiometry (DXA) [19-21].
An earlier study used PCA to describe neonatal anthro-pometry in relation to CVD risk factors in childhood an Indian population [18], but did not examine determi-nants of the neonatal components. Detailed anthropom-etry collected from mothers during pregnancy and their newborns in the Mysore Parthenon Study [22-24], ena-bled us to examine the body composition of mothers and babies in an Indian population. We included all body measurements recorded; for the mothers these included external pelvic diameters, which were of interest following an earlier Mysore study which showed that the risk of type 2 diabetes was increased in adult offspring of mothers with larger pelvic diameters [25], and for the babies the measurements included leg length in addition to crown-heel length, in view of recent interest in this measurement as a marker in adult life of poor growth in early develop-ment [26-29]. The main aim of this paper was to use anthropometry and principal components analysis (PCA)
to describe maternal and newborn body composition, and associations between them. Our secondary aim was to compare associations of maternal and paternal height and BMI with neonatal body composition.
Methods
Study Sample
Between June 1997 and August 1998, 1539 women book-ing consecutively into the antenatal clinic at the Holds-worth Memorial Hospital (HMH), Mysore were screened [22]. They were eligible for the study if they were not known to be diabetic before pregnancy, planned to deliver at HMH, and had a singleton pregnancy of < 32 weeks gestation, determined by their last menstrual period (LMP) or a first trimester ultrasound scan. Of the women screened, 1233 women were eligible and 830 (67%) agreed to participate. The study was approved by the HMH research ethics committee and informed verbal consent was obtained from the women.
Maternal measurements during pregnancy
At 30 ± 2 weeks gestation, detailed maternal anthropo-metric measurements including height, weight, head and mid-upper arm circumference (MUAC), skin fold thick-nesses (triceps, biceps, subscapular and suprailiac) and external pelvic diameters (interspinous, intercristal and external conjugate) were measured by one of two trained observers using standardised methods. A Harpenden anthropometer (CMS instruments, London, UK) was used to measure external pelvic diameters. Measurements were taken in triplicate to the nearest 0.1 cm and average was used. The subject was asked to stand up straight with feet slightly apart and with the lower abdomen completely exposed to identify and mark the bony landmarks. Interc-ristal diameter was measured taking the widest transverse measurement, with the subject standing face on, by plac-ing the tips of the callipers on the outer margins of the iliac crests. Interspinous diameter was measured, with the subject standing face on, by placing the tips of the calli-pers on the outer edges of the anterior superior iliac spines. External conjugate diameter was measured, with the subject standing side on, by placing one calliper tip on the anterior, upper margin of the pubic symphysis and the other on the spine of the last lumbar vertebra. Inter observer variation studies done at the time of data collec-tion showed the amount of variacollec-tion attributable to observers was only 0.004%, 0.8% and 1.2% for inter-spinous, intercristal and external conjugate measurements respectively. Maternal arm muscle area (AMA (cm2)) was
calculated using the formula [(MUAC-π*triceps skin-fold)2/4 π] [30]. We measured their husband's height and
standard questionnaire method based on education, occupation and income of the main breadwinner [31]. We asked mothers about tobacco smoking, but none of the women were smokers.
Deliveries and measurements of babies at birth
Six hundred and seventy four women went on to deliver their babies at HMH (81% of the participants), at a gesta-tional age ranging from 29 to 44 weeks. Detailed newborn anthropometry was performed according to a standard protocol, within 72 hours of birth, by one of four trained observers. Weight was measured using a digital weighing scale (Seca, Germany) and heel (CHL) and crown-rump (CRL) lengths using a Harpenden neonatal stadi-ometer (CMS instruments, London). Head, chest (xiphisternum), abdominal (umbilicus) and MUAC were measured with a blank tape, marked and measured
against a fixed ruler. Skinfold thicknesses (triceps and sub-scapular) were measured using Harpenden skin-fold calli-pers (CMS instruments, London). Of 674 babies, 324 (48.1%) were male and 350 (51.9%) female. Seven still born babies, 4 with major congenital anomalies, 51 pre-term babies (< 37 weeks gestation) and 41 babies born to mothers with gestational diabetes (GDM) were excluded from this analysis, leaving 571 mother-offspring pairs (Figure 1).
Statistical Methods
Variables not satisfying normality assumptions were either log transformed (maternal weight, body mass index (BMI), maternal and neonatal skin-fold thicknesses) or square root transformed (supra-iliac skin-fold). Birth measurements (unadjusted for gestation) were used in PCA to describe neonatal body composition. Two PCAs
Flow diagram depicting the study participants included for analysis Figure 1
Flow diagram depicting the study participants included for analysis.
Not eligible (n=306)
Did not Participate (n=403)
Did not deliver at HMH No details (n=156)
11 Excluded
(7 Still births + 4 major anomalies)
92 Excluded (51 Preterm + 41 born to GDM) Eligible
(n=1233)
Attended clinic for OGTT and Anthropometry (n=830
Births at HMH (n=674) 27.6% of all births at
HMH at that period Recr uitment Cr iter ia a) Singleton pregnancy b) Not diabetic before pregnancy c) Planned to Deliver at HMH
d) <32 weeks of gestation based on LMP or First trimester scan
Screened (n=1539)
Live births without major anomalies (n=663)
were performed to describe the relationships between the neonatal variables and between the maternal variables. PCA is a dimension-reduction technique [32]. The aim was to reduce the anthropometric variables into smaller sets of independent factors that retained the information that distinguished individual differences between babies or mothers. The extracted components are a weighted lin-ear composite of the original variables. The first compo-nent explains the most variance and each subsequent component attempts to capture the maximum of the remaining variance. Each component is orthogonal or independent of earlier components. The factor loadings reflect the contribution and direction of correlation between each variable and component. These are used for interpretation, and as such the retained factors should be biologically meaningful. Similar to a previous study [17], we examined the use of a factor rotation (varimax) to more clearly distinguish those variables that correlate highly with each component and aid interpretation. Standardised factor scores with a mean of 0 and standard deviation of 1 were ultimately produced using the rotated PCA. The correlation matrix was used to perform the PCA. Since similar factors were identified in both boys and girls, the sexes were pooled.
Factors were retained based on the % of variation explained (we investigated the plausibility of factors explaining < 10%), an inspection of the scree plots and also whether they were physiologically interpretable. The standardised neonatal and maternal factor scores were then used as variables to assess the mother-baby relation-ships. Associations between maternal components and each neonatal component were estimated using simple regression. The first set of models contained all maternal components together (they are independent so there is no confounding) and were also adjusted for gender. Effects in boys and girls were stratified where there was a statistically significant interaction (p < 0.05). Additional models were then produced with further adjustment for parity, SES and gestational age. In the regression analysis we have exam-ined the associations between maternal components and neonatal leg length (standardised) instead of leg compo-nent as the correlation between neonatal leg factor and leg length and crown to heel is so strong that there ceases to be any extra additional information from using this factor as opposed to just leg alone, regardless of the correlation with crown to heel. And actual leg length is remarkably uncorrelated with factors 1 and 2 either.
Since we had limited anthropometric data on the father, comparisons between father-baby and mother-baby asso-ciations were restricted to parental height and BMI. Simi-lar to the above, 2 sets of models were produced, the first adjusted only for gender (interactions were also tested), and in the second maternal and paternal variables
included together in the model and further adjusted for parity, SES and gestational age. Stata v10 was used for all analyses.
Results
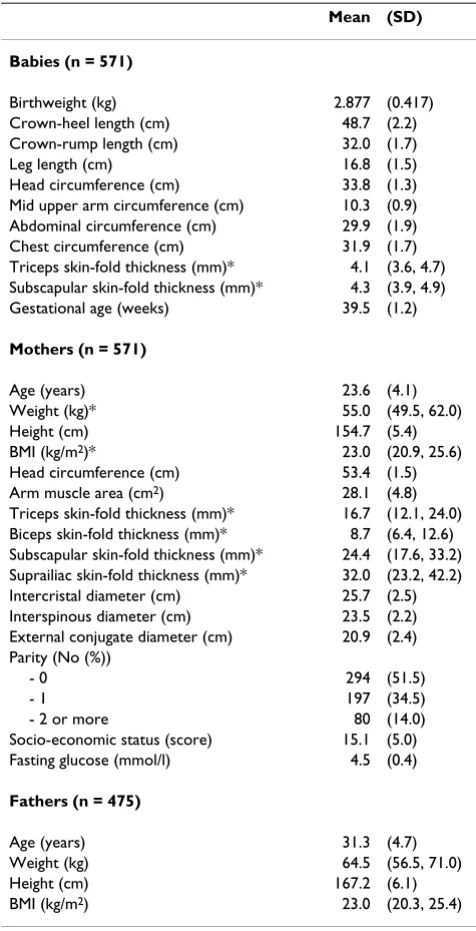
Excluding preterm births from the analysis, anthropomet-ric characteristics of the babies and mothers are summa-rised in Table 1. Mothers had a mean age of 24 years with a mean height of 154.7 cm and a median BMI of 23 kg/ m2, and 51% were primiparous. Fathers had a mean age
of 31 years with a mean height of 167.2 cm and a median BMI of 23 kg/m2.
Table 1: Characteristics of the study cohort
Mean (SD)
Babies (n = 571)
Birthweight (kg) 2.877 (0.417) Crown-heel length (cm) 48.7 (2.2) Crown-rump length (cm) 32.0 (1.7) Leg length (cm) 16.8 (1.5) Head circumference (cm) 33.8 (1.3) Mid upper arm circumference (cm) 10.3 (0.9) Abdominal circumference (cm) 29.9 (1.9) Chest circumference (cm) 31.9 (1.7) Triceps skin-fold thickness (mm)* 4.1 (3.6, 4.7) Subscapular skin-fold thickness (mm)* 4.3 (3.9, 4.9) Gestational age (weeks) 39.5 (1.2)
Mothers (n = 571)
Age (years) 23.6 (4.1)
Weight (kg)* 55.0 (49.5, 62.0)
Height (cm) 154.7 (5.4)
BMI (kg/m2)* 23.0 (20.9, 25.6) Head circumference (cm) 53.4 (1.5) Arm muscle area (cm2) 28.1 (4.8) Triceps skin-fold thickness (mm)* 16.7 (12.1, 24.0) Biceps skin-fold thickness (mm)* 8.7 (6.4, 12.6) Subscapular skin-fold thickness (mm)* 24.4 (17.6, 33.2) Suprailiac skin-fold thickness (mm)* 32.0 (23.2, 42.2) Intercristal diameter (cm) 25.7 (2.5) Interspinous diameter (cm) 23.5 (2.2) External conjugate diameter (cm) 20.9 (2.4) Parity (No (%))
- 0 294 (51.5)
- 1 197 (34.5)
- 2 or more 80 (14.0)
Socio-economic status (score) 15.1 (5.0) Fasting glucose (mmol/l) 4.5 (0.4)
Fathers (n = 475)
Age (years) 31.3 (4.7)
Weight (kg) 64.5 (56.5, 71.0)
Height (cm) 167.2 (6.1)
BMI (kg/m2) 23.0 (20.3, 25.4)
Principal components analysis
Babies
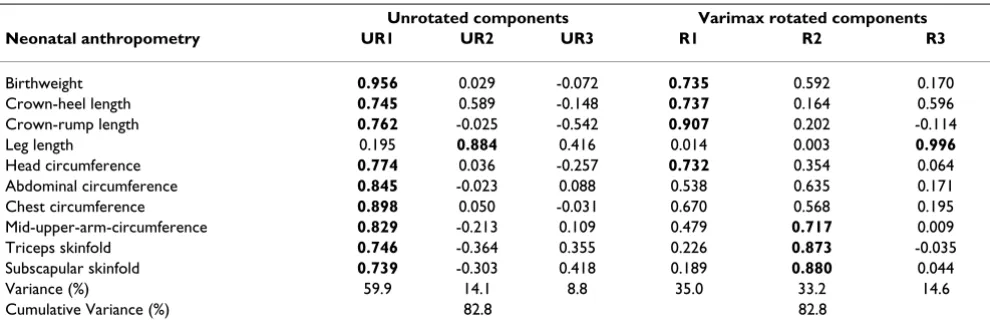
PCA reduced the 10 birth measurements to three compo-nents (Table 2). The varimax rotation more clearly distin-guished the newborn components. The first component (explaining 35% of variance) showed high correlations with birthweight, crown-heel and crown-rump length and head circumference, the second (33% of variance) showed high correlations with MUAC, triceps and sub-scapular skin folds and the third (15% of variance) showed a high correlation with leg length. We interpreted them as 'truncal skeleton+head', 'fat' and 'leg length' com-ponents respectively. Since actual leg length was so strongly correlated with neonatal factor 3 (r = 0.99), and also showed very little correlation with factors 1 (r = 0.01) and 2 (r = -0.00), we substituted it for the principal com-ponent in the regression analysis, to increase clinical rele-vance. Whether we used factor 3 or actual leg length made no difference to the overall interpretation.
Mothers
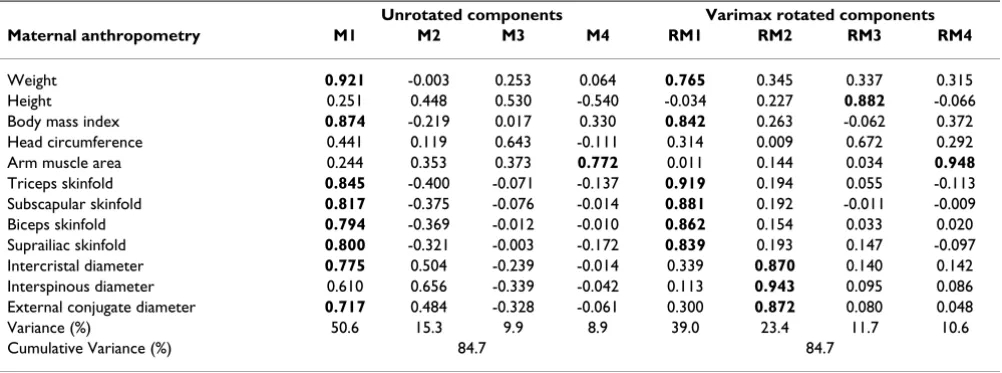
PCA reduced the 12 maternal anthropometric measure-ments to four components (Table 3), and again the rotated analysis produced clearer differentiation between measurements. The first component (explaining 39% of variance) was correlated with weight, BMI, and all four skin folds. The second (23% of variance) was correlated with all three pelvic measurements. The third and fourth components (12% and 11% of variance) were correlated with height and AMA respectively. We interpreted these components as maternal 'fat', 'pelvis', 'height' and 'mus-cle'.
Relationships of maternal components to neonatal components
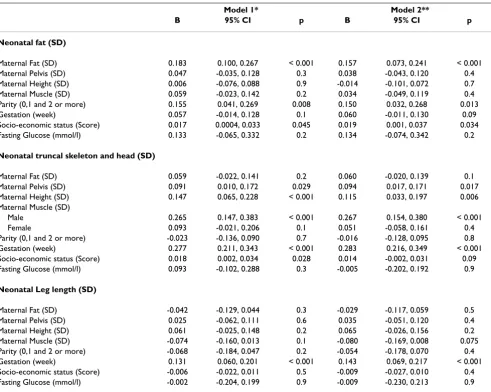
Of the four maternal components, fat was the strongest and only significant predictor of neonatal fat (Table 4). An SD increase in maternal fat was associated with a 0.16 SD increase in neonatal fat. Maternal pelvis and height, and for boys only, maternal muscle (p for sex interaction = 0.007), positively predicted neonatal truncal skele-ton+head. None of the maternal components was related to neonatal leg length.
Relationships of maternal parity, gestation, SES and glucose to neonatal components
Higher maternal parity was associated with increased neo-natal fat (Table 4). Higher socio-economic status was associated with increased neonatal fat and truncal skele-ton+head. Longer gestation was associated with larger neonatal truncal skeleton+head and longer leg length, but no increase in fat. There were no significant associations between maternal fasting glucose and neonatal compo-nents.
Comparison of maternal and paternal associations with neonatal components
Maternal BMI predicted neonatal fat and truncal skele-ton+head, more strongly than paternal BMI, and in the multivariable analysis, only maternal BMI remained a sig-nificant independent predictor of these neonatal compo-nents (Table 5). Paternal height predicted neonatal leg length more strongly than maternal height, and in the multivariable analysis remained the only significant pre-dictor of neonatal leg length. Both maternal and paternal height predicted neonatal truncal skeleton+head, although both associations were of borderline statistical significance in the multivariate analysis.
Table 2: Principal components analysis: Unrotated and Varimax rotated components matrix of neonatal anthropometry.
Unrotated components Varimax rotated components Neonatal anthropometry UR1 UR2 UR3 R1 R2 R3
Birthweight 0.956 0.029 -0.072 0.735 0.592 0.170
Crown-heel length 0.745 0.589 -0.148 0.737 0.164 0.596
Crown-rump length 0.762 -0.025 -0.542 0.907 0.202 -0.114
Leg length 0.195 0.884 0.416 0.014 0.003 0.996
Head circumference 0.774 0.036 -0.257 0.732 0.354 0.064
Abdominal circumference 0.845 -0.023 0.088 0.538 0.635 0.171
Chest circumference 0.898 0.050 -0.031 0.670 0.568 0.195
Mid-upper-arm-circumference 0.829 -0.213 0.109 0.479 0.717 0.009
Triceps skinfold 0.746 -0.364 0.355 0.226 0.873 -0.035
Subscapular skinfold 0.739 -0.303 0.418 0.189 0.880 0.044
Variance (%) 59.9 14.1 8.8 35.0 33.2 14.6
Cumulative Variance (%) 82.8 82.8
Values are factor loadings (correlation co-efficient of the relationship between the factors produced and the individual anthropometric
Discussion
Summary of main findings
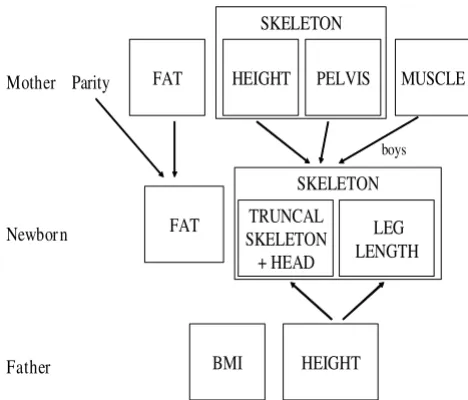
We used principal components analysis to study body composition in a large sample of healthy urban South Indian pregnant mothers and their full term newborn babies. Rotated PCA extracted four maternal components, which we interpreted as fat, pelvic size, height and muscle, and three neonatal (baby) components, interpreted as truncal skeleton+head, fat and leg length. We found that maternal fat predicted neonatal fat. The mother's pelvic size and height, and for boys maternal muscle, predicted neonatal truncal skeleton+head. In a comparison between maternal and paternal associations with newborn size, maternal (but not paternal) BMI predicted neonatal fat and neonatal truncal skeleton+head, while paternal (but not maternal) height predicted neonatal leg length. These findings are summarised in Figure 2.
Strengths and weaknesses of the study
Strengths of the study were the detailed standardised anthropometric measurements for mothers and babies, including measurements not available in other studies (pelvic size for mothers and leg length for babies). Weak-nesses were that there was no information on maternal weight gain during pregnancy, that the maternal measure-ments were collected during the third trimester of preg-nancy (which means that maternal weight included fetal weight and that skinfolds could reflect fluid retention as well as adiposity), and that paternal measurements were limited to weight and height.
Principal components analysis (newborns)
Several other studies have used PCA to examine newborn body composition in different populations [15-18]. Each used slightly different newborn measurements, although there was considerable overlap, and all had birth weight, crown-heel length, head circumference, mid-arm circum-ference and triceps and subscapular skinfolds. One of these was from another Indian population [18]. They all used a similar analysis to ours, putting all newborn meas-urements into the analysis together, and one study used the varimax rotation [17]. The studies using unrotated analyses [15,16,18] produced similar results, identifying two main components: firstly, overall size (with high loadings on all measurements) and secondly, a contrast between skeleton and fat (strong loadings in opposite directions for length and/or head versus skinfolds). The study that used varimax rotation, of white Caucasian babies from Exeter, UK [17] showed, as in our study, that this technique produced clearer differentiation between components. It too identified fat and skeleton (length+head), as the two main components. Our study differed from the Exeter study in differentiating leg length from crown-rump (trunk) length. Unlike knee-heel length in Exeter (the nearest equivalent in the Exeter study to leg length in our study) leg length did not have a strong factor loading in our neonatal R1 and was the only measure-ment with a strong factor loading in our neonatal R3 (Table 2). None of the other neonatal PCA studies had a separate measure of leg length.
Principal components analysis (mothers)
The Exeter study also performed PCA on maternal meas-urements [17]. As in Mysore, the first two principal
com-Table 3: Principal component analysis: Unrotated and Varimax rotated components matrix of maternal anthropometry.
Unrotated components Varimax rotated components Maternal anthropometry M1 M2 M3 M4 RM1 RM2 RM3 RM4
Weight 0.921 -0.003 0.253 0.064 0.765 0.345 0.337 0.315
Height 0.251 0.448 0.530 -0.540 -0.034 0.227 0.882 -0.066
Body mass index 0.874 -0.219 0.017 0.330 0.842 0.263 -0.062 0.372 Head circumference 0.441 0.119 0.643 -0.111 0.314 0.009 0.672 0.292 Arm muscle area 0.244 0.353 0.373 0.772 0.011 0.144 0.034 0.948
Triceps skinfold 0.845 -0.400 -0.071 -0.137 0.919 0.194 0.055 -0.113 Subscapular skinfold 0.817 -0.375 -0.076 -0.014 0.881 0.192 -0.011 -0.009 Biceps skinfold 0.794 -0.369 -0.012 -0.010 0.862 0.154 0.033 0.020 Suprailiac skinfold 0.800 -0.321 -0.003 -0.172 0.839 0.193 0.147 -0.097 Intercristal diameter 0.775 0.504 -0.239 -0.014 0.339 0.870 0.140 0.142 Interspinous diameter 0.610 0.656 -0.339 -0.042 0.113 0.943 0.095 0.086 External conjugate diameter 0.717 0.484 -0.328 -0.061 0.300 0.872 0.080 0.048
Variance (%) 50.6 15.3 9.9 8.9 39.0 23.4 11.7 10.6
Cumulative Variance (%) 84.7 84.7
ponents loaded strongly on skeletal measurements (height and head circumference) and fat (skinfolds). In the Mysore data, we identified maternal pelvic size (all three pelvic measurements) and maternal muscle (arm muscle area) as two additional components. These data were not available in the Exeter study.
Relationships between maternal and newborn body composition
We found that the maternal fat component was a strong, and the only, predictor of neonatal fat. This is consistent with other studies, that have used skinfolds, or other spe-cific measurements of neonatal adiposity (including TOBEC and DXA) [19,20]. Along with our finding that maternal BMI, and not paternal BMI, predicted neonatal fat, this adds to other evidence that newborn adiposity is determined principally by factors operating through the
mother [9,17]. These are likely to include the availability of nutrients, and their transfer to the fetus. As shown in other studies [9,17,33,34], neonatal fat was also increased in mothers of higher parity, which may reflect more effi-cient materno-fetal nutrient transfer in 'experienced' mothers. Women of higher parity tend to be heavier and fatter, which could explain some of this effect, but the association between parity and newborn fat remained sta-tistically significant even in the multivariate analysis, which included all maternal body composition compo-nents, suggesting that parity has an independent effect on newborn adiposity. It is well known that babies born to diabetic mothers have increased body fat at birth [9] due to transfer of glucose across the placenta. The Exeter study, and the large, recently published multi-centre HAPO study, showed that even in non-diabetic pregnancies, neo-natal adiposity is positively related to maternal fasting
Table 4: Regression analysis of maternal components, fasting glucose, parity, socio-economic status and gestation as predictors of neonatal components
Model 1* Model 2**
B 95% CI p B 95% CI p
Neonatal fat (SD)
Maternal Fat (SD) 0.183 0.100, 0.267 < 0.001 0.157 0.073, 0.241 < 0.001 Maternal Pelvis (SD) 0.047 -0.035, 0.128 0.3 0.038 -0.043, 0.120 0.4 Maternal Height (SD) 0.006 -0.076, 0.088 0.9 -0.014 -0.101, 0.072 0.7 Maternal Muscle (SD) 0.059 -0.023, 0.142 0.2 0.034 -0.049, 0.119 0.4 Parity (0,1 and 2 or more) 0.155 0.041, 0.269 0.008 0.150 0.032, 0.268 0.013 Gestation (week) 0.057 -0.014, 0.128 0.1 0.060 -0.011, 0.130 0.09 Socio-economic status (Score) 0.017 0.0004, 0.033 0.045 0.019 0.001, 0.037 0.034 Fasting Glucose (mmol/l) 0.133 -0.065, 0.332 0.2 0.134 -0.074, 0.342 0.2
Neonatal truncal skeleton and head (SD)
Maternal Fat (SD) 0.059 -0.022, 0.141 0.2 0.060 -0.020, 0.139 0.1 Maternal Pelvis (SD) 0.091 0.010, 0.172 0.029 0.094 0.017, 0.171 0.017 Maternal Height (SD) 0.147 0.065, 0.228 < 0.001 0.115 0.033, 0.197 0.006 Maternal Muscle (SD)
Male 0.265 0.147, 0.383 < 0.001 0.267 0.154, 0.380 < 0.001
Female 0.093 -0.021, 0.206 0.1 0.051 -0.058, 0.161 0.4
Parity (0,1 and 2 or more) -0.023 -0.136, 0.090 0.7 -0.016 -0.128, 0.095 0.8 Gestation (week) 0.277 0.211, 0.343 < 0.001 0.283 0.216, 0.349 < 0.001 Socio-economic status (Score) 0.018 0.002, 0.034 0.028 0.014 -0.002, 0.031 0.09 Fasting Glucose (mmol/l) 0.093 -0.102, 0.288 0.3 -0.005 -0.202, 0.192 0.9
Neonatal Leg length (SD)
Maternal Fat (SD) -0.042 -0.129, 0.044 0.3 -0.029 -0.117, 0.059 0.5 Maternal Pelvis (SD) 0.025 -0.062, 0.111 0.6 0.035 -0.051, 0.120 0.4 Maternal Height (SD) 0.061 -0.025, 0.148 0.2 0.065 -0.026, 0.156 0.2 Maternal Muscle (SD) -0.074 -0.160, 0.013 0.1 -0.080 -0.169, 0.008 0.075 Parity (0,1 and 2 or more) -0.068 -0.184, 0.047 0.2 -0.054 -0.178, 0.070 0.4 Gestation (week) 0.131 0.060, 0.201 < 0.001 0.143 0.069, 0.217 < 0.001 Socio-economic status (Score) -0.006 -0.022, 0.011 0.5 -0.009 -0.027, 0.010 0.4 Fasting Glucose (mmol/l) -0.002 -0.204, 0.199 0.9 -0.009 -0.230, 0.213 0.9
glucose concentrations [17,35]. We did not find this asso-ciation in our data; although we have shown previously in this cohort that fasting glucose concentrations in non-dia-betic mothers predicted newborn ponderal index [22]. The association between maternal fasting glucose, and the newborn fat component, was positive in our study but non-significant. This may be because the sample size was too small; we calculate that our study had only 50%
power to detect an effect of the magnitude shown in the HAPO study.
The strongest maternal predictor of the neonatal truncal skeleton+head component was maternal height. Other maternal predictors, independent of this association, were pelvic size and (in male babies) muscle. The babies' trun-cal skeleton+head component was also positively related to paternal height and to gestation. The correlation with both maternal and paternal height supports other evi-dence that genetic factors make an important contribu-tion to fetal skeletal growth [10,21,36,37].
The association of neonatal trunk length with maternal pelvic size, independent of other maternal measurements, is a new finding. External pelvic diameters are thought to be chiefly measurements of the bony skeleton, although they also incorporate subcutaneous fat. Our data suggest that pelvic size varies independently of maternal height, and of our index of maternal fat. Several studies have shown associations between maternal pelvic measure-ments and adult disease in the offspring, including stroke, hypertension, diabetes and cancer [25,38-41]. A recent study showed that the mother's intercristal diameter, but not height, predicted breast cancer in the adult female off-spring [40]. The authors suggested that the growth of pel-vic width is influenced by circulating oestrogen concentrations during puberty, whereas overall height is more strongly influenced by growth hormone. We are not able to comment on the implications of this for fetal
Table 5: Regression analysis of maternal and paternal height and BMI as predictors of neonatal components
Model 1** Model 2***
B 95% CI p B 95% CI p
Neonatal fat (SD)
Maternal Height (SD) -0.0002 -0.082, 0.082 0.9 0.027 -0.072, 0.126 0.6 Maternal BMI (SD)* 0.219 0.139, 0.299 < 0.001 0.203 0.108, 0.297 < 0.001 Paternal Height (SD) -0.036 -0.128, 0.055 0.4 -0.046 -0.141, 0.049 0.3 Paternal BMI (SD) 0.116 0.025, 0.207 0.013 0.055 -0.039, 0.149 0.3
Neonatal truncal skeleton and head (SD)
Maternal Height (SD) 0.124 0.044, 0.204 0.002 0.075 -0.014, 0.164 0.1 Maternal BMI (SD)* 0.178 0.099, 0.257 < 0.001 0.145 0.060, 0.230 0.001 Paternal Height (SD) 0.094 0.007, 0.181 0.030 0.081 -0.004, 0.166 0.063 Paternal BMI (SD) 0.095 0.009, 0.182 0.031 0.058 -0.027, 0.143 0.2
Neonatal leg length (SD)
Maternal Height (SD) 0.083 0.0007, 0.166 0.048 0.064 -0.037, 0.165 0.2 Maternal BMI (SD)* -0.055 -0.139, 0.028 0.2 -0.032 -0.129, 0.065 0.5 Paternal Height (SD) 0.147 0.055, 0.238 0.002 0.145 0.048, 0.241 0.003 Paternal BMI (SD) -0.039 -0.131, 0.054 0.4 -0.014 -0.109 0.082 0.8
* Logged variable; **Model 1: Adjusted for sex only. Each variable shown was included singly in regression model; ***Model 2: All maternal and paternal variables were included together in the model, which were also adjusted for parity, gestation, sex and socio-economic status.
Relationships between parental and newborn size Figure 2
Relationships between parental and newborn size. Mother
Newbor n
Father
Parity FAT HEIGHT PELVIS MUSCLE
SKELETON
TRUNCAL SKELETON + HEAD
SKELETON
FAT LEG
LENGTH
HEIGHT BMI
development other than to say that the mother's pelvic size appears to reflect something more than her overall skeletal size and adiposity. More research into female pel-vic development, and its relationship to fetal growth, is needed.
Relationships of maternal muscle to neonatal size have not been widely studied. Similar to our findings, maternal arm muscle area predicted neonatal length and not neo-natal fat in a Peruvian population [42]. A recent study examining geographical variation in relationships between maternal body size and neonatal phenotype reported a significant association between maternal mus-cle and neonatal length in an African (DR Congo) popu-lation but not in other popupopu-lations (including one other Indian population) [13]. Arm muscle area is an unsatis-factory measurement of maternal muscle mass, however, and more research is required to address associations between maternal muscle and fetal growth.
The third neonatal component, leg length, was predicted by paternal height. While the determinants of leg length at birth have been little studied, short leg length in child-hood has been associated with maternal smoking and with poor childhood SES [43,44]. It has been described as a more sensitive indicator of the childhood environment than overall height [43,44]. Studies have also reported stronger associations of short leg length than of short overall height with elevated adult insulin resistance and cortisol concentrations and with an increased risk of dia-betes and cardiovascular disease, suggesting important biological differences between these two length measure-ments [26-29]. The association between leg length and paternal height suggests that newborn leg length is at least partly genetically determined.
An exact equivalent of leg length was not available in the Exeter study, but leg length was measured using the same technique as ours in the Southampton Women's Survey [45]. Leg length in Southampton babies (mean = 16.5 cm) was almost identical to Mysore babies (16.7 cm) whereas crown-rump length was longer (mean = 33.6 cm in South-ampton and 32.0 cm in Mysore), (Sarah Crozier, personal communication). One possible explanation for our find-ings is that the greater muscularity of UK babies (includ-ing larger buttock muscularity) makes leg length (as measured by crown-heel length minus crown-rump length) appear falsely short in the UK babies. However, a fetal ultrasound study in India showed comparable femur length measurements to western studies, even though birthweight was lower [46]. In another Indian study, crown-heel length was relatively preserved (-1.01 SD com-pared with UK babies), even though birthweight was con-siderably lighter (-1.74 SD) [11]. Another interpretation of our data is therefore that leg growth is preserved in
Indian babies, even in the presence of marked growth restriction. The issue of whether the small Indian baby is growth-restricted or appropriate for maternal size is a much-debated question. Birth weight has risen in the upper socio-economic strata of the Indian population, as maternal heights have increased, suggesting that the small babies of small mothers have not realised their 'potential'. Lower birth weight is associated with higher infant mor-tality in India, and with higher cardiovascular disease risk factors in Indian children [47]. There are also strong asso-ciations between low birthweight and childhood stunting, lower educational achievement, and lower birthweight in the next generation, independent of early-life socio-eco-nomic status [48]. Hence, we think that growth restriction is an appropriate description.
Conclusion
In conclusion, the neonatal anthropometric variables in Mysore showed a broadly similar underlying variance structure to that shown in other studies. Neonatal leg length was an important independent component in the babies, and pelvic diameters formed an independent com-ponent in the mothers; neither of these measurements were included in earlier PCA studies. Our findings are in keeping with previous research suggesting that newborn adiposity is influenced by the mother's nutritional status and parity, while neonatal length is genetically influ-enced. Our study has indicated areas for future research, including pelvic growth and the mechanisms by which maternal pelvic size are related to fetal growth, and the implications of truncal skeletal growth versus leg growth in the fetus. The neonatal components we identified will be useful in studying associations between other maternal exposures (such as micronutrient status) and fetal devel-opment, and between newborn size and later outcomes such as cognitive function and risk markers for adult dis-ease.
Competing interests
The authors declare that they have no competing interests.
Authors' contributions
Acknowledgements
We are grateful to all the women who participated in the study, to Dr BDR Paul and Dr Prasad Karat (former and current Medical Director) and staff of the Department of Obstetrics, HMH. We acknowledge the contribution made to the study by Ms Annamma, Mrs Baby, Late Mrs Devaki, Mrs Lalitha, Mrs Lalithakala, Mrs Savitha, Mrs Swarnagowri and Mrs Surekha. We acknowledge the support by SNEHA-India. The study was supported by the Parthenon Trust, Wellcome Trust and Medical Research Council, UK.
References
1. Barker DJP: Mothers, babies and health in later life. Churchill Livingstone, London; 1998.
2. Gluckman PD, Hanson MH, (Eds): Developmental Origins of Health and Disease. Cambridge University Press; 2006. 3. Eriksson JG, Forsen T, Tuomilehto J, Winter PD, Osmond C, Barker
DJP: Catch-up growth in childhood and death from coronary heart disease: longitudinal study. BMJ 1999, 318:427-431. 4. Hales CN, Barker DJP, Clark PMS, Cox LJ, Fall CHD: Fetal and
infant growth and impaired glucose tolerance at age 64 years. BMJ 1991, 303:1019-22.
5. Barker DJP, Hales CN, Fall CHD, Osmond C, Phipps K, Clark PMS:
Non-insulin dependent diabetes, hypertension and hyperlip-idaemia (Syndrome X): relation with reduced fetal growth. Diabetologia 1993, 36:62-67.
6. Rich-Edwards JW, Colditz GA, Stampfer MJ, Willett WC, Gillman MW, Hennekens CH, Speizer FE, Manson JE: Birthweight and the risk of type 2 diabetes mellitus in adult women. Ann Intern Med
1999, 130:278-284.
7. Boney CM, Verma A, Tucker R, Vohr BR: Metabolic syndrome in childhood: association with birth weight, maternal obesity and gestational diabetes. Pediatrics 2005, 115:290-296. 8. Whincup PH, Kaye SJ, Owen CG, Huxley R, Cook DG, Anazawa S,
Barrett-Connor E, Bhargava SK, Birgisdottir B, Carlsson S, De Rooij S, Dyck R, Eriksson JG, Falkner B, Fall CHD, Forsen T, Grill V, Gud-nason V, Hulman S, Hypponen E, Jeffreys E, Lawlor D, Leon D, Mi J, Minami J, Mishra G, Osmond C, Power C, Rich-Edwards J, Roseboom TJ, Sachdev HPS, Suzuki T, Syddall H, Thorsdottir I, Vanhala M, Wadsworth M, Yarbrough DE: Birthweight and risk of type 2 dia-betes: a quantitative systematic review of published evi-dence. JAMA 2008, 300:2885-97.
9. Catalano PM, Drago NM, Amini SB: Factors affecting fetal growth and body composition. Am J Obstet Gynecol 1995, 172:1459-1463. 10. Knight B, Shields BM, Turner M, Powell RJ, Yajnik CS, Hattersley AT:
Evidence of genetic regulation of fetal longitudinal growth. Early Hum Dev 2005, 81:823-31.
11. Yajnik CS, Fall CHD, Coyaji KJ, Hirve SS, Rao S, Barker DJP, Joglekar C, Kellingray S: Neonatal anthropometry: the thin-fat Indian baby; the Pune Maternal Nutrition Study. Int J Obesity 2003,
27:173-180.
12. Fall CHD, Yajnik CS, Shobha R, Koyaji KJ, Shier RP: The effects of maternal body composition before pregnancy on fetal growth: the Pune maternal nutrition and fetal growth study.
Edited by: O'Brien PMS, Wheeler T, Barker DJP. Fetal programming: Influences on Development and Disease in later life. London, RCOG press; 1999:231-245.
13. Leary S, Fall C, Osmond C, Lovel H, Campbell D, Eriksson J, Forrester T, Godfrey K, Hill J, Jie M, Law C, Newby R, Robinson S, Yajnik C:
Geographical variation in relationships between parental body size and offspring Phenotype at birth. Acta Obstet Gynecol Scand 2006, 85:1066-1079.
14. Neggers Y, Goldenberg RL, Cliver SP, Hoffman HJ, Cutter GR: The relationship between maternal and neonatal anthropomet-ric measurements in term newborns. Obstet Gynecol 1995,
85:192-196.
15. Denham M, Schell LM, Gallo M, Stark A: Neonatal size of low socio-economic status Black and White term births in Albany County, NYS. Ann Hum Biol 2001, 28:172-183.
16. Hindmarsh PC, Geary MP, Rodeck CH, Kingdom JC, Cole TJ: Intra-uterine growth and its relationship to size and shape at birth. Pediatr Res 2002, 52:263-268.
17. Shields BM, Knight BA, Powell RJ, Hattersley AT, Wright DE: Assess-ing newborn body composition usAssess-ing principal components analysis: differences in the determinants of fat and skeletal size. BMC Pediatrics 2006, 6:24.
18. Joglekar C, Fall CHD, Deshpande VU, Joshi N, Bhalerao A, Solat V, Deokar TM, Chougule SD, Leary SD, Osmond C, Yajnik CS: New-born size, and childhood growth, and cardiovascular disease risk factors at the age of 6 years; The Pune Maternal Nutri-tion Study. Int J Obesity 2007, 31:1534-44.
19. Catalano PM, Thomas A, Huston-Presley L, Amini SB: Increased fetal adiposity: a very sensitive marker of abnormal in utero development. Am J Obstet Gynecol 2003, 189:1698-1704. 20. Silliman K, Kretchmer N: Maternal obesity and body
composi-tion of the neonate. Biol Neonate 1995, 68:384-393.
21. Godfrey K, Walker-Bone K, Robinson S, Taylor P, Shore S, Wheeler T, Cooper C: Neonatal bonemass: influence of parental birth-weight, maternal smoking, body composition, and activity during pregnancy. J Bone Miner Res 2001, 16:1694-703.
22. Hill JC, Krishnaveni GV, Annamma I, Leary SD, Fall CHD: Glucose tolerance in pregnancy in South India: Relationships to neo-natal anthropometry. Acta Obstet Gynecol Scand 2005,
84:159-165.
23. Krishnaveni GV, Hill JC, Veena SR, Leary SD, Saperia J, Chachyamma KJ, Karat SC, Fall CHD: Truncal adiposity is present at birth and in early childhood in South Indian children. Indian Pediatrics
2005, 42:527-538.
24. Krishnaveni GV, Hill JC, Leary S, Veena SR, Saperia J, Saroja A, Karat SC, Fall CHD: Anthropometry, glucose tolerance and insulin concentrations in Indian children: relationships to maternal glucose and insulin concentrations during pregnancy. Diabe-tes Care 2005, 28:2919-25.
25. Fall CHD, Stein CE, Kumaran K, et al.: Size at birth, maternal weight, and type2 diabetes in South India. Diabet Med 1998,
15:220-227.
26. Lawlor DA, Davey Smith G, Ebrahim S: Life course influences on insulin resistance: findings from the British Women's Heart and Health Study. Diabetes Care 2003, 26:97-103.
27. Lawlor DA, Davey Smith G, Ebrahim S: Association between leg length and offspring birthweight: partial explanation for the trans-generational association between birthweight and car-diovascular disease: findings from the British Women's Heart and Health Study. Paediatr Perinat Epidemiol 2003,
17:148-55.
28. Kulkarni SR, Fall CH, Joshi NV, Lubree HG, Deshpande VU, Pasarkar RV, Bhat DS, Naik SS, Yajnik CS: Determinants of incident hyper-glycemia 6 years after delivery in young rural Indian moth-ers: the Pune Maternal Nutrition Study (PMNS). Diabetes care
2007, 30:2542-2547.
29. Phillips DI, Syddall HE, Cooper C, Hanson MA: Association of adult height and leg length with fasting plasma cortisol concentra-tions: Evidence for an effect of normal variation in adreno-cortical activity on growth. Am J Hum Biol 2008, 20:712-715. 30. Jelliffe DB, Jelliffe EFP: Prevalence of protein-calorie
malnutri-tion in Haitian preschool children. Am J Public Health 1960,
50:1355-1366.
31. Kuppuswamy B: Manual of socio-economic status scale. Mana-sayan Publication, Delhi; 1962.
32. Joliffe IT, Morgan BJ: Principal components analysis and explor-atory factor analysis: Review. Stat Methods Med Res 1992,
1:69-95.
33. Joshi NP, Kulkarni SR, Yajnik CS, Joglekar CV, Rao S, Coyaji KJ, Lubree HG, Rege SS, Fall CH: Increasing maternal parity pre-dicts neonatal adiposity: Pune Maternal Nutrition Study. Am J Obstet Gynecol 2005, 193:783-789.
34. Guihard-Costa AM, Papiernik E, Kolb S: Maternal predictors of subcutaneous fat in the term newborn. Acta Paediatr 2004,
93:346-349.
35. Metzger BE, Lowe LP, Dyer AR, Trimble ER, Chaovarindr U, Coustan DR, Hadden DR, McCance DR, Hod M, McIntyre HD, Oats JJ, Pers-son B, Rogers MS, Sacks DA, HAPO Study Cooperative Research Group: Hyperglycemia and adverse pregnancy outcomes. N Engl J Med 2008, 358:1991-2002.
36. Veena SR, Kumaran K, Swarnagowri MN, Jayakumar MN, Leary SD, Stein CE, Cox VA, Fall CHD: Intergenerational effects on size at birth in South India. Paediatric and Perinatal Epidemiology 2004,
18:361-370.
popula-Publish with BioMed Central and every scientist can read your work free of charge "BioMed Central will be the most significant development for disseminating the results of biomedical researc h in our lifetime."
Sir Paul Nurse, Cancer Research UK
Your research papers will be:
available free of charge to the entire biomedical community
peer reviewed and published immediately upon acceptance
cited in PubMed and archived on PubMed Central
yours — you keep the copyright
Submit your manuscript here:
http://www.biomedcentral.com/info/publishing_adv.asp
BioMedcentral
tion-based parent-offspring data. Am J Epidemiol 2007,
165:734-741.
38. Barker DJP, Godfrey KM, Osmond C, Bull A: The relation of fetal length, ponderal index and head circumference to blood pressure and the risk of hypertension in adult life. Paediatric and Perinatal Epidemiology 1992, 6:35-44.
39. Kumaran K, Fall CHD, Martyn CN, Vijayakumar M, Stein CE, Shier R:
Blood pressure, arterial compliance and left ventricular mass; no relation to small size at birth in South Indian adults. Heart 2000, 83:272-277.
40. Barker DJ, Osmond C, Thornburg KL, Kajantie E, Forsen TJ, Erikkson JG: A possible link between the pubertal growth of girls and breast cancer in their daughters. Am J Hum Biol 2008,
20:127-131.
41. Barker DJ, Osmond C, Forsen TJ, Kajantie E, Erikkson JG: Maternal and Social Origins of Hypertension. Hypertension 2007,
50:565-571.
42. Frisancho AR, Klayman JE, Maros J: Influence of maternal nutri-tional status on prenatal growth in a Peruvian urban popula-tion. Am J Phys Anthropol 1977, 46:265-274.
43. Li L, Dangour AD, Power C: Early life in fluences on adult l eg and trunk length in the 1958 British birth cohort. Am J Hum Biol
2007, 19:836-843.
44. Gunnell DJ, Davey Smith G, Frankel S, Nanchahal K, Braddon FE, Pemberton J, Peters TJ: Childhood leg length and adult mortal-ity: follow up of the Carnegie (Boyd Orr) Survey of Diet and Health in Pre-war Britain. J Epidemiol Community Health 1998,
52:142-152.
45. Inskip HM, Godfrey KM, Robinson SM, Law CM, Barker DJ, Cooper C, SWS Study Group: Cohort Profile: The Southampton Women's Survey. Int J Epidemiol 2006, 35:42-48.
46. Mathai M, Thomas S, Peedicayil A, Regi A, Joseph P, Joseph R:
Growth pattern of Indian fetus. Int J Gynecol Obstet 1995,
48:21-24.
47. Bavdekar A, Yajnik CS, Fall CH, Bapat S, Pandit AN, Deshpande V, Bhave S, Kellingray SD, Joglekar C: Insulin resistance syndrome in 8-year-old Indian children: small at birth, big at 8 years, or both? Diabetes 1999, 48:2422-2429.
48. Victora CG, Adair L, Fall C, Hallal PC, Martorell R, Richter L, Sachdev HS, Maternal and Child Undernutrition Study Group: Maternal and child undernutrition: consequences for adult health and human capital. Lancet 2008, 371:340-357.
Pre-publication history
The pre-publication history for this paper can be accessed here: