Microbiome Helper: a Custom and
Streamlined Workflow for Microbiome
Research
André M. Comeau, Gavin M. Douglas, Morgan G. I. Langille
CGEB-Integrated Microbiome Resource (IMR) and Department of Pharmacology, Dalhousie University, Halifax, Canada
ABSTRACT
Sequence-based approaches to study microbiomes, such as 16S rRNA
gene sequencing and metagenomics, are uncovering associations between microbial
taxa and a myriad of factors. A drawback of these approaches is that the necessary
sequencing library preparation and bioinformatic analyses are complicated and
con-tinuously changing, which can be a barrier for researchers new to the field. We
pres-ent three esspres-ential componpres-ents to conducting a microbiome experimpres-ent from start
to finish: first, a simplified and step-by-step custom gene sequencing protocol that
requires limited lab equipment, is cost-effective, and has been thoroughly tested
and utilized on various sample types; second, a series of scripts to integrate various
commonly used bioinformatic tools that is available as a standalone installation or
as a single downloadable virtual image; and third, a set of bioinformatic workflows
and tutorials to provide step-by-step guidance and education for those new to the
microbiome field. This resource will provide the foundations for those newly
enter-ing the microbiome field and will provide much-needed guidance and best practices
to ensure that quality microbiome research is undertaken. All protocols, scripts,
workflows, tutorials, and virtual images are freely available through the Microbiome
Helper website (
https://github.com/mlangill/microbiome_helper/wiki
).
IMPORTANCE
As the microbiome field continues to grow, a multitude of
research-ers are learning how to conduct proper microbiome experiments. We outline here a
streamlined and custom approach to processing samples from detailed sequencing
library construction to step-by-step bioinformatic standard operating procedures.
This allows for rapid and reliable microbiome analysis, allowing researchers to
fo-cus more on their experiment design and results. Our sequencing protocols,
bioinformatic tutorials, and bundled software are freely available through
Micro-biome Helper. As the microMicro-biome research field continues to evolve, MicroMicro-biome
Helper will be updated with new protocols, scripts, and training materials.
KEYWORDS
16S rRNA gene sequencing, Microbiome Helper, bioinformatics,
dual-indexing PCR, education, metagenomics, microbiome, standard operating
procedure, virtual machine
R
esearch has associated the human microbiome with lifestyle changes (1), severity
of disease (2–4), treatment outcomes (5, 6), and the built environment (7).
Mean-while, the microbiomes from oceans (8) to atmospheres (9) have provided key insights
into the influence and response of particular microbes to various complex
environ-ments.
Methods for profiling microbiome samples have changed from presequencing
techniques, such as denaturing gradient gel electrophoresis and terminal restriction
fragment length polymorphisms, to newer sequenced-based approaches, including
amplicon rRNA gene sequencing, metagenomics, and metatranscriptomics. These
se-Received13 September 2016Accepted8
December 2016 Published3 January 2017
CitationComeau AM, Douglas GM, Langille MGI. 2017. Microbiome Helper: a custom and streamlined workflow for microbiome research.
mSystems 2:e00127-16.https://doi.org/
10.1128/mSystems.00127-16.
EditorJonathan Eisen, UC Davis Genome Center
Copyright© 2017 Comeau et al. This is an open-access article distributed under the terms
of theCreative Commons Attribution 4.0
International license.
Address correspondence to Morgan G. I. Langille, [email protected].
Microbiome Helper: A guide to microbiome experiments including sample prep, sequencing, bioinformatics, and visualization.
Novel Systems Biology Techniques
crossm
on September 8, 2020 by guest
http://msystems.asm.org/
quencing approaches remain challenging and complex for both library preparation and
bioinformatic analysis, especially for those researchers just entering the microbiome
research field. Currently, Illumina sequencing is the most prevalent next-generation
sequencing (NGS) technology for microbiome sequencing, and several studies have
outlined different methods and strategies for processing samples (10–12). Multiplexing
(“barcoding”) of samples was initially conducted using a single-indexing strategy (10)
and then later replaced by a dual-indexing strategy (11) that leverages barcodes on
both the forward and reverse paired ends (PE). At one point, Illumina sequencing had
difficulties with low-sequence-complexity libraries like those resulting from 16S rRNA gene
profiling, and a large proportion of phiX control DNA was spiked in to improve sequencing
quality. An alternative approach that used heterogeneity spacers within the barcode
provided an improvement to low sequence diversity (12) but required custom barcodes
and more-complicated demultiplexing during bioinformatic analysis. Illumina has since
improved its sequencing image base-calling to require less phiX, even with very low
sequence diversity libraries, opening the door for a simplified dual-indexing strategy.
On the bioinformatics front, there have been tremendous efforts to develop systems
to process and analyze microbiome data, including QIIME (13) and mothur (14),
primarily for 16S rRNA data, while metagenomic data analysis is still often pieced
together using various individual bioinformatic methods (15). Microbiome analysis is
ever-changing, and currently, users require training on the myriad of options within
and between various bioinformatic tools. Some bioinformatic developers have made
efforts to publish tutorials (13) and standard operating procedures (SOPs) (11) to help
guide researchers into best practices, but these are often limited to a single tool or
platform and usually do not include complete end-to-end guidelines.
Here, we provide an open, user-friendly, and streamlined SOP for both microbiome
sequencing and bioinformatic analysis. Our approach has been tested, debugged, and
refined on over 17,000 samples processed through Dalhousie University’s Integrated
Microbiome Resource (IMR;
http://cgeb-imr.ca
) and is continually updated with the
most recent modifications. Bioinformatic resources including SOPs, custom scripts to
allow easier data interoperability and parallelization, comprehensive tutorials, and a
VirtualBox image are accessible through Microbiome Helper.
RESULTS AND DISCUSSION
IMR run performance.
Amplicon samples in our presented protocol are run on the
Illumina MiSeq using 2
⫻
300 bp PE v3 chemistry which allows for overlap and stitching
together of paired amplicon reads into one full-length read of higher quality (see below
for further quality discussion). As of December 2016 at the IMR, we have processed over
17,000 samples using this workflow, and we present an overview of the results of our
first 25 runs in Table 1. The step-by-step detailed lab protocol is included as
supple-mental methods in Text S1 in the supplesupple-mental material, and a general overview of the
workflow is presented in Fig. 1. As presented further below for the bioinformatics
approaches, the open lab protocol will be continuously revised/refined as new
molec-ular approaches are introduced by the community, or novel products arrive in the
marketplace, and we have had the opportunity to validate them.
We consistently aim for the Illumina-recommended 20 pM library loading with an
accompanying 5% phiX, which is now the minimal amount to maintain high-quality
base-calling for low-diversity (amplicon) libraries (16). Average cluster densities of
~900,000/mm
2produced final outputs of ~21 million pass-filter reads (~13-Gb raw
data) at a Q30 (bases with a quality score of at least 30) of 71%. These values equate
to ~55,000 raw reads per sample for a typical complete run of 380 samples. Note that
achieved cluster densities and final outputs are slightly below Illumina’s “best-case
scenario” specifications, but this is to be expected as the latter is for a complex phiX
genomic library, whereas the former amplicon libraries typically pose a challenge for
NGS systems and can easily overcluster (saturate), leading to reduced Q30 and
pass-filter read numbers.
on September 8, 2020 by guest
http://msystems.asm.org/
For diagnostic purposes, and to show an example of sample performance, the
commonly used bacterial Mock Community “B” developed for the HMP project (BEI
Resources) was processed using our protocol, employing two separate sets of primers
for the V4-V5 and V6-to-V8 regions of the 16S rRNA gene (Fig. 2), in triplicate on three
TABLE 1 Run metrics for the first 25 amplicon runs (9,145 total samples) at the IMR and comparison to Illumina’s MiSeq maximum output specifications (for phiX)
Runa
No. of samples
Cluster density
(1,000/mm2) Pass filter % % phiX %>Q30 % error Bases (Gb)
Raw reads (million)
Pass filter (million)
IMR1 95 1,019 89 4.9 70 2.8 14.1 25.9 23.0
IMR2 384 938 91 3.9 78 2.7 13.3 23.9 21.7
IMR3 382 1,026 89 5.5 77 2.6 14.1 25.9 23.0
IMR4 376 865 90 6.7 76 2.7 12.1 21.8 19.6
IMR7 372 1,030 88 5.5 67 2.7 14.1 26.1 22.9
IMR15 376 585 93 3.9 63 3.7 8.8 15.4 14.3
IMR16 387 840 91 4.4 75 2.9 11.9 21.4 19.5
IMR17 380 949 90 4.3 64 3.4 13.3 24.1 21.6
IMR19 380 730 91 5.7 74 2.9 10.2 18.3 16.7
IMR20 377 893 90 4.3 65 3.8 12.4 22.4 20.1
IMR21 380 914 91 3.6 70 3.9 12.8 22.9 20.9
IMR22 380 926 94 4.3 69 3.0 13.6 23.5 22.2
IMR23 380 837 91 5.6 70 2.8 11.8 21.1 19.3
IMR24 380 732 92 3.7 64 2.9 10.7 18.9 17.5
IMR25 380 989 89 5.2 70 2.4 13.7 25.1 22.3
IMR26 379 938 95 6.4 69 2.4 14.0 24.0 22.8
IMR27 376 1,013 86 5.6 57 2.4 13.1 24.8 21.3
IMR28 363 845 92 7.5 81 2.1 11.9 21.1 19.4
IMR29 360 893 90 14.7b 81 2.6 12.1 22.0 19.8
IMR30 380 960 88 5.6 74 2.2 13.0 24.1 21.2
IMR31 377 845 91 5.5 76 2.2 11.9 21.5 19.4
IMR32 373 805 91 4.8 80 2.1 11.2 20.2 18.3
IMR34 380 905 93 4.9 69 2.3 13.2 23.3 21.6
IMR35 380 1,112 90 3.9 72 2.3 15.5 28.0 25.3
IMR36 368 982 88 2.4 62 2.8 13.0 23.9 21.1
Mean NAc 903 91 4.9 71 2.7 12.6 22.8 20.6
Illumina NA 1,200–1,400 NA NA ⬎70 NA 13.2–15.0 NA 22–25
aNumbering is not consecutive as other (metagenomics) runs were completed in between amplicon runs. bExtra phiX was added to this run for diagnostic reasons and does not factor into the below mean. cNA, not applicable.
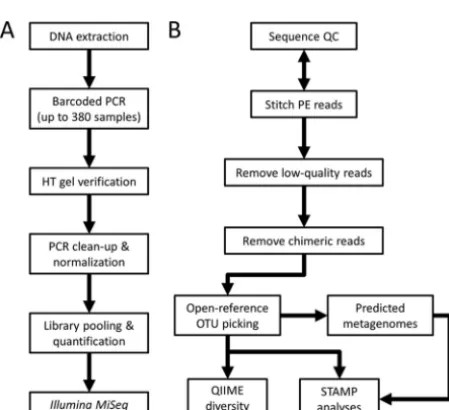
FIG 1 Workflow diagram of on-bench and bioinformatic custom pipelines. Only major steps for both the
sequencing protocol (A) and bioinformatics protocol (B) are illustrated. HT, high-throughput; PE, paired-end; QC, quality control.
on September 8, 2020 by guest
http://msystems.asm.org/
independent sequencing runs. The sample contains equal amounts of rRNA gene
copies of 20 bacterial species, one for each of the genera listed in the figure, except for
Staphylococcus
and
Streptococcus
, which have 2 and 3 species each, respectively. We
include here the results from two different 16S variable regions as a reminder to the
uninitiated that not all variable regions (within 16S, 18S, or internal transcribed spacer
[ITS]) are created equal— different results will be obtained from the same starting
material depending on your choice of target and specific primer pairs used. Due to
these differences, it is also difficult to compare independent studies that have used
different variable regions and thus this will also guide researchers to their choice of
region/primers if they wish to compare their results to previous work in their field (or
wish to study specific taxa that have severe biases with certain primer pairs). Various
in
silico
and
in vitro
examinations of region differences (see references 17, 18, and 19 for
examples) have highlighted that two prime reasons exist for these differences: (i)
primer amplification efficiency in PCR, due to binding strengths directly at the site of
annealing or downstream secondary structure effects on polymerase extension, can
cause misrepresentations of different sequences (species/strains) in the final fragment
pool (i.e., some amplify more easily or poorly than average) and (ii) not all taxonomic
groups have the same degree of resolution in each of the regions, meaning that, even
if amplification is successful, downstream clustering into operational taxonomic units
(OTUs) (at a set identity level for all, such as 97%) and identification will be hampered
in some groups. In our present example, the V4-V5 region overrepresents
Firmicutes
and
Bacteroides
while severely underestimating
Actinobacteria
;
Propionibacterium
nearly disappears with 7 to 10 reads versus 750 expected. Conversely, the V6-to-V8
region shows more accurate proportions of
Actinobacteria
and
Firmicutes
but
overes-timates
Proteobacteria
while at the same time having difficulty with
Bacteroides
and
Helicobacter
(the latter being at ~10% of the expected value). Both regions
overesti-mate species richness: ~2- to 3-fold-more 97% identity OTUs were found for the 20
FIG 2 Example of amplicon performance in our presented workflow. The bacterial HMP Mock Community “B” sample (BEI Resources) was processed using 16S
V4-V5 (515F⫹926R [28]) and V6-V8 (B969F⫹BA1406R [27]) primer sets through our on-bench and bioinformatics workflow. Three replicates for each region were sequenced on three independent MiSeq runs and then normalized to 15,000 reads each during analysis. The mock sample contains equal amounts of rRNA gene copies of 20 species, one for each of the genera listed in the legend, except two species ofStaphylococcusand three species ofStreptococcus. Note that the individual variable regions have difficulty separatingEscherichiafromShigellaand that they are listed with interchangeable identities here. The output numbers (always 37 or 54) and identities of the OTUs were consistent between each replicate of a given variable region.
on September 8, 2020 by guest
http://msystems.asm.org/
species present in the mock community. However, these details are not unexpected,
and our intent is not to present an in-depth comparative analysis of variable regions or
richness estimates, as these topics have been covered in multiple previous studies, as
mentioned above. More importantly, the results show that reproducibility is high with
very consistent replicates within each variable region. Sequence proportions show very
low coefficients of variation (10.9% for V4-V5 and 6.4% for V6 to V8), and the exact same
OTUs are found each time, indicating a robust library preparation and sequencing
protocol that we can recommend for general use. Users can select the variable region
of their choice for use in our protocol, and we will be updating our default choices
within Microbiome Helper as the state of the art in region choice and primer sequences
evolves within the community.
Pipeline computational and sequence quality performance.
As an example of
our bioinformatics pipeline, we reanalyzed 16S rRNA gene V6-to-V8 sequencing data
extracted from 116 mouse fecal samples (part of IMR7 in Table 1). This data set was
generated to compare the microbiomes of chemerin-knockout strains compared to
wild-type strains and serves as our example tutorial data on the Microbiome Helper
wiki. For each major step, we computed the time required to run the process on 1
central processing unit (CPU) (estimated by the sum of the “user” and “sys” times
outputted by the “time” command), the number of PE reads remaining, and the
number of OTUs (Table 2). The entire pipeline was threaded over 30 CPUs where
possible and ran in 61 h of CPU time, which translated to 5.5 h in real time.
Open-reference OTU picking was the lengthiest step (38 h of CPU time), followed by chimera
removal (17 h of CPU time).
The vast majority (98.6%) of read pairs were successfully stitched, and this was
consistent across all samples (range of 98.0 to 98.9%). After read filtering based on
quality and length, as well as chimera removal, 56.1% of reads were still retained. We
used default filtering options for both steps (see Materials and Methods). The
percent-age of reads discarded by both the quality/length filtering and chimera removal steps
was variable across samples—ranging from 33.0 to 45.6% and from 4.3 to 19.3%,
respectively. Our preference is to be stringent on read quality to avoid generation of
spurious OTUs downstream; however, quality and length filtering can be changed easily
by the user depending on amplicon length or tolerance of lower-quality reads.
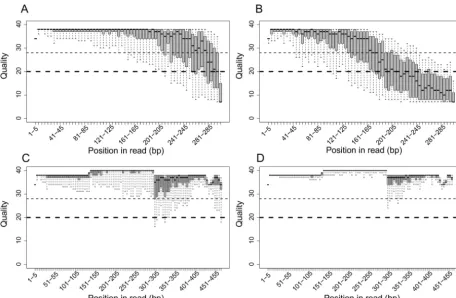
Fully overlapping read pairs have previously been recommended for 16S rRNA
analyses, since the increase in sequencing errors in nonoverlapping regions can result
in spurious OTU calls (11). Related to this suggestion, there has also been some concern
about the base-quality performance of Illumina’s v3 kit chemistry toward the ends of
the 300-nucleotide (nt) reads (20). These are valid concerns, and we have tweaked our
quality-filtering steps to help minimize these problems. The distribution of quality
scores in forward and reverse reads is shown in Fig. 3A and B to help visualize this issue.
For both forward and reverse reads, there is a decrease in quality near the 3
=
ends. After
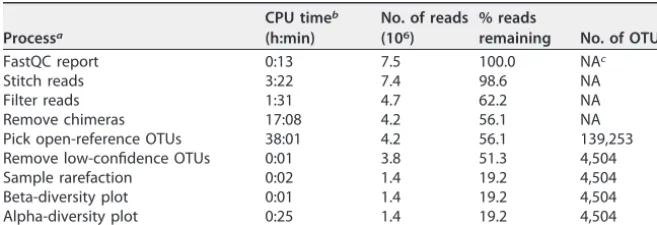
TABLE 2 Run times and data metrics of a 16S Microbiome Helper runProcessa
CPU timeb (h:min)
No. of reads (106)
% reads
remaining No. of OTUs
FastQC report 0:13 7.5 100.0 NAc
Stitch reads 3:22 7.4 98.6 NA
Filter reads 1:31 4.7 62.2 NA
Remove chimeras 17:08 4.2 56.1 NA
Pick open-reference OTUs 38:01 4.2 56.1 139,253 Remove low-confidence OTUs 0:01 3.8 51.3 4,504 Sample rarefaction 0:02 1.4 19.2 4,504 Beta-diversity plot 0:01 1.4 19.2 4,504 Alpha-diversity plot 0:25 1.4 19.2 4,504
aThe commands used are described here at
https://github.com/mlangill/microbiome_helper/wiki/16S-standard-operating-procedure.
bThese are the run times for one 2.3-GHz CPU (the time was 5.5 h in real time on 30 of the same CPUs). cNA, not applicable.
on September 8, 2020 by guest
http://msystems.asm.org/
stitching these 300-nt reads together (Fig. 3C), there is a clear increase in quality in the
overlapping region (from ~150 to 300 bp). Notably, there is a large degree of variation
in quality, especially toward the end of the reads. After quality filtering, there is much
less variation (Fig. 3D). Despite this improvement in quality score distributions, spurious
OTU calls still occur, as shown by the massive number of raw OTUs originally called
(139,253). After eliminating OTUs that are called by
⬍
0.1% of reads (our “remove
low-confidence OTUs” step), which is the maximal expected bleed-through between
MiSeq runs according to Illumina (21), we retained 4,504 OTUs. This 97% removal of
(most probably) spurious OTUs demonstrates, along with the mock community results
in Fig. 2, that reasonable OTU estimates can be achieved by using proper quality
control.
Application of workflows and tutorials.
Microbiome Helper provides suggested
workflows or SOPs for 16S, 18S, ITS2, and metagenomic analysis, from raw data through
visualization and statistics. These SOPs provide step-by-step explanations of every Unix
command along with details about what the command is doing and what options the
users may want to change when using their own data set. As in many research fields,
there is not often a clear single “right way” to process microbiome data, and so when
possible, we attempt to document alternative approaches. For example, in addition to
the open-reference OTU clustering process, we provide several emerging alternatives
that attempt to model Illumina sequencing error to allow for greater resolution beyond
97% OTUs (22–24). In addition to SOPs, tutorials with premade data sets and example
outputs are provided for 16S analysis, metagenomic taxonomy, metagenomic function,
PICRUSt inference, and visualization and statistical analysis with STAMP. Methods that
attempt to predict phenotypic information from OTU tables such as BugBase (25) and
FAPROTAX (26) are also included in the Microbiome Helper wiki and virtual image.
These tutorials are not just lists of “copy-and-paste” commands but rather aim to
FIG 3 Box plots of quality scores over positions in sequenced reads. Quality distributions are shown for forward reads (A), reverse reads (B), raw
stitched reads (C), and filtered stitched reads (D) from a single MiSeq run. These plots are adapted from the FastQC output: the thick and thin dashed lines indicate quality scores of 20 and 28, respectively (to match the default FastQC output).
on September 8, 2020 by guest
http://msystems.asm.org/
educate the researcher by explaining what is actually being conducted and also contain
questions at various steps (with answers provided on separate pages). All workflows
and tutorials are easily run within the Microbiome Helper virtual image, which
com-bines all necessary bioinformatic packages and avoids complicated and timely
instal-lation. The bioinformatic SOPs have been rigorously tested both in-house and with
several collaborators on thousands of 16S and 18S rRNA samples and hundreds of
metagenomic samples. The tutorials and virtual image have been deployed at four
different workshops and have been used by hundreds of trainees at various experience
levels in the microbiome field. All scripts, workflows, and tutorials are freely available
and continually updated in response to changing methods and approaches. We
encourage other educators to incorporate these tutorials into their training
environ-ments and would gratefully include tutorials from others into Microbiome Helper.
Conclusion.
As the microbiome field continues to rapidly expand, there is a great
demand for clear, concise, and well-tested protocols for both sequencing and
bio-informatic analysis. It is unlikely that the entire field will agree to the exact same
workflows, due to differences in scientific interests and difference of opinions on
optimal methods. Here, we have presented a set of protocols, workflows, and tutorials
that has been shown to produce reliable and consistent results across a variety of
samples and has been already successfully deployed as a training resource. Microbiome
Helper is freely and openly available and will continue to evolve as the field grows.
MATERIALS AND METHODS
Amplicon library preparation and sequencing.The following subsections summarize the
gener-ation of PE sequencing reads of 16S or 18S rRNA gene PCR amplicons with multiple barcodes (indices) on the Illumina MiSeq machine of a length of approximately 400 to 500 bp. It assumes an input of up to 384 slots (380 samples plus 4 PCR-negative controls) conducted in four 96-well plates and can be done manually or using liquid-handling robotics. These bench protocols are a synthesis of multiple sources in the scientific literature as to the current “best practices” but draw heavily upon the work of Comeau et al. (27) for initial primer design and PCR setup. Here, we present the examples of 16S V6-to-V8 (bacteria and archaea) and 18S V4 (eukarya) amplicons, but the protocols can be easily modified for use with any correctly sized amplicon(s) of your choice—such as other rRNA gene variable regions or any functional genes of interest (such aspsbA, cox1, etc.). At the IMR, we have successfully tested and deployed additional amplicons for 16S V4-V5 (28), fungal ITS1 and ITS2 (28, 29), nitrogen cyclenifH(J. Laroche, unpublished data), and BarSeq mutant analysis (30).
(i) Custom Illumina primers.A dual-indexing, one-step PCR is done using complete “fusion primers”
that include Illumina Nextera adaptors plus indices plus specific regions targeting either the 16S or 18S rRNA genes (Fig. 4). We utilize all of the Nextera v2 set A to D indices: 16 forward⫻24 reverse indices means that, with only 40 different fusion primers, all 384 combinations can be achieved (see Text S1 in the supplemental material for the layout of the indices). A spreadsheet template is provided in Table S1 with the sequences of the fusion constructs currently employed at the IMR and the capacity to plug in any specific primers, targeting genes/regions of your choice, to create your own primers compatible with this protocol and Illumina’s sequencing technology. The one-step approach is in contrast to a two-step protocol whereby a first PCR is conducted using specific primers, followed by a second “indexing” PCR using a separate indexing kit/set of primers that fuses adaptors plus (single or dual) barcodes to the sample amplicons. Although still an option for those who wish to decouple specific primers from barcodes, we prefer the one-step approach as there are multiple advantages: (i) simpler logistics, having one primer combination per sample well from beginning to end, mitigating chances for error; (ii) reduced chances of chimeric PCR product formation and compounded amplification biases by
FIG 4 Diagram of fusion primers and dual-indexing approach for library construction. Illumina Nextera left (P5) and
right (P7) adaptors contain the i5 (S5xx series) and i7 (N7xx series) indices in their respective middle sections, respectively. All nucleotide sizes within fusion primers are the same for different target amplicons, with the exception of the target-specific primer regions (F⫹R) which here demonstrate the sizes of the 16S rRNA gene V6-V8 primers (B969F⫹BA1406R [27]) employed in the presented protocol.
on September 8, 2020 by guest
http://msystems.asm.org/
avoiding second-round PCR; and (iii) reduced costs by avoiding extra verification plus cleanup steps and requiring less of the PCR reagents per sample.
(ii) PCR, cleanup, and normalization.16S or 18S rRNA gene fragments are PCR amplified from the
DNA in duplicate using separate template dilutions (generally 1:1 and 1:10) using a high-fidelity polymerase (critical to reduce spurious diversity in amplicons). For the generation of 18S amplicons from microbiome samples containing substantial nontarget host DNA (e.g., human, mouse, etc.), we employ modified Earth Microbiome Project recommendations for using a mammalian blocking primer—note that their protocol employs a V9 blocking primer since their amplicons are generated for the V9 region but that our protocol uses the longer V4 region for amplicons, and hence, we use a V4 blocking primer to match (see reference 31 and also Text S1 in the supplemental material). Four negative PCR controls are included on every run (1 per 96-well plate), and occasionally when significant changes are made to the protocol, a positive control is also included. As shown in the results above, we originally used the HMP Mock Community “B” (evenly distributed composition, catalog no. HM-782D) supplied freely to noncommercial researchers from BEI Resources as a positive control, but the product has since been discontinued. However, there are now commercial alternatives available, such as the ZymoBIOMICS standards from Zymo Research (Irvine, CA). The duplicate PCRs are combined in one plate and then verified visually by running a high-throughput Invitrogen 96-well E-gel. Any samples with failed PCRs (or spurious bands) are reamplified by optimizing PCR conditions to produce correct bands in order to complete the sample plate(s) before continuing. Amplicons are then cleaned up and normalized in one step using the high-throughput Invitrogen SequalPrep 96-well plate kit. The (up to) 380 samples plus 4 negative controls are finally pooled to make one library which is then quantified using the Invitrogen Qubit double-stranded DNA high-sensitivity (dsDNA HS) fluorescence-based method before sequencing.
(iii) On-machine custom run setup.As neither the Illumina MiSeq Control Software (MCS) nor
Experiment Manager (iEM) software typically accepts/expects libraries over 96 index combinations, some minor manual “hacking” of the sample sheets is required for our custom application to be loaded correctly. The supplemental materials and methods in Text S1 contain detailed instructions for preparing these sample sheets. It is currently only a lack of support from Illumina on the run-prep software side that leads to this work-around; the v3 kit chemistry fully supports physically sequencing these libraries, and Illumina’s cloud-based BaseSpace application also properly handles postrun delivery and analysis of these samples.
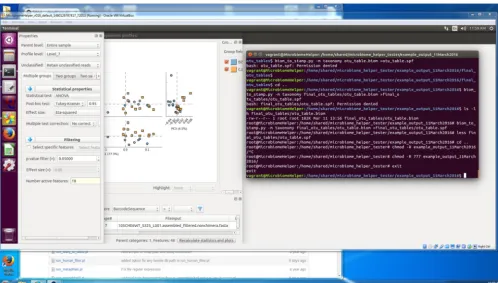
Bioinformatics pipeline.We have produced a straightforward and detailed pipeline called
Micro-biome Helper that utilizes many publicly available tools to perform the major steps of 16S rRNA analysis (see the workflow in Fig. 1). Where necessary, we have written wrapper scripts to allow multiple samples to be run simultaneously and to seamlessly integrate multiple tools by correcting for file format differences. These scripts are written typically in either Perl or Python and are available at the Microbiome Helper website. In addition, these tools have been bundled in an Ubuntu 16.04 VirtualBox image which will allow the steps described below to be performed on a 64-bit personal computer (Windows/Mac OS X/Linux) with little or no configuration (see screenshot in Fig. 5) and only modest specifications (e.g., 8 GB random-access memory [RAM], 2 cores, etc.).
(i) Preprocessing.FastQC (v0.11.5 [32]) is used to evaluate the quality of raw PE reads, which is useful
for identifying problematic sequencing runs and/or samples. Next, stitching of unambiguous read pairs together is done using PEAR (v0.9.10 [33]). To confirm that read stitching has been performed correctly, we again run FastQC on the stitched reads. Examining the quality and size distributions of the stitched reads enables sensible cutoffs to be chosen for the read-filtering step. Based on these cutoffs, FASTX-Toolkit (v0.0.14 [34]) is used to filter out reads that have more than a specified proportion of low-quality sites, with the default in our SOP being a quality score of 30 over at least 90% of the bases. We then filter out reads shorter than a specified length (⬍400 bp by default) and reads that do not exactly match the known primer sequences at the 5=and 3=ends using BBMap (v35.85 [35]). These quality thresholds can be set by the user since optimal settings will differ for each data set. Following read filtering, we screen out potentially chimeric reads using VSEARCH (v1.11.1 [36]), which implements the UCHIME algorithm (37). By default, we use the options mindiv⫽1.5 and minh⫽0.2 for chimera checking. Where necessary, scripts have been written to execute these steps over multiple samples at once to leverage parallel computing and to avoid repetitive commands.
(ii) OTU picking, spurious data removal, and taxonomic assignment.We use QIIME wrapper
scripts (v1.91 [13]) to classify reads into different operational taxonomic units (OTUs; at 97% identity for 16S and 98% for 18S), which is called OTU picking. Specifically, we run open-reference OTU picking, which means that reads are first clustered against reference sequences and then any remaining reads are clustered against themselves (de novo) (38). To avoid memory limitations as a result of closed-source 32-bit clustering methods, we opted for inclusion of open-source methods SortMeRNA (v2.0-dev time stamped 29/11/2014 [39]) and SUMACLUST (v1.0.00 [40]) for the reference-based andde novoclustering steps, respectively. Running both of these steps is important, since using reference-based methods alone can lead to biases in OTU picking (41). To remove spurious OTUs that are a result of unfiltered chimeras or “bleed-through” between sequencing runs, a dynamic cutoff (as opposed to removing just singletons) is employed to filter out OTUs having⬍0.1% of the total number of sequences. The OTU table is then normalized per sample by subsampling (or rarefying) to a minimal number of reads, but we also provide specific details on how DESeq2 (42) can alternatively be used to statistically normalize the table without the loss of data (43).
(iii) Additional analyses and visualization.After the final OTU table is created, Microbiome Helper
provides numerous options for analysis. This includes details on how to use QIIME to calculate alpha- and
on September 8, 2020 by guest
http://msystems.asm.org/
beta-diversities, to run principal-coordinate analysis on UniFrac distances (44), and to test for statistical differences between groups (13). Scripts are provided to convert BIOM-formatted OTU tables to other formats such as STAMP (v2.1.3 [45]), which is used to identify particular taxa that significantly differ in abundance between groups, as well as for several visualizations. Detailed steps on the use of PICRUSt (v1.1.0 [46]) are provided to infer the functional content of samples in terms of KEGG orthologs and pathways and to associate taxonomic changes with functional differences.
Scripts are also provided for metagenomic bioinformatic analysis, including wrapper scripts for MetaPhlAn2 (47), HUMAnN (48), and Kraken (49), and integration of these tools with STAMP.
(iv) Workflows and tutorials.Standard operating procedures or workflows are provided for both 16S
rRNA and metagenomic bioinformatic analysis within the Microbiome Helper wiki. These provide step-by-step guides for each command to be run with a brief explanation of its purpose and what options may need to be changed depending on the specific data set. In addition, several tutorials from previous workshops, including the Canadian Bioinformatics Workshop in Analysis of Metagenomic Data (hosted by bioinformat-ics.ca), Strategies and Techniques for Analyzing Microbial Population Structures (hosted by the Marine Biological Laboratory), Metagenomics Workshop (hosted by the Great Lakes Bioinformatics conference), and Metagenomics Bioinformatics (hosted by the European Bioinformatics Institute), are available on the Micro-biome Helper wiki. These tutorials include practice data sets, detailed descriptions of each command, explanations of output, examples of visualizations, and questions to prompt interactive learning. These tutorials can all be completed using the Microbiome Helper VirtualBox image.
Ethics approval and consent to participate.All protocols were conducted in accordance with the
Canadian Council on Animal Care guidelines and approved by the Dalhousie University Committee on Laboratory Animals.
Availability of data and material.The data sets and scripts supporting the conclusions of this article
are available in the Microbiome Helper repository (https://github.com/mlangill/microbiome_helper/wiki).
SUPPLEMENTAL MATERIAL
Supplemental material for this article may be found at
https://doi.org/10.1128/
mSystems.00127-16
.
TEXT S1,
PDF file, 1.8 MB.
TABLE S1,
XLSX file, 0.04 MB.
ACKNOWLEDGMENTS
We thank Christopher Sinal for allowing the use of his 16S data from his chemerin
mouse study. In addition, we thank all users of Microbiome Helper who provided
feedback and helpful suggestions.
FIG 5 Screenshot of the Microbiome Helper virtual image. The screenshot illustrates the Ubuntu-based Microbiome Helper virtual image running within a
Windows 7 operating system with both a terminal window for command-line access and the graphically based STAMP visualization and statistics tool.
on September 8, 2020 by guest
http://msystems.asm.org/
This research was funded through the Dalhousie University Strategic Research
Initiatives Fund. The funders had no role in the design, analysis, and interpretation of
the study or writing of the manuscript.
We run the IMR, a nonprofit academic microbiome sequencing and bioinformatic
service, which uses the protocols outlined in this document. We do not benefit from
making these protocols openly available.
A.M.C. and M.G.I.L. developed the on-bench protocols; A.M.C. ran the mock
com-munity analysis and all sequencing library preps/runs. A.M.C., G.M.D., and M.G.I.L.
developed the bioinformatics pipeline; G.M.D. and M.G.I.L. wrote the scripts; G.M.D.
prepared the VirtualBox image and analyzed the tutorial data. All authors wrote the
manuscript.
REFERENCES
1. David LA, Materna AC, Friedman J, Campos-Baptista MI, Blackburn MC, Perrotta A, Erdman SE, Alm EJ. 2014. Host lifestyle affects human micro-biota on daily timescales. Genome Biol 15:R89.https://doi.org/10.1186/ gb-2014-15-7-r89.
2. Kong HH, Oh J, Deming C, Conlan S, Grice EA, Beatson MA, Nomicos E, Polley EC, Komarow HD, Murray PR, Turner ML, Segre JA. 2012. Temporal shifts in the skin microbiome associated with disease flares and treat-ment in children with atopic dermatitis. Genome Res 22:850 – 859.
https://doi.org/10.1101/gr.131029.111.
3. Wang Z, Bafadhel M, Haldar K, Spivak A, Mayhew D, Miller BE, Tal-Singer R, Johnston SL, Ramsheh MY, Barer MR, Brightling CE, Brown JR. 2016. Lung microbiome dynamics in COPD exacerbations. Eur Respir J 47: 1082–1092.https://doi.org/10.1183/13993003.01406-2015.
4. Sartor RB, Mazmanian SK. 2012. Intestinal microbes in inflammatory bowel diseases. Am J Gastroenterol Suppl 1:15–21. https://doi.org/ 10.1038/ajgsup.2012.4.
5. Plotnikoff GA. 2014. Three measurable and modifiable enteric microbial biotransformations relevant to cancer prevention and treatment. Glob Adv Health Med 3:33– 43.https://doi.org/10.7453/gahmj.2014.021. 6. Brown J, de Vos WM, DiStefano PS, Doré J, Huttenhower C, Knight R,
Lawley TD, Raes J, Turnbaugh P. 2013. Translating the human micro-biome. Nat Biotechnol 31:304 –308.https://doi.org/10.1038/nbt.2543. 7. Kembel SW, Jones E, Kline J, Northcutt D, Stenson J, Womack AM,
Bohannan BJ, Brown GZ, Green JL. 2012. Architectural design influences the diversity and structure of the built environment microbiome. ISME J 6:1469 –1479.https://doi.org/10.1038/ismej.2011.211.
8. Moran MA. 2015. The global ocean microbiome. Science 350:aac8455.
https://doi.org/10.1126/science.aac8455.
9. DeLeon-Rodriguez N, Lathem TL, Rodriguez-R LM, Barazesh JM, Ander-son BE, Beyersdorf AJ, Ziemba LD, Bergin M, Nenes A, Konstantinidis KT. 2013. Microbiome of the upper troposphere: species composition and prevalence, effects of tropical storms, and atmospheric implications. Proc Natl Acad Sci U S A 110:2575–2580. https://doi.org/10.1073/ pnas.1212089110.
10. Caporaso JG, Lauber CL, Walters WA, Berg-Lyons D, Huntley J, Fierer N, Owens SM, Betley J, Fraser L, Bauer M, Gormley N, Gilbert JA, Smith G, Knight R. 2012. Ultra-high-throughput microbial community analysis on the Illumina HiSeq and MiSeq platforms. ISME J 6:1621–1624.https:// doi.org/10.1038/ismej.2012.8.
11. Kozich JJ, Westcott SL, Baxter NT, Highlander SK, Schloss PD. 2013. Development of a dual-index sequencing strategy and curation pipeline for analyzing amplicon sequence data on the MiSeq Illumina sequencing platform. Appl Environ Microbiol 79:5112–5120.https://doi.org/10.1128/ AEM.01043-13.
12. Fadrosh DW, Ma B, Gajer P, Sengamalay N, Ott S, Brotman RM, Ravel J. 2014. An improved dual-indexing approach for multiplexed 16S rRNA gene sequencing on the Illumina MiSeq platform. Microbiome 2:6.
https://doi.org/10.1186/2049-2618-2-6.
13. Caporaso JG, Kuczynski J, Stombaugh J, Bittinger K, Bushman FD, Costello EK, Fierer N, Peña AG, Goodrich JK, Gordon JI, Huttley GA, Kelley ST, Knights D, Koenig JE, Ley RE, Lozupone CA, McDonald D, Muegge BD, Pirrung M, Reeder J, Sevinsky JR, Turnbaugh PJ, Walters WA, Widmann J, Yatsunenko T, Zaneveld J, Knight R. 2010. QIIME allows analysis of high-throughput community sequencing data. Nat Methods 7:335–336.
https://doi.org/10.1038/nmeth.f.303.
14. Schloss PD, Westcott SL, Ryabin T, Hall JR, Hartmann M, Hollister EB, Lesniewski RA, Oakley BB, Parks DH, Robinson CJ, Sahl JW, Stres B, Thallinger GG, Van Horn DJ, Weber CF. 2009. Introducing mothur: open-source, platform-independent, community-supported software for de-scribing and comparing microbial communities. Appl Environ Microbiol 75:7537–7541.https://doi.org/10.1128/AEM.01541-09.
15. Wooley JC, Godzik A, Friedberg I. 2010. A primer on metagenomics. PLoS Comput Biol 6:e1000667.https://doi.org/10.1371/journal.pcbi.1000667. 16. Illumina. 2016. MiSeq system— denature and dilute libraries guide.
Doc-ument 15039740. Illumina, San Diego, CA.
17. Huse SM, Dethlefsen L, Huber JA, Mark Welch D, Relman DA, Sogin ML. 2008. Exploring microbial diversity and taxonomy using SSU rRNA hy-pervariable tag sequencing. PLoS Genet 4:e1000255.https://doi.org/ 10.1371/journal.pgen.1000255.
18. Kim M, Morrison M, Yu Z. 2011. Evaluation of different partial 16S rRNA gene sequence regions for phylogenetic analysis of microbiomes. J Microbiol Methods 84:81– 87. https://doi.org/10.1016/j.mimet.2010 .10.020.
19. Kumar PS, Brooker MR, Dowd SE, Camerlengo T. 2011. Target region selection is a critical determinant of community fingerprints generated by 16S pyrosequencing. PLoS One 6:e20956.https://doi.org/10.1371/ journal.pone.0020956.
20. Schloss PD. 11 September 2014. Why do I have such a large distance matrix? The Mothur Blog. http://blog.mothur.org/2014/09/11/Why-such-a-large-distance-matrix/.
21. Illumina.2013. Best practices for high sensitivity applications: minimiz-ing sample carryover. Illumina, San Diego, CA.
22. Eren AM, Morrison HG, Lescault PJ, Reveillaud J, Vineis JH, Sogin ML. 2015. Minimum entropy decomposition: unsupervised oligotyping for sensitive partitioning of high-throughput marker gene sequences. ISME J 9:968 –979.https://doi.org/10.1038/ismej.2014.195.
23. Callahan BJ, McMurdie PJ, Rosen MJ, Han AW, Johnson AJA, Holmes SP. 2016. DADA2: high-resolution sample inference from Illumina amplicon data. Nat Methods 13:581–583.https://doi.org/10.1038/nmeth.3869. 24. Mysara M, Leys N, Raes J, Monsieurs P. 2016. IPED: a highly efficient
denoising tool for Illumina MiSeq paired-end 16S rRNA gene amplicon sequencing data. BMC Bioinformatics 17:192.https://doi.org/10.1186/ s12859-016-1061-2.
25. Knights D. 2016. BugBase. University of Minnesota, Minneapolis, MN.
https://bugbase.cs.umn.edu/index.html.
26. Louca S, Parfrey LW, Doebeli M. 2016. Decoupling function and taxon-omy in the global ocean microbiome. Science 353:1272–1277.https:// doi.org/10.1126/science.aaf4507.
27. Comeau AM, Li WKW, Tremblay JÉ, Carmack EC, Lovejoy C. 2011. Arctic Ocean microbial community structure before and after the 2007 record sea ice minimum. PLoS One 6:e27492. https://doi.org/10.1371/ journal.pone.0027492.
28. Walters W, Hyde ER, Berg-Lyons D, Ackermann G, Humphrey G, Parada A, Gilbert JA, Jansson JK, Caporaso JG, Fuhrman JA, Apprill A, Knight R. 2016. Improved bacterial 16S rRNA gene (V4 and V4-5) and fungal internal transcribed spacer marker gene primers for microbial commu-nity surveys. mSystems 1:e00009-15.https://doi.org/10.1128/mSystems .00009-15.
29. Toju H, Tanabe AS, Yamamoto S, Sato H. 2012. High-coverage ITS primers for the DNA-based identification of ascomycetes and
on September 8, 2020 by guest
http://msystems.asm.org/
mycetes in environmental samples. PLoS One 7:e40863.https://doi.org/ 10.1371/journal.pone.0040863.
30. Smith AM, Heisler LE, Mellor J, Kaper F, Thompson MJ, Chee M, Roth FP, Giaever G, Nislow C. 2009. Quantitative phenotyping via deep barcode sequencing. Genome Res 19:1836 –1842. https://doi.org/10.1101/gr .093955.109.
31. Earth Microbiome Project. 2016. 18S Illumina amplicon protocol. Earth Microbiome Project. http://www.earthmicrobiome.org/emp-standard-protocols/18s/.
32. Andrews S. 2010. FastQC: a quality-control tool for high-throughput sequence data. Babraham Institute, Cambridge, United Kingdom.http:// www.bioinformatics.babraham.ac.uk/projects/fastqc/.
33. Zhang J, Kobert K, Flouri T, Stamatakis A. 2014. PEAR: a fast and accurate Illumina paired-end reAd mergeR. Bioinformatics 30:614 – 620.https:// doi.org/10.1093/bioinformatics/btt593.
34. Gordon A. 2009. FASTX-Toolkit: FASTQ/A short-reads pre-processing tools. Cold Spring Harbor Laboratory, Cold Spring Harbor, NY.http:// hannonlab.cshl.edu/fastx_toolkit/.
35. Bushnell B. 2014. BBMap: a fast, accurate, splice-aware aligner. LBNL Department of Energy Joint Genome Institute, Walnut Creek, CA.http:// 1ofdmq2n8tc36m6i46scovo2e.wpengine.netdna-cdn.com/wp-content/ uploads/2013/11/BB_User-Meeting-2014-poster-FINAL.pdf.
36. Rognes T, Flouri T, Nichols B, Quince C, Mahé F. 2016. VSEARCH: a versatile open source tool for metagenomics. PeerJ 4:e2584.https:// doi.org/10.7717/peerj.2584.
37. Edgar RC, Haas BJ, Clemente JC, Quince C, Knight R. 2011. UCHIME improves sensitivity and speed of chimera detection. Bioinformatics 27:2194 –2200.https://doi.org/10.1093/bioinformatics/btr381. 38. Rideout JR, He Y, Navas-Molina JA, Walters WA, Ursell LK, Gibbons SM,
Chase J, McDonald D, Gonzalez A, Robbins-Pianka A, Clemente JC, Gilbert JA, Huse SM, Zhou HW, Knight R, Caporaso JG. 2014. Subsampled open-reference clustering creates consistent, comprehensive OTU defi-nitions and scales to billions of sequences. PeerJ 2:e545.https://doi.org/ 10.7717/peerj.545.
39. Kopylova E, Noé L, Touzet H. 2012. SortMeRNA: fast and accurate filtering of ribosomal RNAs in metatranscriptomic data. Bioinformatics 28:3211–3217.https://doi.org/10.1093/bioinformatics/bts611.
40. Mercier C, Boyer F, Bonin A, Coissac E. 2013. SUMATRA and SUMACLUST: fast and exact comparison and clustering of sequences. http:// metabarcoding.org/sumatra/.
41. Nelson MC, Morrison HG, Benjamino J, Grim SL, Graf J. 2014. Analysis, optimization and verification of Illumina-generated 16S rRNA gene am-plicon surveys. PLoS One 9:e94249.https://doi.org/10.1371/journal.pone .0094249.
42. Love MI, Huber W, Anders S. 2014. Moderated estimation of fold change and dispersion for RNA-seq data with DESeq2. Genome Biol 15:550.
https://doi.org/10.1186/s13059-014-0550-8.
43. McMurdie PJ, Holmes S. 2014. Waste not, want not: why rarefying microbiome data is inadmissible. PLoS Comput Biol 10:e1003531.
https://doi.org/10.1371/journal.pcbi.1003531.
44. Lozupone C, Lladser ME, Knights D, Stombaugh J, Knight R. 2011. UniFrac: an effective distance metric for microbial community compar-ison. ISME J 5:169 –172.https://doi.org/10.1038/ismej.2010.133. 45. Parks DH, Tyson GW, Hugenholtz P, Beiko RG. 2014. STAMP: statistical
analysis of taxonomic and functional profiles. Bioinformatics 30: 3123–3124.https://doi.org/10.1093/bioinformatics/btu494.
46. Langille MGI, Zaneveld J, Caporaso JG, McDonald D, Knights D, Reyes JA, Clemente JC, Burkepile DE, Vega Thurber RL, Knight R, Beiko RG, Hut-tenhower C. 2013. Predictive functional profiling of microbial commu-nities using 16S rRNA marker gene sequences. Nat Biotechnol 31: 814 – 821.https://doi.org/10.1038/nbt.2676.
47. Truong DT, Franzosa EA, Tickle TL, Scholz M, Weingart G, Pasolli E, Tett A, Huttenhower C, Segata N. 2015. MetaPhlAn2 for enhanced metag-enomic taxonomic profiling. Nat Methods 12:902–903.https://doi.org/ 10.1038/nmeth.3589.
48. Abubucker S, Segata N, Goll J, Schubert AM, Izard J, Cantarel BL, Rodriguez-Mueller B, Zucker J, Thiagarajan M, Henrissat B, White O, Kelley ST, Methé B, Schloss PD, Gevers D, Mitreva M, Huttenhower C. 2012. Metabolic reconstruction for metagenomic data and its applica-tion to the human microbiome. PLoS Comput Biol 8:e1002358.https:// doi.org/10.1371/journal.pcbi.1002358.
49. Wood DE, Salzberg SL. 2014. Kraken: ultrafast metagenomic sequence classification using exact alignments. Genome Biol 15:R46. https:// doi.org/10.1186/gb-2014-15-3-r46.
![FIG 2 Example of amplicon performance in our presented workflow. The bacterial HMP Mock Community “B” sample (BEI Resources) was processed using 16SV4-V5 (515F�926R [28]) and V6-V8 (B969F�BA1406R [27]) primer sets through our on-bench and bioinformatics wor](https://thumb-us.123doks.com/thumbv2/123dok_us/8648292.1726061/4.594.45.542.76.331/performance-presented-workow-bacterial-community-resources-processed-bioinformatics.webp)