P
EDIATRICS
Feb 2002VOL. 109 NO. 2
䡠䡠䡠 䡠䡠䡠 䡠䡠䡠 䡠䡠䡠 䡠䡠
Can Regionalization Decrease the Number of Deaths for Children Who
Undergo Cardiac Surgery? A Theoretical Analysis
Ruey-Kang R. Chang, MD, MPH*, and Thomas S. Klitzner, MD, PhD‡
ABSTRACT. Objective. The association between high case volumes and better patient outcomes has been dem-onstrated for many surgical procedures and medical treatments, including surgery for children with congen-ital heart disease. To simulate the effects of regionaliza-tion of pediatric cardiac surgery, we assessed the impact of reducing the number of pediatric cardiac centers on surgical mortality and patient’s travel distance.
Methods. This study used abstracted statewide hos-pital discharge data from California from 1995 to 1997. Case volume and in-hospital mortality for pediatric car-diac surgeries at each hospital were calculated. All hos-pitals that performed>10 pediatric cardiac surgeries in 1995 to 1997 were included in the analysis. To simulate regionalization, we “closed” the hospital with the lowest case volume and redistributed patients from this hospital to the nearest remaining hospitals. The number of in-hospital deaths was then recalculated using the original mortality rate of each remaining hospital multiplied by its new case volume. A multivariate logistic regression was conducted to determine the odds ratios of mortality of various types of surgery compared with closure of ventricular septal defect. This result was used for adjust-ing for the case-mix of the hospitals. Regionalization simulation analysis was repeated, and the number of deaths was recalculated using this adjustment of hospital case-mix. We also examined the increase in travel dis-tance of patients to the hospitals as a result of the region-alization simulation.
Results. In California, 6592 children underwent car-diac surgeries in 1995 to 1997 with 352 in-hospital deaths (overall mortality rate: 5.34%). A quadratic regression model demonstrated that a high surgical volume was associated with a low mortality rate. We found
demarca-tions between low- and medium-volume hospitals at 70 cases per year and medium- and high-volume hospitals at 170 cases per year. With adjustment for hospital case-mix, we found that 41 deaths could be avoided when all patients from low-volume hospitals were referred, and 83 deaths could be avoided when all patients from low- and medium-volume hospitals were referred to high-volume hospitals (overall mortality rate decreased to 4.08%). The average travel distance for pediatric cardiac surgery was 45.4 miles, which increased by 12.7 miles when all sur-geries were referred to high-volume hospitals. When only the 733 high-risk patients were referred from low-and medium-volume hospitals to high-volume hospitals, 49 deaths could be avoided, yielding an overall mortality rate of 4.60%.
Conclusions. Theoretical regionalization of pediatric cardiac surgery is associated with a reduction in surgical mortality from 5.34% to 4.08% when all cases were re-ferred to high-volume hospitals, or decrease to 4.60% when high-risk cases were referred. Although regional-ization is associated with an important decrease in the number of deaths, it also increases the travel distance for patients. Additional studies on the costs and benefits of regionalization are needed to determine the best strate-gies to improve outcomes for children who undergo car-diac surgery.Pediatrics 2002;109:173–181;children, heart surgery, congenital heart disease, regionalization, out-come.
ABBREVIATIONS. OR, odds ratio; OSHPD, Office of Statewide Health Planning and Development;ICD-9-CM, International Clas-sification of Diseases, Ninth Revision, Clinical Modification; ASD, atrial septal defect; TAPVR, total anomalous pulmonary venous return; TOF, tetralogy of Fallot; VSD, ventricular septal defect.
R
egionalization is a regulatory approach to ra-tionalization of resource allocation, especially for highly specialized medical services or tech-nologies.1 Proposals to encourage regionalizationhave waxed and waned in popularity over the years.2A major argument in favor of regionalization
is the possibility of achieving better patient out-comes. Experiences in regionalizing perinatal and From the *Division of Cardiology, Department of Pediatrics, Harbor-UCLA
Medical Center, Torrance, California; and ‡Division of Cardiology, Depart-ment of Pediatrics, UCLA School of Medicine, Los Angeles, California. The abstract of this study was presented, in part, at the Association of Health Services Research Meetings; June 25, 2000; Los Angeles, CA. Received for publication August 30, 2000; accepted August 28, 2001. Reprint requests to (R-K.R.C.) Division of Cardiology, Department of Pedi-atrics, Harbor-UCLA Medical Center, 1000 W Carson St, Torrance, CA 90509. E-mail: [email protected]
neonatal care have resulted in improved outcomes for mothers and infants.3,4For high-risk surgical
pro-cedures such as cardiac surgery, regionalization may improve outcomes by consolidating surgical pro-grams and increasing the case volume of surgical centers. The first study to examine the empirical relationship between hospital volume and patient outcomes was published by Luft et al.5 Since then,
the direct relation between hospital volume and fa-vorable patient outcomes has been demonstrated by many studies for several surgical procedures and medical treatments.6 –14In 1990, Luft et al reviewed
the volume– outcome literature and published the book, Hospital Volume, Physician Volume, and Patient Outcomes.15More recently, Dudley et al16conducted
a systematic review of the volume– outcome studies published during the past decade.
The first study of the relation between hospital surgical volume and mortality of pediatric cardiac surgeries was conducted by Jenkins et al17 in 1995.
Using an administrative database, these authors demonstrated that risk-adjusted, in-hospital mortal-ity rates are lower in centers with higher volumes of pediatric cardiac surgeries. A more recent study by Hannan et al18 used a clinical database from New
York to evaluate the effect of the volume of pediatric cardiac surgery at a given hospital or performed by a particular surgeon on in-hospital mortality and reached similar conclusions. It was found that the odds ratio (OR) for mortality for a low-volume hos-pital (annual case volume⬍100) was 1.42 when com-pared with a high-volume hospital (annual case vol-ume ⱖ100).
In the study by Dudley et al,16 the results from
Hannan’s study were used to calculate potentially avoidable deaths in California, assuming that pa-tients from low-volume hospitals were selectively referred to high-volume hospitals. The authors found that by selective referral to high-volume hos-pitals, 7 deaths from pediatric cardiac surgery in California in 1997 could be avoided. However, the methodology of this study requires refinement. In addition, the impact of selective referral on factors such as cost and patient preference was not explored. The purpose of the current study was to evaluate the impact of regionalizing pediatric cardiac surgery on in-hospital mortality and the associated increase in travel distance for patients. Specifically, the aims of this study were to 1) examine the volume– out-come relation in pediatric cardiac surgery and focus on defining the demarcation between high- and low-volume hospitals, 2) use a refined simulation model to assess the impact of regionalization on potential avoidable deaths from pediatric cardiac surgery, and 3) determine the increase in travel distance for pa-tients associated with regionalization of pediatric cardiac surgery.
METHODS Data Sources
The study used the California statewide abstracted hospital discharge data from the California Office of Statewide Health Planning and Development (OSHPD). The OSHPD database in-cludes all hospital discharges in California. The 1995, 1996, and
1997 OSHPD data on hospital discharges were used in the current study. The OSHPD data containInternational Classification of Dis-eases, Ninth Revision, Clinical Modification (ICD-9-CM) discharge diagnosis and procedure codes assigned by California hospitals to each individual discharge during the year. Fields are provided for up to 24 diagnoses and 24 procedures. Routine demographic and administrative information such as age, gender, race, admission type and source, discharge status, length of hospitalization, and total hospital charges are listed in the OSHPD database. This administrative database contains important and valuable informa-tion on health care utilizainforma-tion and outcomes and has been used in many health services studies.19 –22
Case Selection
We selected children (⬍21 years of age) with principal proce-dure codes in the databases indicating cardiac surgery. The prin-cipal procedure code in the OSHPD database is based on the
ICD-9-CM. We used the following list of pediatric cardiac proce-dures and the correspondingICD-9-CM codes for these proce-dures to select study samples: closure of atrial septal defect (ASD; 3551, 3561, 3571), arterial switch operation (3584), repair of atrio-ventricular canal defect (3554, 3563, 3573), aortic valve replace-ment (3521, 3522), atrial switch operation (3591), aortopulmonary shunt (390), cavopulmonary shunt (3921), Fontan operation (3594), mitral valve replacement (3523, 3524), Norwood operation (pa-tients younger than 3 months with a diagnosis of hypoplastic left heart syndrome [3467] and a procedure code indicating cardio-pulmonary bypass [3961]), orthotopic heart transplant (375), right ventricle to pulmonary artery conduit (3592), repair of total anom-alous pulmonary venous return (TAPVR; 3582), truncus arteriosus repair (3583), repair of tetralogy of Fallot (TOF; 3581), repair or replacement of tricuspid or pulmonary valve (3525– 8, 3533–5, 3539), thoracic vessel surgery (3835, 3845, 3959), open valvulo-plasty (3510 – 4), and repair of ventricular septal defect (VSD; 3553, 3562, 3572). These 19 procedure groups were used for case-mix adjustment of in-hospital mortality of the hospitals.
Case Volume, Mortality Rate, and Regression Model
Many hospitals with 1 or 2 pediatric cardiac surgery admis-sions per year were listed in the OSHPD database. It is possible that small numbers of pediatric surgery cases were listed in these hospitals because of coding errors or because these cases were emergent cases that precluded referral to other hospitals. To avoid possible coding errors and to exclude cases for which selective referral may not have been feasible, we selected hospitals that performedⱖ10 pediatric cardiac surgeries in 1995 to 1997. The in-hospital mortality rate of each hospital was calculated. To de-fine the relation between case volume and mortality rate, we conducted a regression analysis. We used a weighted quadratic regression model, found useful to define the volume– outcome relation by many previous studies.15Each hospital was used as a
unit of regression. The independent variable was the case volume of the hospital. The dependent variable was the mortality rate of the hospital. The weight for each regression point, similar to other studies, was as follows:
冑
N2/冘
i
Pi共1⫺Pi兲
whereN⫽number of patients at a given hospital, andPiindicates
the probability of mortality for theithpatient in that hospital.15All
statistical analyses were performed using SPSS 8.0 for Windows (SPSS Inc, Chicago, IL).
Travel Distance
Regionalization Simulation
Because high surgical volume is associated with low mortality rate, we created a model to simulate regionalization by “referring” patients from low-volume hospitals to high-volume hospitals. To conduct this analysis, we made an assumption that the in-hospital mortality rates for high-volume hospitals remain unchanged as their case volumes are increased by referrals from low-volume hospitals.
The flow diagram of the regionalization simulation is presented in Fig 1. We first ranked the 20 hospitals by number of cases of pediatric cardiac surgery for the years 1995 to 1997. The hospital with the lowest number of cases was hypothetically closed for pediatric cardiac surgery services. Patients from this lowest vol-ume hospital were referred to the remaining hospitals nearest to their homes (judged by zip code). The number of deaths for each remaining hospital was recalculated using the new number of cases (including original cases plus patients referred from the lowest volume hospital) at each hospital multiplied by the original mortality rate at that hospital. Travel distances for patients re-ferred from the lowest volume hospital to the nearest remaining hospitals were recalculated, and the mean travel distance for all patients was recorded. After this process was completed, the lowest volume hospital among the remaining hospitals was then hypothetically closed and the patients from this hospital were referred to the nearest remaining hospitals. The number of deaths and travel distance were recalculated. The process of closing the lowest volume hospital, selective referral of patients to the nearest remaining hospitals, and recalculation of number of deaths and patient travel distance was repeated until only 2 hospitals were left providing pediatric cardiac surgery services in California.
We define the number of avoidable deaths as the difference between the original number of deaths (before simulation of re-gionalization) and the number of deaths after each step of region-alization. The number of avoidable deaths was calculated after each lowest volume hospital was closed and its patients were redistributed during the regionalization simulation. The results of this analysis were used to divide the hospitals into 3 groups: low-, medium-, and high-volume hospitals. The regionalization simu-lation analysis was first conducted without adjustment for hospi-tal case-mix. This analysis was then repeated with adjustment for hospital case-mix.
Adjustment for Hospital Case Mix
In contrast to adults who undergo coronary artery bypass graft surgery, children with various forms of congenital heart defects undergo a wide variety of surgical procedures to palliate or repair cardiac defects. Although there is no consensus among researchers regarding 1 best approach for case-mix adjustment, previous stud-ies have attempted risk stratification by grouping various surgical procedures. In the present study, we chose to categorize pediatric cardiac surgical procedures into 19 procedure groups, as de-scribed in the Case Selection section. To calculate the OR for mortality of various procedure groups using VSD closure as the reference group (OR⫽1), we conducted a logistic regression to
control for the following variables: age (neonate⬍1 month, infant ⱖ1 month and ⬍1 year, and child ⱖ1 year; child ⱖ1 year as reference group), gender (male and female; male as reference group), race and ethnicity (white, black, nonwhite and nonblack Hispanic, Asian and Pacific Islander, and others; white as refer-ence group), type of insurance (private insurance, managed care, public insurance and others; private insurance as reference group), and family income (using median household income of home zip code; income ⬎$60 000 as reference group), type of admission (elective or nonelective; elective as reference group), and surgical volume of the hospital (low, medium, and high; high as reference group). In addition, the logistic regression also con-trolled for the following comorbidity conditions listed in the di-agnosis code: prematurity, failure to thrive, Down syndrome, and pulmonary hypertension.
In a subsequent analysis, surgical procedures were classified as low-risk procedures for those procedure groups with OR for mor-tality that were statistically equal to or lower than mormor-tality for VSD and as high-risk procedures for those procedure groups with OR for mortality that were statistically higher than mortality for VSD. For low-risk procedures, we conducted a logistic regression analysis to calculate the OR for mortality when low- and medium-volume hospitals were compared with high-medium-volume hospitals when all other variables (eg, age, gender) were controlled. This process was repeated for the high-risk procedures to calculate the OR for mortality when low- and medium-volume hospitals were compared with high-volume hospitals.
The regionalization simulation process was then repeated using case-mix adjustment for the hospitals. For each patient who was referred from a low-volume hospital to a medium-volume hospi-tal, the risk for mortality was adjusted using the OR for mortality of low-volume hospital compared with the medium-volume hos-pital for that procedure (low- or high-risk procedure). Similar adjustments were conducted when patients from the low-volume hospitals were referred to the high-volume hospitals or when patients from the medium-volume hospitals were referred to the high-volume hospitals. After all patients from the low-volume hospitals were referred, the overall number of deaths and the number of avoidable deaths were calculated. Then the regional-ization process was repeated until 2 hospitals were left in Califor-nia.
Regionalization Scenarios
Different regionalization scenarios were considered: 1) all hos-pitals with initial case volume⬍100 cases/year were closed (as proposed by Hannan et al18and used by Dudley et al16), 2) all
low-volume hospitals (⬍70 case/year) were closed, 3) all low- and medium-volume hospitals (⬍170 case/year) were closed, and 4) hospitals were sequentially closed until only 2 highest volume hospitals were providing pediatric cardiac surgery services. The purpose of this analysis was to determine the relation between the reduction of mortality and increase in travel distance associated with regionalization for the different scenarios.
After determining the OR for mortality by low- and high-risk
Fig 1. The flow diagram of the regionalization simulation model. The steps were repeated until only 2 hospitals were left to provide
procedures comparing low-, medium-, and high-volume hospi-tals, we created another regionalization scenario by referring only patients who were undergoing high-risk procedures from the low-and medium-volume hospitals to high-volume hospitals. This was done to test the hypothesis that selective referral of only patients who are undergoing high-risk procedures to high-volume hospi-tals can increase the number of avoidable deaths without the need to close many low- and medium-volume hospitals, mitigating the effect of regionalization on a patient’s travel distance.
RESULTS
We identified 6972 children who underwent con-genital heart disease surgeries at 65 hospitals in Cal-ifornia between 1995 and 1997. Although the surger-ies were performed at 65 hospitals, nearly half (30 hospitals) had only 1 pediatric cardiac surgery case during the 3-year period. After excluding surgeries performed in centers with⬍10 cases and cases with missing information, 6592 cases of surgery from 20 hospitals were entered into the analysis. There were 1088 neonates (16.5%), 1869 infants (28.4%), and 3635 children (55.1%). The overall in-hospital mortality was 352, yielding a mortality rate of 5.34%.
Volume–Outcome Relationship
Figure 2 demonstrates the case volume versus in-hospital mortality rate for the 20 in-hospitals included in the analysis. As has been demonstrated by previ-ous studies, mortality rates for low-volume hospitals tend to have a wide range of distribution. It is ap-parent that the variance in mortality rates among hospitals decreases as the case volume of hospitals increases to approximately an average case volume of 170 per year. The variance in mortality rates was 0.136% for hospitals with ⬍170 cases per year and 0.004% for hospitals with ⱖ170 case per year. It is also apparent from the regression curve that when the case volume of hospitals isⱖ170 cases/year, the curve becomes almost flat and the decrease in
mor-tality rate with increasing case volume becomes min-imal.
Hannan et al18used a case volume of 100 per year
as a discriminator between high-volume and low-volume hospitals because it “yielded the largest dif-ferential in risk-adjusted mortality rates between the 2 groups while maintaining reasonably large vol-umes in the 2 groups.” However, we found the larg-est differential at a case volume of 170 cases/year: the mortality rate was 4.91% for hospitals withⱖ170 cases/year compared with a mortality rate of 6.23% for hospitals with ⬍170 cases/year in our study group.
The quadratic regression model using case volume as the independent variable and mortality rate as the dependent variable is also shown in Fig 2. The R2
value for the regression model is 0.14 (P⬍ .01).
Regionalization Simulation
In our simulated regionalization, closing hospitals one at a time as described in “Methods”, we found that as the number of hospitals was reduced from 20 to 13, the number of avoidable deaths fluctuated between⫺4 and⫹4. Figure 3 shows a graph of the number of remaining hospitals with regionalization (x axis) versus the number of avoidable deaths for that number of remaining hospitals (y axis). It is obvious that there are 2 inflection points in the graph of the number of avoidable deaths versus remaining hospitals, indicating 2 sharp rises in the number of avoidable deaths. The first sharp rise in the number of avoidable deaths occurred when the number of hospitals was decreased to 11. Therefore, we defined the first 9 hospitals with average annual case volume of ⬍70 as low-volume hospitals. The second sharp rise in the number of avoidable deaths occurred when 5 hospitals remained. Therefore, we defined
Fig 2. A scatter plot demonstrates the case volume and in-hospital mortality rates (not adjusted for case mix) of the hospitals. Nine
the 6 hospitals (hospital 11 to hospital 6) with aver-age annual case volume between 70 and 170 as me-dium-volume hospitals and the largest 5 hospitals with an annual case volume ofⱖ170 as high-volume hospitals. As shown in Fig 3, closing the low-volume hospitals has a minimal effect on reducing the num-ber of deaths. Of note, the decrease in numnum-ber of deaths became consistently positive and significant when all remaining hospitals had an original case volume ofⱖ70 cases/year.
Adjustment for Hospital Case Mix
We used VSD closure (overall mortality rate: 2.15%) as the reference group to calculate the OR for mortality in the multivariate logistic regression model. As shown in Fig 4, the mortality OR for atrioventricular canal repair, TAPVR repair, TOF re-pair, truncus arteriosus rere-pair, open valvuloplasty, aortic valve replacement, mitral valve replacement, right ventricle to pulmonary artery conduit, Fontan operation, atrial switch operation, and Norwood op-eration were significantly greater than 1 (compared with VSD closure) and were therefore defined as high-risk procedures. The mortality OR for thoracic vessel procedures, orthotopic heart transplant, tri-cuspid or pulmonary valve procedures, arterial switch operation, aortopulmonary shunt, and Glenn shunt were not statistically different from 1, and the OR for ASD closure was significantly lower than 1. These procedures with similar or lower OR for mor-tality compared with VSD closure were defined as the low-risk procedures.
Table 1 lists the case-mix adjustment results when the type of surgery was categorized by high and low risk and the hospitals were stratified to low-,
medi-um-, and high-volume hospitals. When patients were transferred from low-volume hospitals to medium-volume hospitals, there was no statistical difference in OR for mortality in either low- or high-risk pro-cedures. When patients were transferred from low-volume hospitals to high-low-volume hospitals, there was no statistical significance in the OR for mortality of low-risk procedures, but the odds of mortality decreased by 2.67-fold (P⬍.01) for high-risk proce-dures. When patients were transferred from medi-um-volume hospitals to high-volume hospitals, the odds for mortality decreased by 1.54 (P ⬍ .05) for low-risk procedures and by 2.54 (P ⬍.01) for high-risk procedures. In an additional analysis to adjust for case mix of the hospitals, these OR comparing low-risk and high-risk procedures, respectively, among low-, medium-, and high-volume hospitals were used to recalculate the changes in the number of deaths in the regionalization simulation.
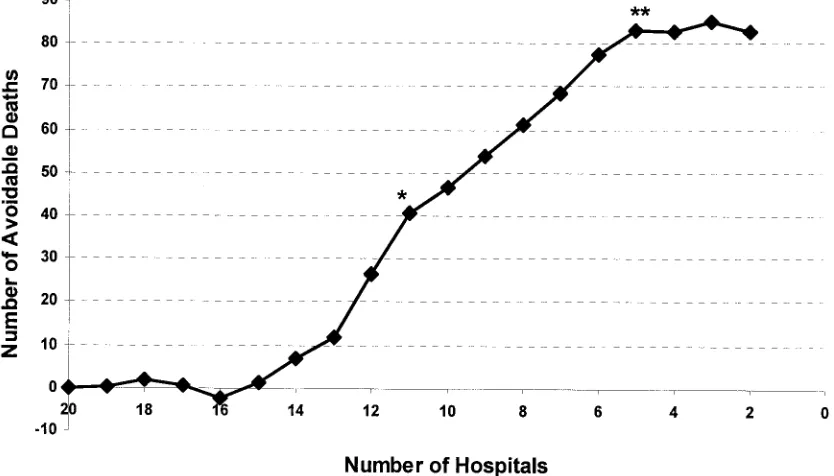
Figure 5 shows the results of regionalization sim-ulation analysis with adjustment for case-mix of the hospitals. As expected, the curve in Fig 5 appears smoother with less fluctuation compared with the curve in Fig 3 without case-mix adjustment. There was essentially no change in the number of deaths when the number of hospitals decreased from 20 to 15; after that, the number of avoidable deaths began to rise. The number of avoidable deaths reached a plateau when 5 hospitals were left in California, and no significant change was noted as the number of hospitals decreased below 5.
Regionalization Scenarios
Table 2 lists the results of various regionalization scenarios, with and without adjustment for hospital
Fig 3. Results from the regionalization simulation without adjustment for hospital case mix. Note that the number of avoidable deaths
case-mix. When 9 low-volume hospitals were closed (11 hospitals remained), the number of avoidable deaths with case-mix adjustment was 41 and the overall mortality rate decreased from 5.34% to 4.72%. When 12 hospitals with an average annual case vol-ume of⬍100 were closed (8 hospitals remained), the number of avoidable deaths was 61 and the overall mortality rate decreased to 4.41%. The highest num-ber of avoidable deaths, 83, and the lowest mortality rate, 4.08%, occurred when only 5 high-volume hos-pitals with an average annual case volume ofⱖ170 remained. Decreasing the number of hospitals fur-ther to 2 hospitals did not result in a significant increase in the number of avoidable deaths or
de-crease in overall mortality rate, but the mean travel distance increased steeply.
The mean travel distance for children who were undergoing cardiac surgery in California was 45.4 miles. The mean travel distance increased by only 3.9 miles when the number of hospitals was reduced from 20 to 11. When all hospitals with a case volume of⬍100 cases/year were closed (ie, all patients were sent to the 8 hospitals with an annual case volume of
ⱖ100), the increase in mean travel distance was 6.9 miles. When the maximum reduction of the number of deaths was achieved (5 hospitals remained in Cal-ifornia), the mean travel distance increased by 12.7 miles. When only 2 hospitals were left to provide
Fig 4. OR for mortality of 19 procedure groups using VSD closure as the reference (OR: 1). Solid circles denote the mortality OR of the
procedure group compared with VSD closure. Horizontal bars denote the 95% confidence intervals of the OR. Procedures with statistically higher OR for mortality (those with OR and confidence intervals⬎1, indicated by dashed line), including atrioventricular canal repair (AVC) to Norwood operation, are defined as high-risk procedures. Procedures with similar or lower OR for mortality, including ASD closure to Glenn shunt, are defined as low-risk procedures. APSHUNT, aortopulmonary shunt procedure (n⫽537); ASD, closure of atrial septal defect (n⫽1158); ASO, arterial switch operation (n⫽279); ATRSWIT, atrial switch operation (n⫽51); AVC, atrioventricular canal repair (n⫽398); AVR, aortic valve replacement (n⫽205); FONTAN, Fontan operation (total cavopulmonary anastomosis;n⫽235); GLENN, Glenn shunt (cavopulmonary shunt;n⫽290); MVR, mitral valve replacement (n⫽86); NORWOOD, Norwood operation (n⫽
118); OHT, orthotopic heart transplantation (n⫽111); RVPVC, right ventricle to pulmonary artery conduit placement (n⫽126); TAPVR, repair of total anomalous pulmonary venous return (n⫽212); TOF, tetralogy of Fallot repair (n⫽617); TRUNCUS, truncus arteriosus repair (n⫽70); TVESSEL, thoracic vessel procedure (n⫽351); TVPVA, tricuspid or pulmonary valve repair or replacement (n⫽255); VALVOT, open valvuloplasty (n⫽422); VSD, closure of ventricular septal defect (n⫽1071).
Table 1. OR for Mortality of High- and Low-Risk Procedures When Patients From Low- and Medium-Volume Hospitals Were
Referred to Medium- and High-Volume Hospitals
Hospitals Low-Risk Procedures High-Risk Procedures
Referring Receiving (OR⫽1) OR 95% CI OR 95% CI
Low volume 3Medium volume 0.86 0.49–1.49 1.27 0.73–2.17
Low volume 3High volume 1.24 0.78–1.99 2.67† 1.72–4.13
Medium volume 3High volume 1.54* 1.02–2.33 2.54† 1.60–4.04 CI indicates confidence interval.
pediatric cardiac surgery services, there was very little additional reduction in the number of deaths; however, the mean travel distance increased by 33.6 miles. As listed in Table 2, the average travel distance among patients who were referred was 66.9 miles when the number of hospitals decreased to 11 and was 98.2 miles when the number of hospitals de-creased to 5.
A total of 733 patients underwent high-risk proce-dures at the low- and medium-volume hospitals, accounting for 27.2% of all surgeries performed in these hospitals or 38.1% of all high-risk surgery cases in 1995 to 1997. When only high-risk surgery patients were selectively referred from low- and medium-volume hospitals to high-medium-volume hospitals, the num-ber of avoidable deaths was 49. Thus, the overall mortality decreased to 4.60% when all high-risk sur-geries were selectively referred to high-volume hos-pitals.
DISCUSSION
Jenkins et al17 reported a significant volume–
out-come relation in pediatric cardiac surgery using the 1989 California data. In the present study, we found
similar volume– outcome relations for pediatric car-diac surgery performed in 1995 to 1997. Unlike pre-vious studies that used 100 cases/year as the demar-cation for high-volume and low-volume hospitals, we found that there are 3 groups of hospitals defined by average case volumes of⬍70, 70 to 170, andⱖ170 cases per year. In a theoretical analysis, we found that as the number of hospitals decreased, the num-ber of avoidable deaths did not become significant until all low-volume hospitals (case volume of ⬍70 per year) were closed. When the number of avoid-able deaths reached a plateau, 83 deaths (or an aver-age of 28 deaths per year) could be avoided when surgeries were regionalized to 5 hospitals. However, to achieve this maximum benefit of regionalization requires closure of three quarters of current pediatric cardiac centers and an associated increase in mean travel distance of 12.7 miles for all patients, or 52.8 miles for patients who are transferred.
Surgical mortality rates of the hospitals in our study became more stable and predictable when the annual case volume wasⱖ170 cases/year (Fig 2). In addition, it has been shown that for adult open-heart surgery and cardiac catheterization, an economy of
Fig 5. Results from the regionalization simulation with adjustment for hospital case mix. This curve appears smoother with less
fluctuation than the curve in Fig 3 (without case-mix adjustment). Note that the number of avoidable deaths was insignificant when the first 7 low-volume hospitals were closed. Once the number of hospitals decreased to fewer than 14, the number of avoidable deaths continued to rise until there 5 hospitals (high-volume hospitals) remained in California (**).
Table 2. Scenarios of Regionalization and Associated Decrease in Mortality and Increase in Travel Distance
Not Case-Mix Adjusted Case-Mix Adjusted Mean Travel Distance of All Patients (Miles)
Mean Travel Distance of
Patients Transferred* Avoidable
Deaths
Mortality Rate
Avoidable Deaths
Mortality Rate
20 Hospitals 0 5.34% 0 5.34% 45.4 —
11 Hospitals 17 5.08% 41 4.72% 49.3 66.9
8 Hospitals 21 5.02% 61 4.41% 52.3 76.7
5 Hospitals 32 4.85% 83 4.08% 58.1 98.2
2 Hospitals 32 4.85% 85 4.05% 79.0 181.4
scale is achieved at an annual case volume of 200 to 300.23 We believe that this conclusion may also
apply to pediatric cardiac surgery. Therefore, we found it preferable to use case volume of approxi-mately 200 per year (instead of 100 per year used by Hannan et al) to define high- and low-volume hos-pitals in pediatric cardiac surgery. This is consistent with the federal health planning guidelines for car-diac surgery centers and the recommendation by the Inter-Society Commission for Heart Disease Re-sources.24,25 In addition, based on the simulation
analysis, we found categorizing the hospitals into 3 case volume levels (low, medium, and high) is a better approach than the high- and low-volume di-chotomy used by previous studies.
The number of in-hospital deaths did not change significantly or increased slightly when all patients from low-volume hospitals were transferred to me-dium- and high-volume hospitals (number of hospi-tals decreased to 13 in Figs 3 and 5). This is probably because of the relatively small number of patients in the low-volume hospitals and higher mortality rates in some medium-volume hospitals. However, when all low- and medium-volume hospitals were closed, the number of avoidable deaths increased signifi-cantly. Although we found the highest number of avoidable deaths when all pediatric cardiac surgery in California was regionalized to 2 hospitals, this extreme level of regionalization seems to be imprac-tical and may be ineffective in relation to costs. When pediatric cardiac surgery was regionalized to a more practical scenario of 5 hospitals with case volume of
ⱖ170/year, 83 avoidable deaths could be achieved with a more reasonable cost from increase in travel distance (12.7 miles per patient on average).
When the type of procedures were divided into high-risk and low-risk, it was clear that low- and medium-volume hospitals had much higher mortal-ity for risk procedures compared with high-volume hospitals (Table 1). Even for low-risk proce-dures, low- and medium-volume hospitals had higher mortality (OR: 1.24 and 1.54, respectively) compared with high-volume hospitals. Furthermore, there were 34 avoidable deaths (total: 83 avoidable deaths; subtract 49 from high-risk procedures) or 40% of all avoidable deaths from low-risk procedures when patients were transferred to high-volume hos-pitals. The cause of higher mortality in low- and medium-volume hospitals for low-risk procedures requires additional investigation.
The increase in travel distance was small even when more than two thirds of the hospitals were closed. This is largely because in California, most patients live in metropolitan areas where the pediat-ric cardiac centers are located. In addition, most pe-diatric cardiac centers are located in population-dense areas and many are in close proximity to one another. Although we did not conduct a cost-benefit analysis in the current study, we do not believe that an average increase in travel distance of 12.7 miles will result in significant additional cost to the pa-tients or to society. On the benefit side, regionaliza-tion has been shown to reduce utilizaregionaliza-tion of hospital beds and overall health care costs.26,27 A truly
com-prehensive consideration of the economics of region-alization may be complex and is beyond the scope of the current analysis.
When patients are referred to different hospitals, patient preference must also be taken into account. Finlayson et al28 found that 45% of patients would
prefer surgery at a local hospital instead of a regional referral center 4 hours away even if the local hospi-tal’s operative mortality risk was twice as high (6% vs 3%). It is difficult to extrapolate the results of Finlayson’s study on adults to pediatric patients. Future studies on parent decision making with re-gard to medical care for their children will help to clarify patient preference issues and the feasibility of selective referral.
In our study, we conducted a theoretical analysis of regionalization using hypothetical scenarios in which hospitals were “closed” for pediatric cardiac surgery services. This analysis was based on data from California, a very large, competitive, and satu-rated health care market. The results from our anal-ysis in California may not be applicable to other areas of the United States or other countries where the demographic, geographic, and health care mar-ket characteristics are different from California. For example, Sweden experienced a dramatic decrease in surgical mortality for pediatric heart surgery after centralizing surgery services from 4 centers to 2 cen-ters.29
The Swedish experience also indicates that the process of achieving regionalization is long (20 years) and “difficult” when the number of pediatric cardiac centers was reduced from 4 to 2.29In our simulation
analysis, the maximum benefit of regionalization would reduce the overall surgical mortality to 4.08%, but this requires closing pediatric cardiac surgery services in three fourths of current hospitals and referring 40.8% of all patients to high-volume hospi-tals. A more practical approach might be to refer only risk patients (11.1% of all patients) to high-volume hospitals. This approach would reduce the overall mortality rate to 4.60% with a much smaller increase in travel distance.
Although regionalization decreases mortality and may have a favorable cost-benefit ratio, it may not be the most feasible and cost-effective way to reduce mortality for pediatric cardiac surgery. Alternative strategies for improving outcomes of children who are undergoing cardiac surgery include implementa-tion of quality assurance programs, selective use of clinical pathways, and education and training of physicians and supporting staff at low- or medium-volume hospitals with high mortality rates. These strategies may also improve overall surgical out-comes and may have a lower cost to the health care system as a whole than regionalization. More studies are needed to explore these speculations further.
Limitations
A major limitation of this study comes from errors related to miscoding and missing data in an admin-istrative database.30 –32 In the present study, we
with ⱖ10 cases/year of pediatric cardiac surgery. However, missing data and miscoding of patients selected for our study may still exist and potentially bias our findings.
In addition, we examined the effects of regionaliz-ing all pediatric cardiac surgery to high-volume hos-pitals. Importantly, we also attempted to adjust for the case-mix of the hospitals using different levels of risk involved in various types of surgery for pediat-ric heart disease. Although there is no well-accepted risk adjustment methodology for pediatric cardiac surgeries, categorizing the risk levels for various types of surgical procedures has been used by pre-vious researchers. In the present study, we adopted and expanded this approach by increasing the num-ber of the procedure groups to 19 and added 4 co-morbidity conditions. However, it is possible that other important medical variables, such as medical history, or other cardiac and noncardiac conditions are not adequately accounted for using this ap-proach. Future studies using detailed clinical data-bases are needed to refine the risk adjustment strat-egy used in this study.
CONCLUSION
Regionalization of pediatric cardiac surgery in Cal-ifornia had no apparent effect on reducing surgical mortality until more than one third of current hos-pitals (with a case volume of ⬍70 per year) were “closed.” At maximum, the mortality rate decreased from 5.34% to 4.08% when all cases were referred to high-volume hospitals. However, this requires clo-sure of three fourths of the current pediatric cardiac centers. When only high-risk surgeries were selec-tively referred to high-volume hospitals, the overall mortality rate decreased to 4.6%. Although regional-ization is associated with an important decrease in the number of deaths, it also increases the travel distance for patients. Additional studies on the cost-effectiveness of regionalization are needed to deter-mine the best strategies to improve outcomes of chil-dren who undergo cardiac surgery.
ACKNOWLEDGMENT
R-K.R.C. was a postdoctoral fellow of the Agency for Health-care Research and Quality and received an institutional research grant from the Harbor-UCLA Research and Education Institute.
REFERENCES
1. Ginzburg E.Regionalization & Health Policy. US Department of Health Education and Welfare. Washington, DC: US Government Printing Office; 1977. DHEW Publ. No. [HRA] 77-623
2. Luft HS. Regionalization of medical care.Am J Public Health. 1985;75: 125–126
3. Merkatz IR, Johnson K. Regionalization of perinatal care for the United States.Clin Perinatol. 1976;3:271–276
4. Rudolph CS, Borker SR.Regionalization. Issues in Intensive Care for High Risk Newborns and Their Families.New York, NY: Praeger Publishers; 1987
5. Luft HS, Bunker JP, Enthoven AC. Should operations be regionalized? The empirical relation between surgical volume and mortality.N Engl J Med. 1979;301:1364 –1369
6. Hannan EL, O’Donnell JF, Kilburn H Jr, Bernard HR, Yazici A. Inves-tigation of the relationship between volume and mortality for surgical procedures performed in New York State hospitals.JAMA. 1989;262: 503–510
7. Phibbs CS, Bronstein JM, Buxton E, Phibbs RH. The effects of patient volume and level of care at the hospital of birth on neonatal mortality.
JAMA. 1996;276:1054 –1059
8. Stone VE, Seage GR III, Hertz T, Epstein AM. The relation between hospital experience and mortality for patients with AIDS.JAMA. 1992; 268:2655–2661
9. Bennett CL, Garfinkle JB, Greenfield S, et al. The relation between hospital experience and in-hospital mortality for patients with AIDS-related PCP.JAMA. 1989;261:2975–2979
10. Begg CB, Cramer LD, Hoskins WJ, Brennan MF. Impact of hospital volume on operative mortality for major cancer surgery.JAMA. 1998; 280:1747–1751
11. Cebul RD, Snow RJ, Pine R, Hertzer NR, Norris DG. Indications, out-comes, and provider volumes for carotid endarterectomy.JAMA. 1998; 279:1282–1287
12. Kimmel SE, Berlin JA, Laskey WK. The relationship between coronary angioplasty procedure volume and major complications.JAMA. 1995; 274:1137–1142
13. Hannan EL, Racz M, Ryan TJ, et al. Coronary angioplasty volume-outcome relationships for hospitals and cardiologists.JAMA. 1997;277: 892– 898
14. Hughes RG, Hunt SS, Luft HS. Effects of surgeon volume and hospital volume on quality of care in hospitals.Med Care. 1987;25:489 –503 15. Luft HS, Garnick DW, Mark DH, McPhee SJ.Hospital Volume, Physician
Volume, and Patient Outcomes. Assessing the Evidence.Ann Arbor, MI: Health Administration Press Perspectives; 1990
16. Dudley RA, Johansen KL, Brand R, Rennie DJ, Milstein A. Selective referral to high-volume hospitals: estimating potentially avoidable deaths.JAMA. 2000;283:1159 –1166
17. Jenkins KJ, Newburger JW, Lock JE, et al. In-hospital mortality for surgical repair of congenital heart defects: preliminary observations of variation by hospital caseload.Pediatrics. 1995;95:323–330
18. Hannan EL, Racz M, Kavey RE, Quaegebeur JM, Williams R. Pediatric cardiac surgery: the effect of hospital and surgeon volume on in-hospital mortality.Pediatrics. 1998;101:963–969
19. Chernew M, Haywood R, Scanlon D. Managed care and open-heart surgery facilities in California.Health Aff (Milwood). 1996;15:191–201 20. Calmes D, Leake BD, Carlisle DM. Adverse asthma outcomes among
children hospitalized with asthma in California.Pediatrics. 1998;101: 845– 850
21. Chang R-KR, Chen AY, Klitzner TS. Factors associated with age at operation for children with congenital heart disease.Pediatrics. 2000;105: 1073–1081
22. Erickson LC, Wise PH, Cook EF, Beiser A, Newburger JW. The impact of managed care insurance on use of lower-mortality hospitals by children undergoing cardiac surgery in California.Pediatrics. 2000;105: 1271–1278
23. McGregor M, Pelletier G. Planning of specialized health facilities: size vs. cost and effectiveness in heart surgery.N Engl J Med. 1978;299: 179 –181
24. US Department of Health, Education, and Welfare. Health planning: national guidelines.Fed Reg. 1978;43:1304 –1350
25. Scannel JG, Brown GE, Buckley MJ. Report of the Inter-Society Com-mission for the Heart Disease Resources: optimal resources for cardiac surgery: guideline for program planning and evaluation.Circulation. 1975;53:A1–A37
26. Gordon TA, Burleyson GP, Tielsch JM, Cameron JL. The effects of regionalization on cost and outcome for one general high-risk surgical procedure.Ann Surg. 1995;221:43– 49
27. Hamilton SM, Letourneau S, Pekeles E, Voaklander D, Johnston DW. The impact of regionalization on a surgery program in the Canadian health care system.Arch Surg. 1997;132:605– 609
28. Finlayson SR, Birkmeyer JD, Tosteson AN, Nease RF Jr. Patient prefer-ences for location of care: implications for regionalization.Med Care. 1999;37:204 –209
29. Lundstrom NR, Berggren H, Bjorkhem, Jogi P, Sunnegardh J. Central-ization of pediatric heart surgery in Sweden.Pediatr Cardiol. 2000;21: 353:357
30. Corn RF. Quality control of hospital discharge data.Med Care. 1980;18: 416 – 426
31. Demlo LK, Campbell PM. Improving hospital discharge data: lesson from the national hospital discharge survey. Med Care. 1981;19: 1030 –1040
DOI: 10.1542/peds.109.2.173
2002;109;173
Pediatrics
Ruey-Kang R. Chang and Thomas S. Klitzner
Cardiac Surgery? A Theoretical Analysis
Can Regionalization Decrease the Number of Deaths for Children Who Undergo
Services
Updated Information &
http://pediatrics.aappublications.org/content/109/2/173
including high resolution figures, can be found at:
References
http://pediatrics.aappublications.org/content/109/2/173#BIBL
This article cites 29 articles, 6 of which you can access for free at:
Subspecialty Collections
http://www.aappublications.org/cgi/collection/cardiac_surgery_sub
Cardiac Surgery
http://www.aappublications.org/cgi/collection/surgery_sub
Surgery
following collection(s):
This article, along with others on similar topics, appears in the
Permissions & Licensing
http://www.aappublications.org/site/misc/Permissions.xhtml
in its entirety can be found online at:
Information about reproducing this article in parts (figures, tables) or
Reprints
http://www.aappublications.org/site/misc/reprints.xhtml
DOI: 10.1542/peds.109.2.173
2002;109;173
Pediatrics
Ruey-Kang R. Chang and Thomas S. Klitzner
Cardiac Surgery? A Theoretical Analysis
Can Regionalization Decrease the Number of Deaths for Children Who Undergo
http://pediatrics.aappublications.org/content/109/2/173
located on the World Wide Web at:
The online version of this article, along with updated information and services, is
by the American Academy of Pediatrics. All rights reserved. Print ISSN: 1073-0397.