Lincoln
University
Digital
Thesis
Copyright
Statement
The
digital
copy
of
this
thesis
is
protected
by
the
Copyright
Act
1994
(New
Zealand).
This
thesis
may
be
consulted
by
you,
provided
you
comply
with
the
provisions
of
the
Act
and
the
following
conditions
of
use:
you
will
use
the
copy
only
for
the
purposes
of
research
or
private
study
you
will
recognise
the
author's
right
to
be
identified
as
the
author
of
the
thesis
and
due
acknowledgement
will
be
made
to
the
author
where
appropriate
you
will
obtain
the
author's
permission
before
publishing
any
material
from
the
thesis.
Absorption of Nitrogen
from a Liquid
by
Pine Bark
A
thesis submitted in partial fulfilment
"
of t1;1e
n~quirement
for the Degree of
Masters of Applied Science
at
Lincoln University
, by
Simon J. Musgrave
Lincoln University
Abstract of a thesis submitted in partial fulfilment of the
requirement for the Degree ofM.Appl.Sci.
Absorption of Nitrogen from a Liquid
by Pine Bark
by Simon J. Musgrave
This study investigated the potential of Pinus radiata (pine) bark to absorb organic
and ammoniacal-nitrogen, from an aqueous solution and from a dairy slurry, in the
laboratory and in a field treatment of dairy slurry. Preliminary experiments indicated
that the initial nitrogen concentration of the solution had a significant effect on the
rate of nitrogen absorption. The range of physical and chemical characteristics in pine
bark and dairy slurry was found to give some variation in the quantity of nitrogen
absorbed over time. ,Some unexplained results were attributed to differences in pine
bark characteristics between samples, and to undefined analytical errors which may
have included microbial activity in stored samples. Phenyl mercuric acetate was
found to have no significant effect on the analysis of ammoniacal nitrogen using the
Flow Injection Analyser, and was hence used for the inhibition of microbial activity in
subsequent samples during storage.
Empirical models were developed for predicting the amount of ammoniacal and
organic nitrogen absorbed, from an aqueous solution of ammonium sulphate and from
concentration of 50 ppm-N, to 15% from an initial concentration of200 ppm-No After
three weeks, approximately 75% of the ammoniacal-nitrogen was absorbed from a
solution of 100 ppm-N ammonium sUlphate at pH 6. About 50% of the total nitrogen
in a dairy slurry was absorbed by pine bark over two weeks. The model developed for
predicting the absorption of ammoniacal-nitrogen was tested and found not
_ appropriate for describing the ab~orption of total nitr~gen from a dairy slurry. A new
empirical model was developed for the dairy slurry.
Initial pH of the solution was shown to have an effect on the mechanism of nitrogen
absorption. At pH6 there was no difference in the absorption of nitrogen by sterilised
and non-sterilised bark, whereas at pH 8 there was a significant reduction in
absorption of nitrogen by sterilised bark. This suggested that the absorption of
nitrogen at pH 6 was largely chemical, whereas at pH 8 there was significant
microbially mediated absorption.
Infra-red spectroscopy was used to deduce some possible functional groups involved
in the absorption of various forms of nitrogen. A simple on-farm dairy effluent
treatment system was designed and tested, with some success. In conclusion, pine
bark was shown to have potential to remove significant quantities of organic and
ammoniacal-nitrogen from a slurry, and in the process creating added value for the
Contents
Abstract. ... .ii
Contents ... .iv
List of Tables ... v
List of Figures ... vi
List of Appendices ... ix
List of Equations ... x
CHAPTER
1.
2.
3.
2.1 2.2 2.3 2.4 2.5 2.6 2.7 3.1 GENERAL INTRODUCTION ...7
LITERATURE REVIEW ...
7
. Introducti on .. : ... , ... : ... 7
Uses of pine bark ... : ... 7
Pine bark characteristics ... 7
High nitrogen liquid wastes ... 7
Pine bark and nitrogen ... 7
Pine bark as a filter ... 7
Pine bark and compost ... 7
PRELIMINARY EXPERIMENTS .... , ...
7
Preliminary Experiment I: Absorption of nitrogen from a solution by 'pine bark over time as affected by nitrogen concentration ... 7
3.1.1 Introduction ... 7
3.1.2 Materials and methods ... 7
3.1.3 Results and discussion ... 7
3.2 Preliminary experiment II: Improving the precision of measurement of nitrogen absorption rate ... : ... 7
3.2.1 Introduction ... 7
3.2.2 Materials and methods ... 7
3.2.3 Results and discussion ... 7
3.3 Preliminary experiment III: Characterisation of the variation in nitrogen concentration during the first hour ... 7
3.3.1 Introduction ... 7
4.
5.
3.4 Preliminary experiment IV: Comparison of three different
shaking methods ... ' 7
3.4.1 Introduction ... 7
3.4.2 Materials and Methods ... 7
3.4.3 Results and discussion ... , 7
3.5 Preliminary experiment V: Inhibition of microbial growth in ammoniacal:.N samples by phenyl mercuric acetate ... ' 7
3.5.1 Introduction ... 7
3.5.2 Materials and Methods ... , 7
3.5.3 Results and discussion ... 7
3.6 Conclusions of preliminary experiments ... 7
WASTE CHARACTERISATIONS ...
7
4.1 Introduction ... 7
4.2 Materials ... : ... 7
4.2.1 The bark ... : ... 7
4.2.2 The slurries ... : ... 7
4.3 Materials and Methods ... 7
4.3.1 Bark particle size distribution and wood content. ... 7
4.3.2 Bulk density ... 7
4.3.3 Total pore space ... 7
4.3.4 Total carbon and nitrogen content ... ' 7
4.3.5 Moisture content ... 7
4.3.6 Total water holding capacity ... 7
4.3.7 Slurry pH ... 7
4.3.8 Total nitrogen and ammonium content of the dairy slurry 7 4.4 Results and discussion ... 7
5.1 5.2 4.4.1 Pine bark p~cle size distribution and wood content. 7 4.4.2 Pore space of the bark ... 7
4.4.3 Carbon and nitrogen content of the bark ... 7
4.4.4 Moisture content and water holding capacity of the bark 7 4.4.5 pH, total nitrogen and ammonium content of the slurry7 NITROGEN ABSORPTION AND EXTRACTION ...
7
Development of an ammonium extraction technique ... : ... 7
5.1.1 Introduction ... 7
5.1.2 Materials and Methods ... : ... 7
5.1.3 Results and discussion ... 7
Model for the absorption of nitrogen by pine bark ... 7
5.2.1 Introduction ... 7
5.2.2 Materials and Methods ... 7
5.2.3 Results and discussion ... 7
5.3 Long term absorption of nitrogen ... 7
5.3.1 Introduction ... 7
5.3.2 Materials and methods ... : .... 7
6.
THE NATURE OF NITROGEN ABSORPTION BY PINE BARK ..7
6.1 Biological and chemical absorption of nitrogen ... 7
6.1.1 Introduction ... 7
6.1.2 Materials and Methods ... 7
6.1.3 Results and discussion ... 7
6.2 The probable location of nitrogen absorption in pine bark as indicated by infra-red spectroscopic analysis ... 7
6.2.1 Introduction ... 7
6.2.2 Materials and methods ... 7
6.2.3 Results and discussion ... 7
7.
NITROGEN ABSORPTION FROM DAIRY SLURRy ...7
8.
9.
10.
11.
7.1 Absorption under laboratory conditions ... 77.1.1 Introduction ... 7
7.1.2 Materials and Methods ... 7
7.1.3 Results ... : ... 7
7.2 A pilot waste treatment program ... : ... 7
7.2.1 Introduction ... 7
7.2.2 Materials and Methods ... 7
7.2.3 Results and discussion ... 7
CONCLUSIONS ...
7
REFERENCES ...
7
ACKNOWLEDGMENTS ... 7
\
List of Tables
Table Page
3.1. ANOV A for prelininary experiment I.. ... 13
3.2~ ANOVA for Preliminary Experiment II ... 16
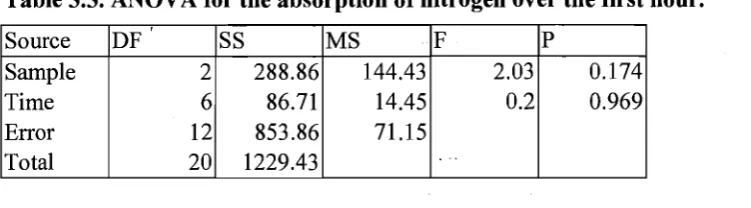
3.3. ANOVA for the absorption of nitrogen over the first hour. ... 20
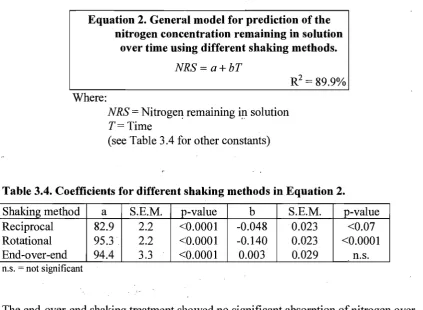
3.4. Coefficients for different shaking methods in Equation 2 ... 22
3.5. Comparison of ammonium analysis by Flow Injection Analyser in the presence and absence of phenyl mercuric acetate ... 24
4.1. Summary of pine bark and dairy slurry characteristics ... 29
5.1. Combinations of extractant volume and type, and duration of extraction ... 38
5.2. Covariate adjusted means for different extraction combinations ... : ... 40
5.3. Constants for the general predictive model given in Equation 4 ... 47
5.4. The significancels of effects and,interactions of concentration and time for each pH treatment. ... 48
5.5. The percentage recovery by different extractions of nitrogen absorbed at different pH ... 50
5.6. Percentage recovery of absorbed nitrogen after long term absorption ... 53
6.1. Treatment combinations and results of infra red analysis ... 59
6.2. Possible assignment of changes in infra-red spectra in the regions of ,
.
, 1740 and 1610 cm-I, based on Bellamy (1958) and Stevenson and Goh (1971) ... 6211.I.Buffer component volumes (mL) required to achieve a particular pH. ... 84
List of Figures
. .
Figure Page
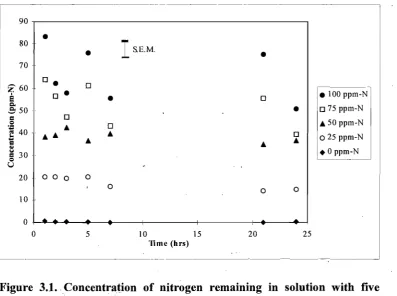
3.1. Concentration of nitrogen remammg m solution with five initial
concentrations ... 12
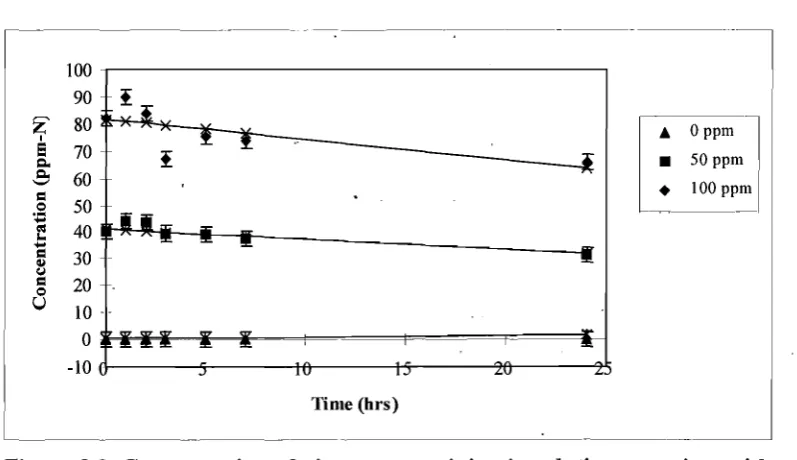
3.2. Concentration of nitrogen remaining in solution over time with three
initial nitrogen concentrations ... 15
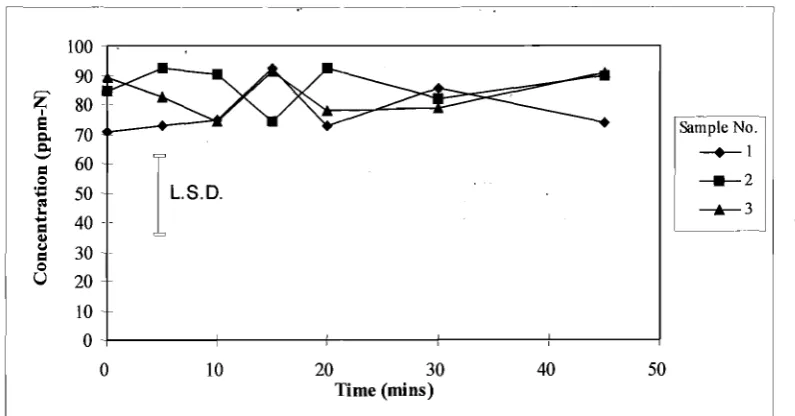
3.3. Concentration of nitrogen remaining in solution during the first hour ... 19
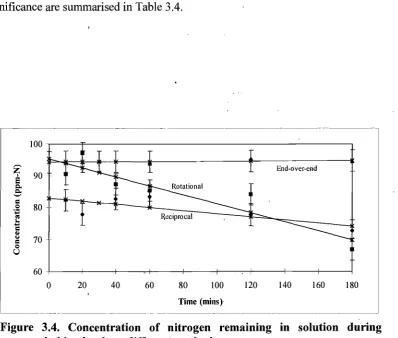
3.4. Concentration of nitrogen remaining in solution during shaking by three
different methods ... 21
4.1. Particle size distributions of bark and wood ... 30
.
.4.2. Relationship between carbon and nitrogen contents of pine bark. ... 31
5.1. Constant temperature cabinet and rotational shaker. ... 35
5.2. The sieve Hd design ... ~ ... 36
5.3. The percentage of nitrogen recovered using different combinations of
water and KCI extractant with extractant volumes of 250 mL
and 500 mL. (Each bar represents the mean of three replicates) ... 41
5.4. Nitrogen remaining in solution after shaking pine bark in nitrogen
solutions with different pH and initial nitrogen concentrations ... 46
5.5. Comparison of pH treatments ... 49
5.6. Concentration of nitrogen remaining in solution over three weeks ... 51
6.1. Concentration of nitrogen remaining in solution with sterilised and
unsterilised bark at pH 6 ... 56
6.2. Concentration of nitrogen remaining in solution with sterilised and
unsterilised bark at pH 8 ... 57
6.3. Infra-red reflectance spectra for coarse untreated bark, and for coarse
.
.sterilised and unsterilised bark treated with ammonia gas ... 60
6.4. Infra-red reflectance spectra for coarse untreated bark, and for coarse
bark treated with 1000 ppm-N ammonium sulphate at pH 6 and
Figure
6.5. Infra-red reflectance spectra for coarse untreated bark, and for sterilised
and unsterilised fine bark treated with 1000 ppm-N ammonium
Page
sulphate at pH 6 ... ~ ... 61
7.1. Concentration o,f nitrogen remaining in a dairy slurry over time in laboratory conditions ... 65
7.2. Schematic of the Petheram farm milking shed and surrounds ... 67
7.3. Sampling probe ... 68
List of Appendices
Appendix Page
A.
CHEMICALS AND EQUIPMENT USED ...83
List of Equations
Equation Page
1. Preliminary model for prediction of the nitrogen concentration remaining
in solution over time ... : ... 16
2. General model for prediction of the nitrogen concentration remaining in
solution over time using different shaking methods ... 22
-3. Relationship between measured absorption and corrected absorption ... 44
4. General model for prediction of the nitrogen concentration remaining in
solution over time from buffered ammonium sulphate solution
with different initial nitrogen concentrations ... 47
6. General model for prediction of the nitrogen concentration remaining in
solution over three weeks ... : ... 52
5. Simplified mode~ from Equation 4 for prediction of the nitrogen
concentration remaining in solution over time from a solution
of 100 ppm-N ammonium sulphate buffered at pH 6 ... 52
7. General model for prediction of the nitrogen concentration remaining in
solution over time from a dairy slurry over 24 hours ... 65
8. Curvilinear model for prediction of the total nitrogen concentration
remaining in solution over time from a dairy slurry ... 70
9. Linear model for prediction of total nitrogen concentration remaining in
CHAPTER
1.
GE.NERAL INTRODUCTION
Pine bark is becoming a waste problem in New Zealand, with only limited use as a
horticultural product., In areas of high timber production such as Nelson there is an
over supply of pine bark chips from de-barked logs, which is increasing with time as
-the timber industry in New Zealand expands.
Chemical characteristics of pine bark have not been studied in detail, and the potential
uses of pine bark have not been realised. This study was initiated to investigate the
potential of pine bark to absorb organic and ammoniacal-nitrogen, which could make
it suitable for use in many situations a's a biofilter. Once saturated with nitrogen, it is
proposed that the bark could be composted to form a stable product, useful in a
horticultural context.
Major research obj ectives of the present study were to examine:
1. The quantity of nitrogen that pine barkis able to absorb from
an ~queous solution,
2. Factors affecting the absorption of nitrogen from an aqueous
solution by pine bark,
3. The mechanism of nitrogen absorption from an aqueous
solution by pine bark, and
CHAPTER
2.
LITERATURE REVIEW
2.1
Introduction
Although a native of North America; the radiata pine has proven to be tremendously
successful in New Zealand, with an increasing domestic and export market being
developed for the timber in various forms and degte'es of processing. According to
the New Zealand Ministry of Forestry (Barton et al., 1993), the output of roundwood
in New Zealand (as at 31 March 1992) was approximately 14.4 million cubic meters.
Barton et al (1993) estimated that New Zealand will have a sustainable output of
timber in excess of 22 million cubic meters by the year 2003. With a growing trend
for export of debarked clear logs (Steel, pers. comm.), and taking into account the
conservative estimate that 10% of a pine tree is bark (Society of American Foresters,
1958), by the year 2003 there is going to be something in the order of 2.2 million
cubic meters of pine bark per year.
2.2
Uses of pine bark
I
Pine bark has been defined as "the tissues of the stem branch and root outside the
(vascular) cambium layer" (Society of American Foresters, 1958) which defines the
practical separation point when stripping bark from'
a
tree. Due to environmental andfinancial pressures, the industries involved in producing pine bark have had to develop
some way of using it. Waste bark is being burnt in special furnaces to provide heat for
industrial plants, a process which is limited by the high moisture content of fresh bark
(Harris and Nash, 1973). Pine bark has been used in a number of studies, with
, ,
Alspach and Burrows, 1985; Gislerod, 1985; Starck and Okruszko, 1984), or it can be
used for simple horticultural purposes such as mulching and beautification. A final
option is to dump it in a landfill area, a costly and wasteful exercise.
In regions of low timber production, such as Canterbury, the available bark is
_becoming a sought-after horticultural commodity. By contrast, Nelson has an
oversupply, with large quantities available but not utilised, because it is generally not
financially viable to transport it any significant distance. Further research to realise
the potential of pine bark is needed so as to change a potentially significant waste
.' .
problem into a product worthy of transport to the site of demand.
2.3
Pine bark characteristics
The physical properties of pine bark in general (not specifically Pinus radiata) have
been extensively studied (De Boodt and Verdonk, 1972; Bunt, 1974; Verdonk et aI.,
1974, 1985; Gislerod et aI., 1985), however there are distinct interspecies differences
in both the physical properties (Harris and Nash, 1973) and anatomy (Patel, 1973),
and detailed study of the physical properties and anatomy of New Zealand grown
radiata has not been reported in the literature.
Detailed study of the chemical characteristics of Pinus radiata bark, which are
complex and variable, has not been reported either (Porter, 1973), and this lack of
knowledge is a major barrier to the efficient use of this resource. Of the general
. , .
• There is a high carbon to nitrogen ratio in fresh bark (Zucconi et aI., 1985; Solbraa, 1986)
leading to nitrogen immobilisation as the bark decays in a growth media or soil.
• Agents such as manganese, resins, turpentine and tannins have been found in bark
and identified as phytotoxins. The general effects have been studied, although little
detail has been established (Bunt, 1976; Starck and Okruszko, 1984; Smith, 1986).
-. Raw pine bark has a high cation exchange capacity (Roberts and Smith, 1988)
allowing it to absorb a wide variety of cations used by plants.
• The wide variation of physical and anatomical properties, and chemical content
makes it difficult to predict harvesting volumes, and difficult to design reliable
processes which utilise pine bark. .
Some empirical observations on the chemical characteristics of pine bark have been
made. Aged bark was found to have a lower carbon to nitrogen ratio than fresh bark
(Cobb and Keever, 1984). Urea amendment has been shown to produce greater plant
biomass than a limestone ammonium nitrate or calcium nitrate amendment when used
as a pre-enrichment of bark for growing cabbage seedlings (Wright and Smith, 1989).
These observations and others of a similar nature suggest that different nitrogen forms
react with bark in different ways. Studies to provide an understanding of how
nitrogen reacts with pine bark have not been conducted.
The types of chemicals which m~y be chemically ext~acted have been studied. Porter
(1973) gives a brief summary, but there is little indication of where these chemicals
2.4
High nitrogen liquid wastes
Liquid wastes with a high nitrogen content, until recent times, have frequently been
disposed of in waterways. These waterways have often been incapable of absorbing
the high nitrogen content and high biological oxygen demand (BOD) inherent in these
wastes, without detrimental effect on the biota. Recent changes in legislation and
public perspective have placed a greater responsibility on the producers of such wastes
_ f
to find alternative disposal methods.
2.5
Pine bark and nitrogen
High nitrogen liquid wastes contain organic nitrogen, ammonia, nitrates, and nitrites.
The pH of the liquid has an effect on the fOlm of these species, particularly
ammoniacal-No At low pH ammoniacal-N IS present mostly in the form of
ammonium (N14 +), and at higher pH ammoma (NH3) becomes more prominant
(Haynes and Sherlock, 1986).
Anhydrous ammonia ,has been used as a fertiliser in the United States for some time
(He et al., 1990), and as a nitrogen amendment for pine bark (Bollen, 1969; Lloyd,
1977; Aaron,_ 1982; Foster et al., 1983). Although ammonium is not generally
reactive, microbes are capable of absorbing it in this form, whereas ammonia is more
likely to be chemically fixed (He et al., 1990). Mortland (1958) suggests that "NH3
will react with carboxyl, phenol, aldehyde, ketone and alcohol groups to form amines,
amides, and imides of various kinds, which suggests the possibility of a variety of
Studies such as an unpublished report from the Forest Research Institute (Lloyd, 1977)
and several others (Bollen, 1969; Solbraa, 1979a, D, c, d; Aaron, 1982; Foster et aI.,
1983; Guedes-de-Carvalho et aI., 1991), indicate that pine bark can permanently
absorb large quantities of ammonia. High numbers of cation exchange sites in soil
have been shown to reduce the concentration of ammonium ions in the aqueous phase
.within the soil (Wild, 1988), and c~tion exchaI?-ge sites in pine bark are likely to
perform the same function. Functional groups, such as polyphenols (Bollen, 1969)
and carboxyls (Wild, 1988) present in pine bark
will
react with ammonium ions. Ithas been suggested that the presence of tannins in the soil increase a plants demand
for ammonium and nitrate (Koch and Oelsner, 1916), and Lloyd (1977) 'suggested that
ammonia absorbed by pine bark is permanently b()nded to the flavenoid carbonyl
groups in the tannins.
2.6
Pine bark
as a
filter
Pine bark is very porous, has low water retention in growth media (Odneal and Kaps,
1990), and shows strong non-coherel1ce and resil~ence (Aaron, 1982), making it ideal
as a filtering medium.
Pine bark has been used in several environmental studies to remove ammonia from the
waste air stream of piggeries with high levels of efficiency (Van Langenhove et aI.,
1988; Zeisig, 1988; Van Asseldonk and Voermans, 1989; Van de Sande-Schellekens
. .
and Backus, 1993). Moisture was added in each case to provide an interface between
the bark and the gases. When bark is used as a litter for animals, it shows evidence of
ability of pine bark to absorb organic and ammoniacal-nitrogen from a liquid has not
been studied.
2.7
Pine bark and compost
As an anthropogenic process, composting can be defined as "a complex aggregation of
natural microbial and chemical degradations under controlled conditions, to
concentrate and maximise these processes for the benefit of mankind" (Hoitink and
Poole, 1980; Guedes-de-Carvalho et aI., 1991). Although there is a degree of
artificiality in a compost heap, as evidenced by the manufacture of heat by microbes to
.
..
the point where some species are killed off (Kitto, 1988), enhanced composting of
pine bark with nitrogen (and other nutrients) is readily accepted as a natural method of
redressing the nitroge~ imbalance in fi'esh pine bark destined for growth media.
When decomposing a substrate with a high C:N ratio, such as pine bark, microbes
require a source of nitrogen (Starck and Oswiecimski, 1985). Microbial biomass
provides a slow release of a more complete range of nutrients into the growth medium
than can be provided in an inorganic fertiliser (Ostalski, 1976; Kitto, 1988).
Fresh pme bark shows strong evidence of phytotoxin pathogenicity, such as
suppression of Phytophthora rot (Orlikowski and Wojdyla, 1988; Zajicek and
Heilman, 1991; Boehm and Hoitihk, 1992) and suppression of fungus gnat emergence
(Lindquist et aI., 1985). Although fresh bark shows natural phytotoxicity towards
(composted) bark is noted as both Rhizoctonia and Fusarium suppressive (Pera and
Calvet, 1989; Deulofeu and Aguila-Vila, 1984).
Pine bark provides a good structural base for a compost or growth medium (Marfa et
aI., 1986; Milbocker, 1991), due to its porosity and low density, as well as the
.nutritional value (Golueke, 1982), suggesting that composting could be an effective
treatment for pine bark which had been used to absorb nitrogen (in any form),
CHAPTER
3.
PRELIMINARY EXPERIMENTS
3.1
Preliminary Experiment I:
Absorption of nitrogen from a
solution by pine bark over time as affected by nitrogen
concentration
3.1.1 Introduction
-Although ammoniation of pine bark has been reported (Bollen, 1969; Lloyd, 1977;
Aaron, 1982; Foster et aI., 1983), absorption of nitrogen from a liquid by pine bark
has not been studied in detail, and proven methodology was unavailable. Analytical
methods for soil have been shown to be inappropriate for lightweight growth media,
including bark based mixes, due to the very .different chemical and physical
characteristics (Bunt, 1986). The analytical methods routinely used by the Soil
Science Department at Lincoln University were therefore used only as a starting point
for developing the methodology for this study.
These preliminary experiments were necessary to focus on and attempt to characterise
the period of time during which significant nitrogen absorption occurs, and on the
effects of nitrogen concentration and shaking method on nitrogen absorption rate.
Keeping the main research objectives in mind (page 1), experiments were designed
around the principle of approximating a batch filtration system, by shaking a bark
sample in an imitation waste liquid. Continued development of the methodology
The main aim of this experimeni was to provide a broad indication of the rates of
absorption of ammonium from a solution by pIne bark over time, as affected by
nitrogen concentration. Seven sampling intervals (1, 2, 3, 5, 7, 21, 24 hours) and five
concentrations (0, 25, 50, 75, 100 ppm ammoniacal-N) were examined in a factorial
design.
-3.1.2 Materials and methods
3.1.2.1 Materials
The materials and laboratory equipment commonly used throughout this study are
listed in Appendix A.
3.1.2.2 Reaction vessels
Corked 250 mL conical flasks were used as reaction vessels. Each flask contained
25 g of bark and 100 mL of ammoniwn sulphate solution at one of five concentrations
(0,25,50, 75 and 100 ppm-N), buffered at pH 6 (Appendix B). A separate flask was
used for each of the seven sampling in1ervals and five concentrations, making a total
of 35 flasks.
The buffer pH of 6 was chosen for these first experiments to represent the pH of a
dairy slurry as measured in a sample taken from the first sump on Darryl Petheram's
farm, Days Road, Springston, Canterbury.
3.1.2.3 Methods
A rotational shaker table was used to provide agitation to the reaction vessels at
Sampling involved removing the appropriate flask from the shaker and filtering the
.
.
.liquid with Whatman No. 4 filter paper into a 100 mL plastic sample bottle. The
bottle was then stored at 4°C until analysis using the Flow Injection Analyser. It was
assumed that the acidic nature of the solution (PH 6) would have prevented any ,
volatilisation of ammonia during sampling and storage (Haynes and Sherlock, 1986).
Results were expressed as concentration of nitrogen remaining in solution
3.1.2.4 Statistical analysis
ANOVA for the data was calculated with Minitab software, with time and measured
initial concentration as factors. The coefficient of variation (CV%) of ~ll the samples
was calculated as a measure of the overall variation present in the experiment.
The Flow Injection Analyser is known to have an inherent error of approximately ±5%
.
.
(McCloy, pers. comm.), which was taken into account when interpreting data analysis.
3.1.3 Results and discussion
3.1.3.1 Absorption of nitrogen from solution
The data obtained (Figure 3.1) show that the concentration of nitrogen in the
ammonium sulphate solution was reduced over time in each concentration treatment
except the zero initial concentration, indicating that nitrogen was absorbed by the pine
-90
•
80
I
S.E.M.
•
•
70
~ 60
D .
0
e o •
•
0 .100 ppm-Nc.
-950
•
075 ppm-N=
0.50 ppm-N Q
0 '-; 40 ...
•
••
•
0 025 ppm-N...
•
•
=
•
..
1$ 30 . 0 ppm-N
Q
U
20 0 0 0 0 0
0 0
10
0
...
....0 5 10 15 20 25
lime (hrs)
Figure 3.1.. Concentration of nitrogen remaining in solution with five initial concentrations.
3.1. 3.2 High overall variation
The high variation within concentration treatments, as evidenced by a CV = 17.5%,
made it inappropriate to fit a predictive model to the data. It is possible that the high
" . .
variation was caused ,in part by the use of a different bark sample for each sampling
interval.
3.1.3.3 Effect of nitrogen concentration
Despite the variability found in the small bark samples, the results of the ANOV A
(Table 3.1) showed that there was a significant difference between concentration
treatments. The rate of nitrogen absorption was shown to be proportional to the initial
concentration, as in many biological ,systems, a1l9wing a reduction in the number of
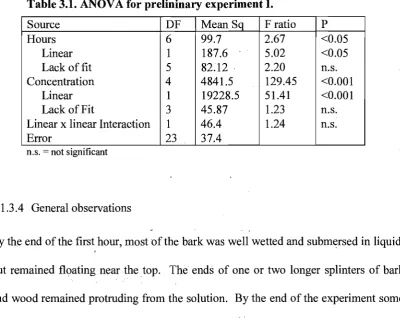
Table 3.1. ANOV A for prelininary experiment I.
Source DF Mean Sq F ratio P
Hours 6 99.7 2.67 <0.05
Linear 1 187.6 5.02 <0.05
Lack of fit 5 82.12 . 2.20 n.s. Concentration 4 4841.5 129.45 <0.001
Linear 1 19228.5 51.41 <0.001 Lack of Fit 3 45.87 1.23 n.s. Linear x linear Interaction 1 46.4 1.24 n.s.
Error 23 37.4
n.s. = not significant
3.1.3.4 General observations
By the end of the first hour, most of the bark was well wetted and
.
subm~rsed in liquid,but remained floating near the top. The ends of one or two longer splinters of bark . .
and wood remained protruding from the solution. By the end of the experiment some
splinters remained partially above the level of the liquid, but the remaining bark was
stratified relatively evenly from top to bottom of the flask.
Over the period of soaking, there was
!l
slight dissolution of organic matter into thesolution, giving it a yellowish-brown tinge, but this was not considered sufficient to
affect the results of ammonium analysis (McCloy, pers. comm.).
3.2
Preliminary experiment II:
Improving the precision of
measurement of nitrogen absorption rate.
3.2.1 Introduction
3.2.2 Materials and methods
3.2.2.1 Reaction vessels
The bark sample size 'was increased to 50 g with 500 mL of liquid, and 600 mL plastic
jars were used as reaction vessels. The reaction vessels were shaken briefly by hand
so as to thoroughly wet the bark before being placed on the rotational shaker table.
3.2.2.2 Ammonium solutions
Three concentration treatments were used (0, 50 and 100 ppm-N) as suggested in
Section 3.1.3.3, each with three replicates, all buffered at pH 6 (Appendix B). Time
zero (initial) concentrations were measured on samples taken before the solution was
added to the bark.
3.2.2.3 Sampling pro,cedure
At each sampling interval the jars were removed from the shaker table and given a
brief vigorous shake by hand to remove any concentration gradients. A 10 mL aliquot
of each solution was removed by 15. mL disposable syringe and injected into a
scintillation vial through Whatman No.4 filter paper. Immediately following removal
of the sample, each jar was re-capped and replaced on the shaker. The vials were
stored at 4°C until analysis by the Flow Injection Analyser.
Although sampling by removal of solution reduced the ratio of liquid to bark by 2.4%
it was assumed that the absorption rate in the reaction vessels was unaffected by
,
3.2.2.4 Statistical analysis
The data were analysed under a General Linear Model (GLM) with time as a
covariate. The S.E.M. and CV% were calculated from the ANOVA of this model.
3.2.3 Results and discussion
3.2.3.1 Absorption of ammonium I
The results obtained (Figure 3.2) showed a reduction in the variability within
concentration treatments as compared to Section 0, and a reduction in nitrogen
concentration over time, indicating that there was- absorption of nitrogen by the pine
bark over time. Approximately 25% of the initially available nitrogen was absorbed
. . ~ .
after 24 hours in each concentration treatment.
- - - - --- - - ,
100 90 !:
Z
80 AOppm
~:
I 5 70
-!:
•
50 ppmQ. Q.
60
' - '
•
100 ppm=
0 50
;:
E 40
...
=
30
-III
(,.J
=
200
U 10
--0
-10
Time (hrs)
There was a reduction in the experimental variation, as evidenced by a CV of 11.13 %,
which is a decrease of 35% from the previous experiment (Section 0). The only thing
that was changed from the previous experiment is the use of repeated sampling on a
bark sample, instead of multiple samples of bark over time, thus the reduction of error
may be attributed largely to this change. The variation in the ability of individual bark
_samples to absorb nitrogen, which can now be seen to be significant in samples of this
size, has not been documented in the literature.
The slopes of the fitted model are significantly different with (Table 3.2), and
proportional to (Equation 1), nitrogen concentration. Because of the variation found
in the previous experiment (SeCtion 0) it was not appropriate to statistically compare
the rate of nitrogen absorption found in Section 3.1.3.1 with the rate of absorption
found in this experiment, but visual comparison showed no apparent difference in
slopes.
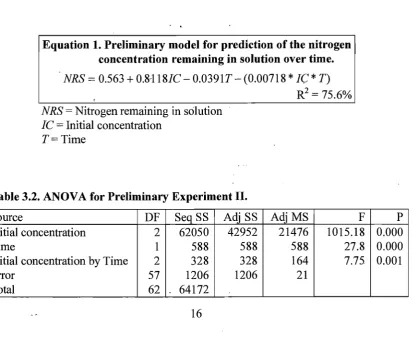
Equation 1. Preliminary model for prediction of the nitrogen concentration remaining in solution over time.
NRS
=
0.563 + 0.R118IC - 0.0391T - (0.00718*
Ie*
T)NRS = Nitrogen remaining in solution IC = Initial concentration
T=Time
Table 3.2. ANOV A for Preliminary Experiment II.
Source DF Seq SS Adj SS
Initial concentration 2 62050 42952
Time 1 588 588
Initial concentration by Time 2 328 328
Error 57 1206 1206
Total 62 64172
R2 = 75.6%
AdjMS F
21476 1015.18 588 27.8 164 7.75
21
As expected the results confirmed that there was no measured activity where the
initial nitrogen concentration in the solution was zero. This confirms that there was
no significant soluble ammoniacal-nitrogen present in the bark.
3.2.3.2 Sources of variation
Concentrations of 81.2 and 42.1 ppm-N remaining in solution were predicted at time
zero for measured initial concentrations of 100 and 50 ppm-N respectively. Four
potential sources of variation needing further investigation were identified:
1. By shaking the reaction vessel to remove any concentration gradient before
. ..
sampling, it is likely that a part of the air remaining in the pores of the ~ark would be
dislodged, thus. increasing. the. surface area of bark available for contact with the
liquid. Because the shaking was by hand, and of no defined period or force, each bark
,
sample would have had a different amount of air dislodged from its pore space.
2. Because of the large crystals and small quantities of solid ammonium
sulphate, and because the liquid quantities were quantified by measuring cylinder, it is
likely that there was variation in the initial concentration of the nitrogen solutions.
This error would be reduced by making one large quantity of buffered ammonium
sulphate solution in a volumetric flask, and then dividing it into sample volumes.
3. The variability between bark samples may cause different initial rates of
water absorption. The wide variation in bark physical properties (Harris and Nash,
1973), including pore size and quantity, and the surface area available (dependent on
the proportions of different particle sizes) would effect the speed at which the bark is
4. There may have been errors in the analytical method, such as inherent error
in the Flow Injection Analyser, or loss of ammonia during storage of samples by
microbial activity.
3.2.3.3 General observations
Some difficulty was experienced in expelling samples from the 10 mL syringes due to
small bark particles becoming trapped in the nozzle of the syringe.
3.3
Preliminary experiment III: Characterisation of the variation
in nitrogen concentration during the first hour
3.3.1 Introduction
The aim of this experiment was to characterise the variation in nitrogen concentration
during the first hour of contact,as noted in Section 3.2.3.1.
3.3.2 Materials and Methods
3.3.2.1 Nitrogen concentration "
Having confirmed in, Section 3.2.3.] that there was a linear relationship between
initial nitrogen concentration and the rate of nitrogen absorption, a single
concentration was used to characterise the response over the first hour. To this end a
solution containing 100 ppm-N ammonium sulphate and buffered at pH 6 (Appendix.
A) was used with nine replicates. Bark sample sizes and reaction vessels remained the
same as in Section 3.2.2.1.
3.3.2.2 Sampling method
In order to make the sampling interval more accurate, starting times for each vessel
Section 3.2.2.3, except that only one sample was taken at a time due to the staggered
start, and that a Terumo 25 mL syringe with a wider nozzle was used.
3.3.2.3 Statistical Analysis
ANOVA for the data was calculated with Minitab software, from which the S.E.M.
and the CV% were calculated.
3.3.3 Results and discussion
,
3.3.3.1 Nitrogen concentrations
Results obtained (Figure 3.3) show high overall variation, with no absorption of
nitrogen, There was no significant effect of time on nitrogen absorption (Table 3.3),
indicating that there was no absorption of nitrogen during the 45 minutes examined.
Clearly the first hour of exposure of pine bark to the ammoniacal-nitrogen solution is
characterised by variation in nitrogen levels. The experimental error (CV
=
13.08%)was similar to that found in the previous experiment, indicating that the method used
. .
to make up the ammonium sulphate sol~tions did not contribute to the observed error.
100 90
Z I
e
70 c.. c.. ' - ' 60=
0+= 50
E
.... 40
--=
Qj <.J 30=
0U 20
10 0
Table 3.3. ANOV A for th~ absorption of nitrogen over the first hour.
,
Source DF SS MS F P
Sample 2 288.86 144.43 2.03 0.174
Time 6 86.71 14.45 0.2 0.969
Error 12 853.86 71.15
Total 20 1229.43 ..
As with the previous experiment (Section 3.2.3.1), the initial nitrogen concentration as
measured by the Flow Injection Analyser is lower than expected. These values were
once again obtained without exposure of the solution to the pine bark, so the only
explanations for this variation remaining from Section 3.2.3.2 are;
1. There may have been errors in the analytical method, such as inherent error in the
Flow Injection Analyser, or loss of ammonia in samples by microbial activity
during storage.
2. The high variation between bark samples.
3.4
Preliminary experiment IV: Comparison of three different
shaking methods
3.4.1 Introduction
The main aim of this experiment was to examine the absorption of nitrogen from
a
liquid by pine bark using three differeilt methods of shaking.
3.4.2 Materials and Methods
The three shaking methods studied were rotational, reciprocal and end-over-end
shaking. An aqueous solution of nitrogen at 100 ppm-N and a pH of 6 (Appendix A)
was used under conditions as described previously (Section Error! Reference source
not found.) with the shaking method as the only variable. Each shaking method
3.4.2.1 Statistical Analysis
Sequential regressions in Minitab were used to 'fit a linear model to each method.
Significant differences between the linear models were determined by comparing the
error terms from the ANOV A on the linear models.
3.4.3 Results and discussion
3.4.3.1 Comparison of shaking methods
The data (Figure 3.4) clearly showed different rates of nitrogen absorption by the three
methods, with the end~over-end shaker showing less nitrogen absorption than the
reciprocal method, which showed less nitrogen absorption than the rotational shaking
. .
method. The error bars represent the S'.E.M. of the experiment (3.39), and the labelled
lines represent the fitted model (Equation 2), for which the coefficients and their
significance are summarised in Table 3.4.
100
Z End-over-end
I 90
E!
r:I. r:I.
' - '
=
0 80;::
R~ciprocal
~
1-....
=
4> OJ70
=
0U
60
Equation 2. General model for prediction of the nitrogen concentration remaining in solution
over time using different shaking methods.
Where:
NRS= a+bT
NRS
=
Nitroge~ remaining ip. solutionT=Time
(see Table 3.4 for other constants)
R2
=
89.9%Table 3.4. Coefficients for different shaking methods in Equation 2.
Shaking method a S.E.M. p-value b S.E.M. p-value Reciprocal 82.9 2.2 <0.0001 -0.048 0.023 <0.07 Rotational 95.3 2.2 <0.0001 -0.140 0.023 <0.0001 End-over-end 94.4 3.3 <0.0001 0.003 0.029 n.s.
n.s. = not significant
The end-over-end shaking treatment showed no significant absorption of nitrogen over
time (Table 3.4). The reciprocal and rotational shaking treatments showed linear
trends, although the fit of the model to the reciprocal shaking treatment was not quite
significant at 5%. Because the rotational shaking treatment showed the most nitrogen
absorption, and because the logistics with the reciprocal and end-over-end methods
were complicated with increased turbidity inhibiting the filtering process, the. ,
f
3.5
Preliminary experiment V: Inhibition of microbial growth in
ammoniacal-N samples by phenyl mercuric acetate
3.5.1 Introduction
Phenyl mercuric acetate (PMA) at a concentration of 50 ppm has been shown to
inhibit growth of bacteria and fungi in aqueous mineral-nitrogen solutions (Bremner,
1965). The main aim of this experiment was to determine the degree of interference
of PM A in the analysis for ammonium nitrogen by the Flow Injection Analyser.
3.5.2 Materials and Methods
3.5.2.1 Phenyl mercuric acetate solution
A solution of PMA was made by dissolving 1 g of PMA in 1 L of nano-pure water
(Appendix A), which was nearly a saturated solution. Dilution of a 20 mL sample
with 1 mL of this PMA solution would result in a concentration of 50 ppm PMA in
the sample (Bremner, 1965).
3.5.2.2 Ammonium solution
Twelve samples, each containing 20 mL of ammonium sulphate solution, were made
up at 100 ppm-N in a phosphate buffer at pH 6.
3.5.2.3 Addition of phenyl mercUric acetate
Each of six 20 mL sample was diluted with 1 mL of PMA solution, achieving a PMA
concentration of 50 ppm. Samples were refrigerated at approximately 4°C for a period
3.5.2.4 Analysis
All samples were diluted and analysed for NH4-N by Flow Injection Analyser. An
unpaired t-test was used to look for significant differences.
3.5.3 Results and discussion
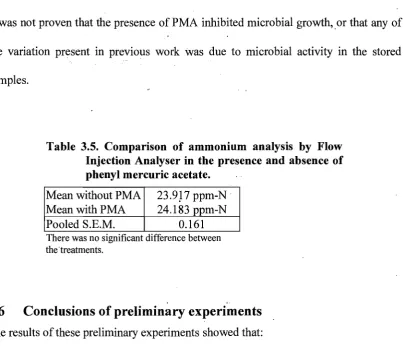
The data (Table 3.5) showed no significant difference between PMA treated and
untreated samples. It was therefore concluded that PMA has no effect on analysis for
NH4-N by the Flow Injection Analyser.
It was not proven that the presence of PMA inhibited microbial growth,.or that any of
the variation present in previous work was due to microbial activity in the stored
samples.
Table 3.5. Comparison of ammonium analysis by Flow Injection Analyser in the presence and absence of phenyl mercuric acetate.
Mean without PMA 23.9J 7 ppm-N " Mean with PMA 24.183 ppm-N Pooled S.E.M. 0.161
There was no significant difference between the -treatments.
. ,
3.6
Conclusions of preliminary experiments
The results of these preliminary experiments showed that:
1. The initial quantity of nitrogen" present in the liquid produced a significant effect on
nitrogen absorption by pine bark, as in many biologicak systems.
3. Fluctuations in measured nitrogen concentrations during initial exposure of pine
bark to a liquid containing nitrogen were unavoidable, and caused by either
analytical error or variation in the bark samples.
4. Rotational shaking was the most appropriate method available to maxImIse
nitrogen absorption from a liquid .
.5.
The presence of phenyl mercuric acetate (PMA) at a concentration of 50 ppm did , not significantly affect the ammonium analysis by Flow Injection Analyser. It wasassumed that PMA was suitable for the inhibition of microbial growth in samples
CHAPTER
4.
WASTE CHARACTERISATIONS
4.1
Introduction
In order to provide a reference point for comparison of other situations to this research
it was essential that the bark and the slurries used in the present study were
characterised.
4.2
Materials
4.2.1 The bark
All the bark used in the present laboratory studies came from the one source, the
Hornby Garden Market in Shands Road, Christchurch in March 1995. As far as it was
possible to determine, the bark was all of the same type (Pinus radiata). The market
receives fresh bark supplies daily, and screens the bark to a maximum chip size of
500mm on site. The bark was spread on a large plastic tray to air dry at room
temperature for at least two weeks before use.
The following- measurements (Section Error! Reference source not found.) were
taken on 50 g sample's and adequately describe the general characteristics of the bark
supplied. The variation inherent in pine bark has been described in Section 2.3.
4.2.2 The slurries
Five 600 mL samples of dairy slurry were taken from the outlet pipe of the first
4.3
Materials and Methods
4.3.1 Bark particle, size distribution and wood content
Three 50 g bark samples were sieved into a range of particle sizes. The fractions were
then visually separated into wood and bark fractions (with the exception of the < 1.4
rnrn fraction, due to the visual similarity) and weighed.
4.3.2 Bulk density
Bulk density of a soil sample is usually calculated using a 1 L measuring cylinder
(Joiner and Conover, 1965; Goh and Haynes, 1977), but the large particle size of the
bark chips meant that a larger volume was necessary. A 2 L measuring cylinder was
filled with air-dry bark, tapping firmly during addition to compact the mix, and the
weight of bark recordyd.
Oven dry bark was not used due to the fact that the particles are crisped by the drying
process, which would effect the compaction characteristics. The moisture content of
the air dry bark used (14.0%) was calcul.ated in Section 4.3.5.
4.3.3 Total pore space
Because pine bark chips have no cohesion, it was not appropriate to use the water
tension table method as for a soil core. The sample of bark used in Section 4.3.2 was
soaked in water for 48 hours and weighed. The bark in the cylinder was then drained
overnight and reweighed, representing the free draining pore space. The cylinder and
contents were then dried at 105°C for 24 hours and reweighed, giving the total pore
4.3.4 Total carbon and nitrogen content
Six 50 g air-dry samples of bark were oven dried, finely ground, subsampled six times
and analysed for total carbon and nitrogen on a Leco Elemental Analyser furnace
(Appendix A).
4.3.5 Moisture content
Six 50 g samples of air-dried bark were weighed out and dried for 24 hours in an oven
at 105°C, before reweighing. The difference in weight was taken as the moisture
content of the air-dried sample.
4.3.6 Total water holding capacity
Six 100 g samples of air-dried bark were accurately weighed and placed in tins, which
had holes drilled in the bottom and Whatman NO.,4 filter paper placed over the holes.
The tins were then placed in a deep tray, and water was added. To keep the bark
below the surface alL beaker, which fitted neatly inside the tin, was placed on top of
each sample. Water was added to leave all the bark below water level, and the
samples were left to soak for 24 hours, .
, .
The tins were then removed gently from the water bath and placed on a rack to drain
for one hour, after which they were weighed and placed in an oven at 105°C for 24
hours, and re-weighed. The total water holding capacity was taken as the quantity of
water lost during oven drying.
4.3.7 Slurry pH
4.3.8 Total nitrogen and ammonium content of the dairy slurry
Four 20 mL sub-samples were taken from each sample of slurry, two for total nitrogen
analysis by the Kjeltech auto analyser (Appendix A), and two for ammoniacal-nitrogen
analysis by Flow Injection Analyser (Appendix A).
4.4
Results and discussion
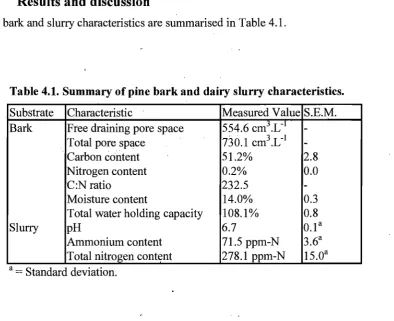
The bark and slurry characteristics are summarised in Table 4.1.
Table 4.1. Summary of pine bark and dairy slurry characteristics.
Substrate Characteristic Measured Value S.E.M. Bark Free draining pore space 554.6 cm3.L-1
-Total pore space 730.1 cm .L-. 3 1
-Carbon cmltent 51.2% 2.8
Nitrogen content 0.2% 0.0
C:N ratio 232.5
-Moisture content 14.0% 0.3 Total water holding capacity 108.1% 0.8
Slurry pH 6.7 O.1a
Ammonium content 71.5 ppm-N 3.6a Total nitrogen content 278.1 ppm-N 15.0a
a = Standard deviation.
4.4.1 Pine bark particle size distribution and wood content
The particle size distribution of wood and bark fractions is shown in Figure 4.1. A
wide range of particle sizes is apparent, although the distribution is skewed towards
the larger particle sizes. The smaller particle sizes are present in sufficient quantity to
offer a large surface area and therefore must not be discounted. It can be seen that the
40 35
~
30
.2;0
..
~ 25
;.,
..Q
..
20
CJl
S
= 15
..
.-..
10..
~
5 0
2 3 4 5 6 7 8
Particle size grouping
- - - ---
-Particle size groupings:
1 = < 0.500 mm 4 = 2.8 - 5.59 2 = 0.500 - 1.39 mm 5 = 5.6 - 7.99 mm
3 = 1.4 - 2.79 mm 6 = 8.0 - 1'2.69 mm
7 = 12.7 - 19.0 mm
8 => 19.0 mm
Figure 4.1. Particle size distributions of bark and wood.
Because of thediffiyulty in picking up the finer particles to get a representative
sample of bark, it was decided to separate the supply of bark into coarse (>5.6 mm)
and fine fractions by sieving. All samples in subsequent work were taken by adding
separate quantities of the two fractions in a ratio of 17.9: 1, as shown in Figure 4.1.
4.4.2 Pore space of the bark
The pore space measurements do not have an S.E.M. because only one sample was
examined.
4.4.3 Carbon and nitrogen content of the bark
The carbon content of the bark (51.2%) was similar to that found by Bollen (1969) of
53.97%, although the nitrogen content (0.2%) is approximately twice the content
found by Bollen (0.11 %). This may be due to differing ages of the pine bark samples
but with no consistent pattern (Figure 4.2), reflecting the wide variation inherent in
Pine bark (Harris and Nash, 1973).
"
"
-0.30
,-, 0.25
•
';;;R
..
•
'-" ....
•
=
~ 0.20 ....
=
0
•
••
"
Z
0.l5
-0,10
48 49 50 51 52 53
C content (% )
~---~-~----.-,---, ,
Figure 4.2. Relationship between carbon and nitrogen contents of pine bark.
4.4.4 Moisture con~ent and water holding capacity of the bark
The moisture content (14.0%) had low variability, showing consistency. The water
holding capacity ofl08.l % was similar to that found by Bunt (1974).
4.4.5 pH, total nitrogen and ammonium content of the slurry
The pH of the dairy slurry was 6.7, which was very different to' the pH of a sample
taken on the neighbouring Lincoln University Dairy Unit, which had a pH of 7.5
(Muller, pers. comm.). The total nitrogen and ammonium contents of this slurry
(278.1 and 71.5 ppm-N respectively) were also very different from the sample taken
by Muller (448.8 and 33.3 ppm-N respectively). The most likely explanation for this
same time and from the same point in the discharge programme. A different farm and
discharge program may be expected to yield different results.
The age of the slurry has also been shown to affect the forms of nitrogen present in a
.
.
dairy slurry (Haynes and Williams, 1993). Fresh slurry contains a high proportion of
prea, which over time is converted to ammoniacal-nitrogen, and then to
mineral-nitrogen. It is possible that the slurry examined in the present study was of a different ,
CHAPTER
5.
NITROGEN ABSORPTION AND
EXTRACTION
5.1
Development of an ammonium extraction technique
5.1.1 Introduction
When pine bark absorbs organic and mineral nitrogen from an aqueous solution, a
range of different bonds are formed between the bark and the nitrogen, from covalent
bonding with functional groups and molecules in the bark structure (Lloyd, 1977), to
loosely associated aqueous nitrogen within the pore spaces of the bark. Thus it is
possible to separate the less firmly bonded (or "readily available") nitrogen from the
"firmly bonded" nitrogen.
Measurement of the nitrogen remaining in solution before and after exposure to a bark
sample allows the quantity of nitrogen flbsorbed to be calculated, and analysis of the
bark by the Leco Elemental Analyser (Appendix A) will give the total nitrogen
content. The quantity of nitrogen which is readily available to plants is quite different
to the total nitrogen present in a growth medium. Although pine bark chips are widely
used in growth media' and composts in commercial nurseries, there is no test currently
The aim of this experiment was to develop an extraction technique for estimating the
"readily available" and the "firmly bonded" fractions of absorbed nitrogen in pine
bark.
5.1.2 Materia1s and Methods
5.1.2.1 Absorption of aqueous nitrogen
To provide a consistent quantity of absorbed nitrogen available for extraction, 50 g
pine bark was shaken in 500 mL of buffered (PH 6) ammonium sulphate (lOa ppm-N)
for 24 hours (Appendix B). The quantity of nitrogen remaining in the solution was
then determined, and the difference between this amount and the initial quantity of . .
nitrogen in the solution was used as an estimate of the quantity of nitrogen absorbed
by the pine bark.
5.1.2.2 Constant temperature
To keep the temperature constant around the reaction vessels during the absorption of
nitrogen, a cabinet was designed and built by Rob McPherson of the Lincoln
University Soil Science Department (Figure 5.1). The cabinet consisted of a carpet
lined cupboard- (dimensions: 80 cm wide, 70 cm high, 50 cm deep), with a fan unit in
the top left side of the roof attached to a thermostat to maintain an upper limit on the
internal temperature range. A second fan was left constantly running to circulate the
air inside the cabinet, and was placed next to a light bulb connected to a second
Figure 5.1. Constant temperature cabinet and rotational shaker.
The internal and external temperatures of the cabinet v"ere monitored with a TinyTalk
data monitor during rour absorrtion periods to establish the range of temperatures
encountered inside and outside the cahinet.
5,1.2.3 Separation or bark and liquid
Sequential extraction requires that the solid (pine bark) be separated from the
extractant rcady for subscquent extractions. Because or the wide range of particle
sizes in bark. no single method of separation was appropriate. The very fine bark
particles blocked filter papcr very quickly. even with the use of a Buckner funnel
under vacuum. thus suggesting that centrifugation was necessary as an alternative.
The larger bark particles had to be removed first. and several methods of sieving were
tested. including various combinatiolls of metal and cloth mesh. until the sieve lid
(Figure 5.2) was developed. This method allowed rapid attachment of the sieve for
Figure 5.2. The sieve lid design.
Three sieve lids were made, due to thl' fact that only three bark sampks could be dealt
with at one time because of limitations in the availability of cen!rifuge space, Three
spare 1200 mL reaction vessel lids had a circular hole (63 mm diameter) cut in the top
and a piece of 2 111m stainless steel mesh glued in place with Araldite. tJse of the
sieve lid involved screwing the sicve lid onto a reaction vessel which was then
upturned into an 8UO ml, beaker. The size of the beaker was such that the rcaction
vessel remained suspended near the top of the beaker.
Once the larger particles of bark were separated from the extractant, the fine particles
had to be removed. It \vas found that centrifuge tubes of greater than 250 mL allovved
too much internal circulation of the extractant after spinning, which stirred up the
sediment. Speeds of less than 8,000 rpm I~liled to compact the sediment. while at
speeds greater than 13,000 rpm, the sediment tended to form Hakes which Hoated
freely and disintegrated when the tuhe had stopped spinning. A combination of a
250 mL high speed centrifuge tube sPlin at 10,000 rpm for six minutes gave maximum
sedimentation with a minimum of wasted time. The supernatant could then be filtered
through Whatman No.4 filter paper in a Buckner funnel under vacuum.
5.1.2.4 Extractants
Two extractants were chosen to separate the two fractions of absorbed nitrogen:
1. Water extraction, as a measure of the "readily available" nitrogen, and
2. Potassium chloride (2 M) extraction, as a measure of the total extractable nitrogen
The difference between total extractable nitrogen and "readily available" nitrogen was
taken as the estimate of the "firmly bonded" fraction.
Factors examined which had the potential to affect the extraction ofnitro.gen included:
(a) the number of extractions required to achieve an acceptable result.
(b )the appropriate duration of extraction.
(c ) the appropriate volume of extractant for a 50 g bark sample.
5.1.2.5 Experimental design
The experiment was a completely randomised design, treatment combinations
including one of two volumes of extractant (250 or 500 mL), one of three durations of
extraction (30, 60 or 90 minutes), and one of four combinations of extractions (l or 2
water extractions followed by 1 or 2 KCI extractions). Each treatment combination
had three replicates (Table 5.1).
5.1.2.6 Extraction technique
,
The technique described in Section 5.1.2.3 was used to separate the bark from the
Table 5.1. Combinations of extractant volume and type, and duration of extraction.
Extraction Volume of Number of water Number of KCl Duration of combination extractant (mL) extractions extractions extraction
1 250 1 I 30
2 250 1 2 30
3 250 2 1 30
4 250 ., 2 2 30
5 250 1 1 60
6 ·250 1 2 60
i - 7 250 2 1 60
8 250 2 2 60
9 250 1 1 90
10 250 1 2 90
11 250 2 .. 1 90
12 250 2 2 90
13 500 1 1 30
14 500 2 1 30
15 500 2 2 30
16 500 1 I 60
•
17 .500 1 2 60
(Section 3.5), to inhibit microbial groWth, and stored at 4°C until analysis by the Flow
Injection Analyser. The quantity of nitrogen recovered could then be calculated.
When subsequent extractions were required, the following steps were followed .
.
The 800 mL beaker, the sieve lid, the Buckner funnel and filter paper, and the
.
-centrifuge tube(s) used in separation of the bark from the liquid were washed into the
reaction vessel with the next extractant (Table 5.1). The quantity of this extractant
used for washing was determined by difference of weight in the reaction vessel, and
the volume required to make the volume to 250 or 500 mL (Table 5.1) calculated and
added ready for the next extraction. .
Extraction of absorbed nitrogen involved shaking the ·reaction vessels on an