ARTICLE
Fiber-Tracking Techniques Can Predict the Degree of
Neurologic Impairment for Periventricular
Leukomalacia
Aki Murakami, MDa, Masafumi Morimoto, MD, PhDa, Kei Yamada, MD, PhDb, Osamu Kizu, MD, PhDb, Akira Nishimura, MD, PhDa, Tsunehiko Nishimura, MD, PhDb, Tohru Sugimoto, MD, PhDa
aDepartments of Pediatrics andbRadiology, Graduate School of Medical Science, Kyoto Prefectural University of Medicine, Kyoto, Japan
The authors have indicated they have no financial relationships relevant to this article to disclose.
What’s Known on This Subject
Periventricular leukomalacia is recognized as one of the most important causes of cere-bral palsy in preterm infants. However, noninvasive methods of assessing the severity of injury at the earliest stage of life have not yet been established.
What This Study Adds
The present study suggests that clinical outcomes can be predicted reliably with fiber-tracking techniques in the early stage of development. Early screening of patients with a history of asphyxia may facilitate early intervention (eg, rehabilitation) to achieve bet-ter motor function.
ABSTRACT
OBJECTIVE.Preterm or low birth weight infants display a greater propensity for white matter injury caused by hypoxic-ischemic encephalopathy in the perinatal period. Such episodes can result in periventricular leukomalacia, which may substantially influence later brain development. Noninvasive methods of assessing the severity of injury at the earliest stage of life have not yet been established.
METHODS.We used diffusion tensor imaging to evaluate sensorimotor fibers in periven-tricular leukomalacia. Region-of-interest measurements and tractography-based measurements were performed for 10 patients with periventricular leukomalacia. The mean age of the patients was 19⫾9.5 months (range: 9 – 41 months). Motor functions were assessed at a mean age of 28⫾14.5 months.
RESULTS.Measured fractional anisotropy values of the motor tract were significantly higher in all mild periventricular leukomalacia cases than in severe cases. A fractional anisotropy cutoff value of ⬍0.5 was useful for predicting severe periventricular leukomalacia. Region-of-interest measurements were less sensitive, compared with tractography-based measurements.
CONCLUSIONS.Fiber-tracking techniques can provide information on the pathophysio-logic features of motor disability in patients with periventricular leukomalacia. Early screening of patients with a history of asphyxia may facilitate early intervention (eg, rehabilitation), to achieve better motor function.Pediatrics2008;122:500–506
P
ERIVENTRICULAR LEUKOMALACIA (PVL) is now recognized as one of the mostimportant causes of cerebral palsy (CP) in preterm infants. The incidence of intraventricular hemorrhage and associated complications has declined recently, and PVL has become the dominant neuropathologic condition in premature infants. PVL is the major neurologic basis of spastic motor deficits and cognitive abnormalities observed later in such infants.1On MRI scans, findings of PVL are related to injury to developing periventricular white matter
during the late second trimester and early third trimester of pregnancy, with resultant T1 and/or T2 prolongation, thinning of the posterior body of the corpus callosum, enlargement of the lateral ventricles, and irregularity of the ventricular walls.2Conventional imaging methods, including MRI3and ultrasonography,4have been largely limited
to evaluation of the geographic distribution of brain damage and not functional aspects of the damage. Direct methods allowing the observation of brain damage in relation to vital fiber tracts, including sensory and motor pathways, would clearly be of great clinical benefit.
Diffusion tensor imaging (DTI) is a recently developed imaging technique that characterizes water-diffusion properties in each MRI voxel.5,6 The diffusion tensor describes an ellipsoid in space, and the size, shape, and orientation of the
ellipsoid are given by the eigenvalues and eigenvectors of the tensor. On the basis of the diffusion tensor, several quantifiable and absolute measures can be determined and mapped, including fractional anisotropy (FA) and the apparent diffusion coefficient, which are sensitive to microstructural abnormalities that are occult on conventional MRI scans. DTI has already been proven useful for evaluating brain development and white matter injury.7–9
www.pediatrics.org/cgi/doi/10.1542/ peds.2007-2816
doi:10.1542/peds.2007-2816
Key Words
cerebral palsy, developmental outcome, hypoxic-ischemic encephalopathy, neurodevelopmental, neuroimaging
Abbreviations
PVL—periventricular leukomalacia CST— corticospinal tract CP— cerebral palsy ROI—region of interest FA—fractional anisotropy DTI— diffusion tensor imaging
Accepted for publication Dec 17, 2007
Address correspondence to Aki Murakami, MD, Department of Pediatrics, Graduate School of Medical Science, Kyoto Prefectural University of Medicine, Kawaramachi-Hirokoji, Kamigyo, Kyoto 602-8566, Japan. E-mail: [email protected]
Through extension of DTI techniques, the trajectory of neuronal fibers can now be observed with fiber-tracking techniques or tractography. This technique enables 3-di-mensional segmentation of axonal bundles, allowing mea-surements of DTI parameters in specific white matter path-ways.10 This tract-based measurement technique has
potential advantages over standard, region-of-interest (ROI) methods, showing reduced susceptibility to operator variability, and therefore may provide increased reproduc-ibility for tract localization in serial studies and between different subjects.11,12Fiber-tracking has been used widely
for adult diseases, such as stroke13and tumor,14but less so
for neonates and infants, primarily because of a lower degree of anisotropy. However, several studies successfully reported tractography in this population.9,11,15
The present study sought to investigate whether these newer techniques are able to characterize the brains of patients with PVL at the earliest stage. One of the most important clinical features in PVL is abnormality of tone and movement, notably spasticity, which has been at-tributed to a loss of descending pyramidal corticospinal tracts (CSTs).16,17Our study thus aimed to characterize
these vital tracts by using the fiber-tracking technique and investigated the possibility of predicting prognoses for patients at the earliest stage.
METHODS
Patient Population
This study was approved by the ethics committee of our university, and written informed consent was obtained from the parents of each patient. MRI was performed between December 2002 and June 2004 for 60 children with suspected neonatal brain injury. We performed
fiber-tracking in these 60 cases before selecting the cases that met our inclusion criteria for PVL. This was per-formed to minimize bias from operator-dependent pro-cesses in the fiber-tracking technique. Only 10 of the 60 patients met the following inclusion criteria: (1) history of hypoxia in the perinatal period and (2) diagnosis of PVL based on both clinical and imaging findings (Table 1). Because clinical symptoms of PVL usually are difficult to detect until the neurologic sequelae become apparent in later infancy, MRI played a crucial role in diagnosis. Imaging diagnosis of PVL was based on focal necrotic lesions in the periventricular white matter and/or more-diffuse white matter damage. The mean age at the time of scanning was 19⫾9.5 months (range: 9 – 41 months). Motor functions were assessed at a mean age of 28 ⫾ 14.5 months (range: 15– 63 months).
Clinical history and present illness findings for this group are summarized in Table 1. Five children (patients 1, 4, 5, 7, and 9) displayed severe complications, char-acterized by CP (spastic paraplegia or quadriplegia), mental retardation, and/or epilepsy (patients 1 and 4). These patients constituted the CP group. The remaining 5 children had almost-normal development, without pa-ralysis or seizures. Functionally nonimpaired patients with PVL constituted the non-CP group. CP is defined as a nonprogressive disorder of posture and movement, often associated with mental retardation, epilepsy, and abnormalities of speech, vision, and intellect, resulting from a defect or lesion of the developing brain.
Imaging Methods
DTI data for fiber-tracking were obtained in 264 seconds. DTI was performed at the end of the routine child
pro-TABLE 1 Clinical Features and MRI Findings of Patients Patient Age at Scan
(Corrected Age), mo GA at Birth, wk Weight at Birth, g Apgar Score Delivery Method Patient’s Diagnosis in Neonatal Period Periventricular White Matter Volume Loss in
MRI Scan Present Age (Corrected Age), mo CP 1 Min 5 Min
1 15 (11) 244⁄7
682 1 2 ECS RDS, CLD Bilateral atrial, moderate 29 (25) Left sided spastic paraplegia 2 14 (10) 251⁄7
700 1 4 ECS RDS, CLD Bilateral periventricular, moderate
16 (12) None
3 41 (38) 28 706 0 1 ECS TTTS, RDS, CLD Right periventricular, moderate
63 (60) None
4 19 (16) 251⁄7
826 6 7 ECS RDS Bilateral periventricular, severe
30 (27) Spastic quadriplegia
5 14 (12) 273⁄7
888 6 7 NVD RDS Bilateral atrial, moderate 20 (18) Spastic paraplegia 6 17 (15) 264⁄7
984 1 3 ECS RDS, CLD Bilateral periventricular, moderate
26 (24) None
7 9 (6) 274⁄7
1055 3 4 ECS TTTS, RDS Bilateral periventricular, moderate
16 (13) Spastic paraplegia
8 14 (11) 276⁄7
1120 3 6 NVD RDS, CLD Bilateral periventricular, mild
15 (12) None
9 29 (27) 293⁄7
1362 8 8 ECS RDS Right periventricular, mild
38 (36) Spastic paraplegia
10 25 (24) 343⁄7
1882 8 9 NVD PA, VSD Bilateral periventricular, moderate
34 (33) None
tocol used at our institute. Images were obtained by using a 1.5-T, whole-body scanner (Gyroscan Intera; Philips Medical Systems, Best, Netherlands) with a gra-dient strength of 30 mT/m. A single-shot echo-planar imaging technique was used for DTI (repetition time: 6000 milliseconds; excitation time: 88 milliseconds), with a motion-probing gradient in 15 orientations, a field of view of 230 mm,bvalues of 0 and 1000 seconds/ mm2, and image averaging over 2 measurements. Re-corded data matrix were 128 ⫻ 37, with the parallel imaging technique. A total of 36 slices (thickness: 3 mm), without an interslice gap, were obtained.
Data Postprocessing and Fiber-Tracking Method
Anisotropy at each voxel was calculated, and color maps were created. The procedure for mapping neural con-nections was started through designation of 3 arbitrary ROIs in the 3-dimensional imaging space. We deter-mined ROIs on axial slices of the color vector map for all cases (Fig 1). Slices for all ROI placements were deter-mined on the basis of commonly identifiable anatomic landmarks for consistency, based on previously proposed methods.11,12We first performed fiber-tracking of the
mo-tor tract, usually on the left side, and set 3 ROIs for CSTs. The first ROI was set at the ventral part of the pons. The second ROI was set at the internal capsule, at the level of the anterior border of the genu of the corpus callosum. The third ROI was set on the primary motor cortex of the frontal lobe. Tracking was terminated (stop criteria) when a pixel with low FA and/or a predetermined tra-jectory curvature between 2 contiguous vectors was reached. The stop criterion of FA⫽0.18 was used as a default. We did not use the threshold of FA⫽0.2 that is generally considered standard in adult studies because this would not allow tracking of the less-mature fiber tracts in infants. Fiber tracts passing through all ROIs
were designated as the final tracts of interest. When tracking of bilateral CSTs was complete, we performed sensory fiber-tracking in a similar manner. To perform fiber-tracking of sensory tracts, we set 2 ROIs in all cases. The first ROI was set at the dorsal part of the pons, with the second ROI at the white matter adjacent to the somatosensory cortex of the parietal lobe (Fig 1). Fiber-tracking was performed in a blinded manner in all cases, without knowledge of patient histories. Fiber-tracking was performed by a single operator (Dr Murakami), to maintain consistency in the placement of seed points.
FA and Apparent Diffusion Coefficient Measurements
We used 2 different methods to record FA and apparent diffusion coefficient values for each anatomic landmark of the brain. In the first method, FA measurements were performed by manually drawing ROIs at the centrum semiovale on each side of the brain (Fig 2). The second method was performed by measuring the FA of all vox-els that constituted the depicted tract. This was per-formed in a semiautomatic manner by using custom-made software (“fiber statistics”). We called this method “tract-specific measurement” (Fig 3). We used the FA
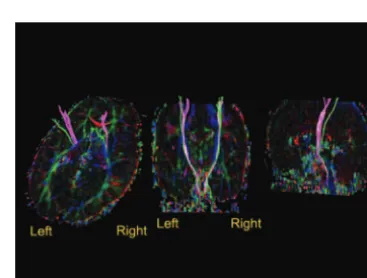
FIGURE 1
Locations of ROIs used for fiber-tracking, superimposed on color vector maps. The color maps show the direction of local fibers, represented by red (left-right), green (anterior-posterior), and blue (superior-inferior). Purple ROIs represent those used for the CSTs. The first ROI was set at the ventral pons, the second ROI at the internal capsule (at the level of the anterior border of the genu of the corpus callosum on a sagittal slice), and the third ROI on the primary motor cortex. Green ROIs represent those used for sensory tracts. The first ROI was set at the dorsal pons and the second on the somatosensory cortex.
FIGURE 2
ROI-specific measurement. FA measurements of a manually drawn ROI at the level of the centrum semiovale were performed.
FIGURE 3
values of the genu/splenium of the corpus callosum as references.
RESULTS
Fiber-Tracking
CSTs of all 10 PVL cases were depicted successfully. Sen-sory tracts were depicted successfully except for 1 patient with severe quadriplegia (patient 4). One representative case is provided as an example (patient 10) (Fig 3).
ROI-Specific Measurements
Results of conventional ROI-based measurements are shown in Fig 4. We performed data analysis to compare the 2 groups by using Welch’s t test after the F test; almost-normal development was present in 5 cases (non-CP group; FA: 0.428⫾0.095), and severe compli-cations were present in the remaining 5 cases (CP group; FA: 0.390⫾0.122). Both groups had 10 values (n⫽10) measured from the bilateral centrum semiovale. This conventional ROI method failed to identify any differ-ences (P⫽.227;ttest). The results of pairwise compar-isons between the 2 groups at the genu and splenium of the corpus callosum with this method also were not statistically significant (genu: P ⫽.268; splenium: P ⫽
.156;ttest).
Tract-Specific Measurements
Results of direct FA measurements from motor tracts depicted with tractography are shown in Table 2 and Fig 5. Each group had 10 values (n⫽10), because bilateral measurements of motor tracts were made for each of the 5 patients. Comparison of the non-CP group (FA: 0.535⫾ 0.016) and the CP group (FA: 0.414⫾0.016) revealed significant differences (P⬍ .001; ttest). The results of pairwise comparisons between the 2 groups at the genu and splenium of the corpus callosum with this method were not statistically significant (genu: P ⫽.161; sple-nium:P⫽.154;ttest).
Logistic regression analysis found that a FA value of 0.5 was effective in differentiating between the CP and non-CP groups (P⬍.001;R2⫽1), despite the relatively wide range of patients’ gestational ages and timing of MRI. All except 1 patient in the CP group displayed FA values of ⬍0.5, which suggested damage to the motor tract. Conversely, measured FA values for the 5 patients in the non-CP group were⬎0.5 (Table 2 and Fig 5). One exceptional patient in the CP group (patient 1) displayed a FA value of⬎0.5 on one side, but this agreed well with the clinical symptoms, because paralysis was unilateral (left side). The depicted tractographic results were sym-metrical in 9 cases, with this 1 case being the exception.
DISCUSSION
PVL is one of the most common causes of CP for low birth weight infants, causing not only CP in the form of quadriplegia and paraplegia but also various aftereffect injuries, including mental retardation and epilepsy. Early accurate evaluation of these patients would have significant clinical impact, because certain training
pro-FIGURE 4
Results of ROI-specific measurement. This method failed to identify any differences be-tween the non-CP and CP groups (P⫽.227; Welch’sttest). The gray line shows the average of all values. The breadth of each green rhomboid shows the number of cases in the group, the height shows the 95% confidence interval, the middle line shows the average of the group, and the horizontal lines in the upper and lower parts show the overlap marks. The overlap marks of the 2 groups are not separated in this figure, indi-cating that there is no significant statistical difference between these 2 groups.
FIGURE 5
Results of tract-specific measurement. The comparison of the non-CP and CP groups revealed differences (P⬍.001; Welch’sttest). The overlap marks of the 2 groups are not overlapping in this figure, indicating that there is a statistically significant difference between the 2 groups.
TABLE 2 FA Values of Depicted Motor Tracts in Tract-Specific Measurement
Patient FA
Left Motor
Right Motor
Left Sensory
Right Sensory
1a 0.50 0.36 0.42 0.45
2 0.52 0.53 0.43 0.45
3 0.54 0.51 0.54 0.51
4a 0.34 0.34 Not depicted Not depicted
5a 0.47 0.48 0.41 0.44
6 0.50 0.51 0.45 0.48
7a 0.33 0.41 0.35 0.33
8 0.58 0.57 0.62 0.49
9a 0.43 0.46 0.42 0.35
10 0.53 0.56 0.54 0.56
grams can be initiated as soon as the possibility of a defect is identified.18,19Evaluation of early-stage PVL has
relied traditionally on clinical examinations at follow-up visits, typically at ages when the pediatrician is able to observe certain developmental milestones. Recent ad-vances in cross-sectional imaging techniques, particu-larly MRI, have enabled earlier evaluation of these pa-tients. For example, the degree of white matter loss,20
lateral ventricular volume,21 and myelination22 have
been shown to allow prediction of patient outcomes to a certain degree. In addition, classification of PVL severity on the basis of various imaging modalities (not including DTI) has been undertaken, with limited success.21Those
investigations revealed that conventional imaging meth-ods have substantial limitations. Even when similar de-grees of decreases in white matter volume or expansion of a cerebral ventricle are recognized, the severity of aftereffect injuries may vary from case to case. Predicting prognosis by using the various laboratory procedures that have been applied, such as electroencephalogra-phy23and measurements of levels of serum-free oxygen
radicals,24 natriuretic peptides,25 and bilirubin,26 also is
difficult.
Fiber-tracking techniques represent recent advances in MRI that enable assessment of the major fiber path-ways of the brain.5,27,28 This method has been applied
clinically for various pathologic conditions of the adult brain.29 This technique is generally difficult to apply to
children, however, because of small brain size, greater incidence of motion artifacts, and rapid evolution of myelination. Evaluation is particularly difficult during the neonatal period and infancy, because FA values are lower throughout the white matter.8,30
Some attempts at fiber-tracking have been used suc-cessfully to assess patients with PVL, but most such studies were performed with patients⬎6 years of age. Those studies showed that the degree of degeneration of motor, sensory, and possibly commissural pathways correlated with final clinical outcomes.16,31
We examined 10 cases of PVL during infancy. Mea-surements of FA were made by using 2 different meth-ods, to identify the method that might offer better biomarker results that predict clinical outcomes. The well-accepted method that has been commonly used is ROI-specific measurement, which is performed by plac-ing ROIs at certain anatomic landmarks, such as the pons, central semiovale, and corpus callosum. ROI anal-ysis has been shown to be sensitive enough to show a significant reduction in FA at the posterior limb of the internal capsule in infants with CP.32Normal brain
mat-uration can also be studied effectively by using ROI-specific measurement.33
This ROI-based method is, however, somewhat limited in reproducibility and susceptible to operator variability in the placement of ROIs. We placed ROIs on commonly identifiable anatomic landmarks, on the basis of previ-ously proposed methods, and confirmed the location of ROIs in each case by referring to sagittal and coronal slices. Furthermore, we used ROIs of similar sizes for each part of the measurements. To reduce the possibility of bias further, we performed measurements without
knowing the patients’ disease status or functional out-comes. Despite such efforts, the weakness of this oper-ator-dependent procedure was indicated by the results of our analysis, which was unable to reveal any differ-ences between patients with good and poor outcomes. ROI-specific measurement was thus considered an im-perfect tool for examining our series of cases.
The second method we used measures the FA of all voxels constituting the entire fiber bundle. This calcula-tion is a semiautomated process that is built into the software. A similar method was used previously to study the maturity of white matter tracts and myelination in pediatric populations.34,35Those earlier studies indicated
that CSTs can be better assessed with tractography, in an easier manner and with reduced partial-volume ef-fects. Those studies also showed that the FA of white matter bundles correlates well with the known stages of white matter maturation and myelination. FA val-ues of CSTs also were shown to change in relation to age, reaching FA values close to adult levels by 20 weeks of age.35–37
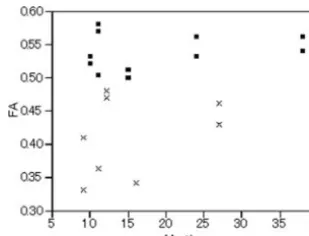
Our population consisted of infants⬎6 months of age (corrected by the gestational age at birth) and thus can be considered to have been in this plateau phase in terms of FA maturation. Tract-specific measurement of the entire fiber bundle of motor tracts yielded a value of 0.54 ⫾0.02 in the non-CP group, compared with 0.41⫾ 0.02 in the CP group. Pairwise compari-sons using the F test and Welch’s t test revealed a significant difference among groups in motor tracts (P ⬍ .0001). The gestational age at birth was not significantly different (2 analysis), and neither was the age at the time of MRI (Fig 6).
We analyzed our data by using logistic regression analysis, with the independent variable being values of measurements and the dependent variable being prog-nosis (CP or non-CP). This analysis proved that a FA value of 0.5 was highly effective in differentiating the 2 groups (P⬍ .001;R2 ⫽1.00). In fact, all FA measure-ments for 5 patients in the non-CP group showed FA values of ⬎0.5, whereas 5 patients in the CP group showed FA values of⬍0.5. A single case (patient 1) in the CP group displayed only right motor FA value of
⬍0.5, but this was actually in good agreement with the
FIGURE 6
clinical symptoms, because the patient displayed left-sided paralysis only. Pyramidal tracts were depicted in a symmetrical fashion in the other 9 cases. It is of note that these FA values were unrelated to gestational age, birth weight, or Apgar scores and were related only to later motor function. These results suggest that clinical out-comes can be reliably predicted from the results of trac-tography performed in the early stage of development.
This study demonstrated that fiber-tracking tech-niques can provide more information for understanding the pathophysiologic features of motor disability and associated sensory handicaps with PVL. We may be able to screen patients with a history of asphyxia by using tractography and then start early intervention (eg, reha-bilitation), to maximize the salvage of grave motor def-icits.
ACKNOWLEDGMENTS
We thank Katsumi Yagi, Kyoto Prefectural University of Medicine, for discussion on the data analysis.
REFERENCES
1. Volpe JJ. Neurobiology of periventricular leukomalacia in the premature infant.Pediatr Res.2001;50(5):553–562
2. Flodmark O, Lupton B, Li D, et al. MR imaging of periventricu-lar leukomalacia in childhood. AJR Am J Roentgenol. 1989; 152(3):583–590
3. Fedrizzi E, Inverno M, Bruzzone MG, Botteon G, Saletti V, Farinotti M. MRI features of cerebral lesions and cognitive functions in preterm spastic diplegic children. Pediatr Neurol. 1996;15(3):207–212
4. Maalouf EF, Duggan PJ, Counsell SJ, et al. Comparison of findings on cranial ultrasound and magnetic resonance imag-ing in preterm infants.Pediatrics.2001;107(4):719 –727 5. Mori S, Crain BJ, Chacko VP, van Zijl PC. Three-dimensional
tracking of axonal projections in the brain by magnetic reso-nance imaging.Ann Neurol.1999;45(2):265–269
6. Mori S, van Zijl PC. Fiber tracking: principles and strategies: a technical review.NMR Biomed.2002;15(7– 8):468 – 480 7. Zhai G, Lin W, Wilber KP, Gerig G, Gilmore JH. Comparisons of
regional white matter diffusion in healthy neonates and adults performed with a 3.0-T head-only MR imaging unit.Radiology. 2003;229(3):673– 681
8. Hu¨ppi PS, Murphy B, Maier SE, et al. Microstructural brain development after perinatal cerebral white matter injury as-sessed by diffusion tensor magnetic resonance imaging. Pediat-rics.2001;107(3):455– 460
9. Hermoye L, Saint-Martin C, Cosnard G, et al. Pediatric diffu-sion tensor imaging: normal database and observation of the white matter maturation in early childhood.Neuroimage.2006; 29(2):493–504
10. Xue R, van Zijl PCM, Crain BJ, Solaiyappan M, Mori S. In vivo three-dimensional reconstruction of rat brain axonal projec-tions by diffusion tensor imaging.Magn Reson Med.1999;42(6): 1123–1127
11. Partridge SC, Mukherjee P, Berman JI, et al. Tractography-based quantitation of diffusion tensor imaging parameters in white matter tracts of preterm newborns.J Magn Reson Imaging. 2005;22(4):467– 474
12. Partridge SC, Vigneron DB, Charlton NN, et al. Pyramidal tract maturation after brain injury in newborns with heart disease. Ann Neurol.2006;59(4):640 – 651
13. Kunimatsu A, Aoki S, Masutani Y, et al. Three-dimensional white matter tractography by diffusion tensor imaging in
isch-aemic stroke involving the corticospinal tract.Neuroradiology. 2003;45(8):532–535
14. Nimsky C, Ganslandt O, Merhof D, et al. Intraoperative visu-alization of the pyramidal tract by diffusion-tensor-imaging-based fiber tracking.Neuroimage.2006;30(4):1219 –1229 15. Staudt M, Braun C, Gerloff C, Erb M, Grodd W,
Krageloh-Mann I. Developing somatosensory projections bypass periventricular brain lesions.Neurology.2006;67(3):522–525 16. Thomas B, Eyssen M, Peeters R, et al. Quantitative diffusion
tensor imaging in cerebral palsy due to periventricular white matter injury.Brain.2005;128(11):2562–2577
17. Fan GG, Yu B, Quan SM, Sun BH, Guo QY. Potential of diffusion tensor MRI in the assessment of periventricular leu-komalacia.Clin Radiol.2006;61(4):358 –364
18. Kanda T, Pidcock FS, Hayakawa K, Yamori Y, Shikata Y. Motor outcome differences between two groups of children with spas-tic diplegia who received different intensities of early onset physiotherapy followed for 5 years. Brain Dev. 2004;26(2): 118 –126
19. Ohgi S, Fukuda M, Akiyama T, Gima H. Effect of an early intervention programme on low birthweight infants with ce-rebral injuries.J Paediatr Child Health.2004;40(12):689 – 695 20. Staudt M, Pavlova M, Bohm S, Grodd W, Krageloh-Mann I.
Pyramidal tract damage correlates with motor dysfunction in bilateral periventricular leukomalacia (PVL). Neuropediatrics. 2003;34(4):182–188
21. Melhem ER, Hoon AH Jr, Ferrucci JT Jr, et al. Periventricular leukomalacia: relationship between lateral ventricular volume on brain MR images and severity of cognitive and motor im-pairment.Radiology.2000;214(1):199 –204
22. Carmody DP, Dunn SM, Boddie-Willis AS, DeMarco JK, Lewis M. A quantitative measure of myelination development in infants, using MR images.Neuroradiology.2004;46(9):781–786 23. Azzopardi D, Guarino I, Brayshaw C, et al. Prediction of neu-rological outcome after birth asphyxia from early continuous two-channel electroencephalography. Early Hum Dev. 1999; 55(2):113–123
24. Nangia S, Saili A, Dutta AK, Batra S, Ray GN. Free oxygen radicals: predictors of neonatal outcome following perinatal asphyxia.Indian J Pediatr.1998;65(3):419 – 427
25. Okumura A, Kato T, Hayakawa F, Kidokoro H, Kuno K, Wa-tanabe K. A pilot study on umbilical venous level of natriuretic peptides in preterm infants and their relation to periventricular leukomalacia and antenatal complications. Brain Dev. 2002; 24(1):30 –32
26. Oh W, Tyson JE, Fanaroff AA, et al. Association between peak serum bilirubin and neurodevelopmental outcomes in ex-tremely low birth weight infants. Pediatrics. 2003;112(4): 773–779
27. Le Bihan D. Looking into the functional architecture of the brain with diffusion MRI.Nat Rev Neurosci.2003;4(6):469 – 480 28. Lehe´ricy S, Ducros M, Van de Moortele PF, et al. Diffusion tensor fiber tracking shows distinct corticostriatal circuits in humans.Ann Neurol.2004;55(4):522–529
29. Jones DK, Lythgoe D, Horsfield MA, Simmons A, Williams SC, Markus HS. Characterization of white matter damage in isch-emic leukoaraiosis with diffusion tensor MRI. Stroke. 1999; 30(2):393–397
30. Schneider JF, Il’yasov KA, Hennig J, Martin E. Fast quantita-tive diffusion-tensor imaging of cerebral white matter from the neonatal period to adolescence. Neuroradiology. 2004;46(4): 258 –266
31. Hoon AH Jr, Lawrie WT Jr, Melhem ER, et al. Diffusion tensor imaging of periventricular leukomalacia shows affected sen-sory cortex white matter pathways. Neurology. 2002;59(5): 752–756
ten-sor brain imaging findings at term-equivalent age may predict neurologic abnormalities in low birth weight preterm infants. AJNR Am J Neuroradiol.2003;24(8):1646 –1653
33. Mukherjee P, Miller JH, Shimony JS, et al. Diffusion-tensor MR imaging of gray and white matter development during normal human brain maturation. AJNR Am J Neuroradiol. 2002;23(9):1445–1456
34. Partridge SC, Mukherjee P, Henry RG, et al. Diffusion tensor imaging: serial quantitation of white matter tract in premature newborns.Neuroimage.2004;22(3):1302–1314
35. Dubois J, Panier LH, Lambertz GD, Cointepas Y, Le Bihan D.
Assessment of the early organization and maturation of in-fant’s cerebral white matter fiber bundles: a feasibility study using quantitative diffusion tensor imaging and tractography. Neuroimage.2006;30(4):1121–1132
36. Wakana S, Caprihan A, Panzenboeck MM, et al. Reproducibil-ity of quantitative tractography methods applied to cerebral white matter.Neuroimage.2007;36(3):630 – 644
37. Cosottini M, Giannelli M, Siciliano G, et al. Diffusion-tensor MR imaging of corticospinal tract in amyotrophic lateral scle-rosis and progressive muscular atrophy. Radiology. 2006; 237(1):258 –264
AS DERMATOLOGISTS CATER TO LOOKS, OTHER PATIENTS FEEL SECOND CLASS
“Like airlines that offer first-class and coach sections, dermatology is fast becoming a two-tier business in which higher-paying customers often receive greater pampering. In some dermatologists’ offices, freer-spending cosmetic patients are given appointments more quickly than medical patients for whom health insurance pays fixed reimbursement fees. In other offices, cosmetic patients spend more time with a doctor. And in still others, doctors employ a special receptionist, called a cosmetic concierge, for their beauty patients. The message is that the cosmetic patient is more important than the medical patient, and that’s not a good message. A study published last year in
The Journal of the American Academy of Dermatologyfound that dermatologists in 11 American cities and one county offered faster appointments to a person calling about Botox than for someone calling about a changing mole, a possible sign of skin cancer. And dermatologists nationwide are increasingly hiring nurse practitioners and physicians’ assistants, called physician extend-ers, who primarily see medical patients, according to a study published earlier this year in the same journal. . . . ‘What are the physician extenders doing? Medical dermatology,’ Dr Allan C. Halpern, chief of dermatology at Memorial Sloan-Kettering Cancer Center in Manhattan, said in a melanoma lecture at a dermatology conference this year. ‘What are the dermatologists doing? Cosmetic dermatology.’”
Singer N.New York Times. July 28, 2008
DOI: 10.1542/peds.2007-2816
2008;122;500
Pediatrics
Tsunehiko Nishimura and Tohru Sugimoto
Aki Murakami, Masafumi Morimoto, Kei Yamada, Osamu Kizu, Akira Nishimura,
for Periventricular Leukomalacia
Fiber-Tracking Techniques Can Predict the Degree of Neurologic Impairment
Services
Updated Information &
http://pediatrics.aappublications.org/content/122/3/500
including high resolution figures, can be found at:
References
http://pediatrics.aappublications.org/content/122/3/500#BIBL
This article cites 37 articles, 8 of which you can access for free at:
Subspecialty Collections
http://www.aappublications.org/cgi/collection/neurology_sub
Neurology
following collection(s):
This article, along with others on similar topics, appears in the
Permissions & Licensing
http://www.aappublications.org/site/misc/Permissions.xhtml
in its entirety can be found online at:
Information about reproducing this article in parts (figures, tables) or
Reprints
http://www.aappublications.org/site/misc/reprints.xhtml
DOI: 10.1542/peds.2007-2816
2008;122;500
Pediatrics
Tsunehiko Nishimura and Tohru Sugimoto
Aki Murakami, Masafumi Morimoto, Kei Yamada, Osamu Kizu, Akira Nishimura,
for Periventricular Leukomalacia
Fiber-Tracking Techniques Can Predict the Degree of Neurologic Impairment
http://pediatrics.aappublications.org/content/122/3/500
located on the World Wide Web at:
The online version of this article, along with updated information and services, is
by the American Academy of Pediatrics. All rights reserved. Print ISSN: 1073-0397.