International Journal of Environmental Monitoring and Analysis
2013; 1(1) : 21-26Published online February 20, 2013 (http://www.sciencepublishinggroup.com/j/ijema) doi: 10.11648/j. ijema.20130101.13
A new generation air pollution alert system: integrating air
quality models and location-aware mobile devices
Nuri Yilmazer
1,*, Kuo-Jen Liao
2,*, Young Lee
1,*, Juan Mora
1, William Webb
1, Remzi Seker
3,*1
Electrical Engineering and Computer Science Department, Texas A&M University-Kingsville, Kingsville, Texas, USA
2
Environmental Engineering Department, Texas A&M University-Kingsville, Kingsville, Texas, USA
3
Electrical, Computer, Software & Systems Engineering, Embry-Riddle Aeronautical University, Daytona Beach, FL,USA
Email address:
[email protected] (N. Yilmazer) , [email protected] (Kuo-Jen Liao) , [email protected] (Y. Lee) , [email protected] (R. Seker)
To cite this article:
Nuri Yilmazer, Kuo-Jen Liao, Young Lee, Juan Mora, William Webb, Remzi Seker. A New Generation Air Pollution Alert System: Inte-grating Air Quality Models and Location-Aware Mobile Devices, International Journal of Environmental Monitoring and Analysis. Vol. 1, No. 1, 2013, pp. 21-26. doi: 10.11648/j.ijema.20130101.13
Abstract:
This paper introduces a new real-time air pollution alert system using mobile devices. Through the location awareness capability of mobile devices, Android- and iOS-based apps are developed to inform the public residing in the vicinity of air pollution areas. The apps have shown to be working successfully sending push notifications as well as a re-gional map to convey the air pollution information to users. The apps and real-time air pollution alert system can also be extended for other natural environmental disasters such as hurricanes, flooding, and wildfires and man-made disasters such as chemical spills.Keywords:
Real-time alert system, location aware systems, Smart Phones, Air Quality, Air Pollution Alert System1. Introduction
American Lung Association (2011) has reported that roughly half of the population (~154.5 millions) in the United States live in the 366 counties is exposed to unheal-thy levels of air pollution in the form of either ozone or short-term or year-round levels of particles [3-5]. Air quality forecasting has become a common practice for local and state air quality management agencies to inform the public of air pollution that may pose health risks. Air pollution forecasts have been receiving increasing attention. Today, about 300 cities nationwide issue air pollution alerts based on predicted concentrations of known pollutants such as ozone and particle pollution. Timely and effective air pollu-tion alerts can provide people with informapollu-tion they need to protect their health from the adverse effects of air pollution. Air pollution alerts are currently delivered to the public in three ways: 1) broadcasting through media; 2) internet postings and 3) emails/text messages. One major issue for these venues of report delivery is the efficacy of the infor-mation delivery as who may reside or travel to the forecasted pollution areas may not have access to internet or media. The email/text message alerts require users to subscribe to the air quality information and customize their location
information. However, people who receive the email alerts may not be in the area for which they receive the report. There is need to develop an air quality alert system which is capable of incorporating the location information in real-time and produce the necessary report to the user.
22 Nuri Yilmazer et al.: A new generation air pollution alert system: integrating airquality models and location-aware mobile devices
exposure evaluation and provide relevant support to urban air quality management that protects the environment and human health from the adverse effects of air pollution. In this study, we have used, U.S. Environmental Protection Agency (EPA)’s regional air quality modeling system, Models-3 [1], for simulating air quality in the U.S. The framework of numerical air quality forecasting is shown in Figure 1 below.
Figure 1. Framework of numerical air quality forecasting.
The US EPA’s regional air quality modeling system, Models-3, uses WRF, SMOKE and CMAQ models, for simulating air quality in the U.S. WRF is a widely used meso-scale meteorological model and CMAQ, as its name implies, is a community based air quality model that is being used by a growing population of scientists and planning organizations for air quality studies. SMOKE is the emis-sions processor which provides hourly gridded emission inputs for the CMAQ modeling. The air quality forecasting has been implemented on a high-performance computing cluster located at the College of Engineering building at Texas A&M University-Kingsville. The computing cluster has 40 nodes, each having 4 processors running at 3GHz and 8 GBs of DDR2 DRAM.
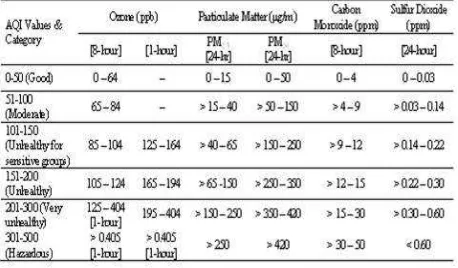
End-users of the forecasted air quality information will be groups susceptible to air pollution, outdoor workers, and the general public. The end-users need air quality forecasting information that is clear, easily understandable and consis-tent. The U.S. EPA has developed several standardized me-thods to easily communicate air pollution information to the public. The Air Quality Index (AQI) provides a standardized scale from 0 to 500 describing how clean or polluted the outdoor air is in a specific location and what associated health effects may result for the local population. The AQI is calculated for four major air pollutants regulated by the Clean Air Act [2]: ground-level ozone (O3), particle matter (PM), carbon monoxide (CO), and sulfur dioxide (SO2). AQI values, categories, and pollutant concentration thre-sholds can be seen in Table 1. When AQI of the forecasted air quality is above 100, it indicates that air quality is “Un-healthy for sensitive groups”, “Un“Un-healthy”, “Very unheal-thy”, or “Hazardous”, and air pollution alerts will be sent to the users of location-aware mobile devices residing in the forecasted pollution areas.
Table 1. AQI values, categories, and pollutant concentration thresholds.
In this study, mobile devices are used to improve the current air pollution alert systems. Specifically, we took advantage of the location-aware capabilities of mobile de-vices and developed an air pollution alert system using Ap-ple iOS and Google Android platforms, as they constitute the majority market share of smart-phones. The real-time air pollution alert system identifies locations of smart phone users and delivers timely and effective air pollution warning to the subscribed users who are present in the forecasted pollution areas.
2. Application Development
A smart phone is a mobile phone equipped with advanced computing capabilities and applications. In recent years, the demand for and the popularity of smart phones have been increasing tremendously. Likewise, there has been a steep increase of applications and services utilizing smart-phones. Given the trend and practicality of the venue, we decided to improve the efficacy of the traditional air pollution alert systems. Through this proposed alert system, locations of smart phone users are determined and timely and effective air pollution alerts are sent to users in the forecasted pollu-tion areas.
Locations of mobile users can be tracked using different approaches [7]. In this study, we have utilized the GPS-based location estimation technique as it provides location information with a very high degree of accuracy. Apple iOS and Google Android were used as main platforms in this study. As a platform, iOS uses Mac's popular pro-gramming language Objective C. XCodeSDK, Apple’s in-tegrated development environment can be used to develop applications for Mac, iPhone, and iPad. XCode also includes an iOS simulator. The Android applications are developed using Java and various integrated development environ-ments can be used to develop Android applications.
International Journal of Environmental Monitoring and Analysis 2013, 1(1): 21-26 23
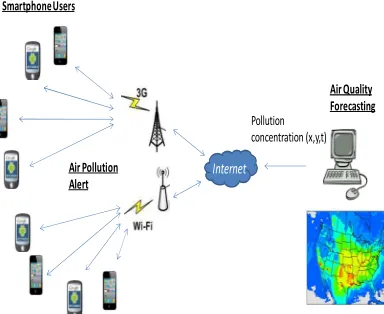
region are distributed to the general public via smart phone apps. Figure 2 shows the overall system layout.
Figure 2. Integrated alert system using smart phones and air quality forecasting models.
There are three main tiers in the air pollution system: the Air Pollution Information Center which belongs to the EPA, the servers, and the smart-phones. Serves are of two kinds: one server receives and stores temperature and air pollution data from Air Pollution Information Center and servers and other servers track users’ location and send alerts along with maps. In our first implementation, we have used one server to read data from the Air Pollution Information Center and another server to track with users and send them alerts. The alerts are text messages accompanied with map of the area of interest in which users reside at the moment. In order to receive the air pollution alerts, users need to register with the subscription server.
Once the Application is downloaded by the user, the App on smart phone provides the web server with the users’ location data as well as other user information. Color coding has been used to denote air pollution levels; ranging from blue to red where the red color represents the high air pol-lution level. This approach can be modified and extended to provide notices for environmental disaster alerts such as severe weather conditions and or alerts pertinent to man-made disasters such as chemical spills.
Server/smart-phone interactions are shown through the interaction flow charts for the Android and Apple iOS plat-forms seen in Figures 4 and 5, respectively.
Figure 3. Web server/ smart phone jobs.
Figure 4. Overall flowchart of the Air Pollution Alert System Programming for Android application. Air Pollution
Alert
Internet Smartphone Users
Air Quality Forecasting Pollution
concentration (x,y,t)
Register
Location
Alerts
Temperature/Air Pollution data with locations
Web server Air Pollution information
24 Nuri Yilmazer et al.: A new generation air pollution alert system: integrating air
The design of the Alert system for both Android and A ple iOS platforms are very similar to one another.
iOS application icon named “Environment Alert System (EAS) is shown in Figure 6below. Forecasted air pollution data obtained from U.S. EPA’s AirNOW air pollution system (http://airnow.gov/) [13] has been used to test the effe tiveness of the developed Apps.
Figure 6. iPhone app icon
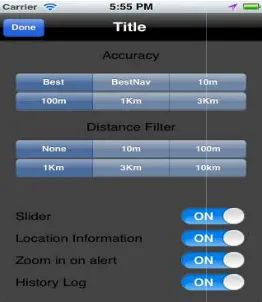
The system sends out the notifications to the users in the contaminated region. The settings of the apps can be easily customized by users at any time, as seen in Figure 7. The distance filter allows users to adjust the distance range which they would like to receive notifications. Additionally, location information and notifications log sheet is stored on the server for the user to revisit historical data. This log file is limited to 500 entries and entries will be removed on a fi in first out basis.
Figure 7. Alert system setting page for the iPhone iOS
.: A new generation air pollution alert system: integrating airquality models and location
Figure 5. iPhone Air Alert Pollution Flowchart.
The design of the Alert system for both Android and Ap-ar to one another.
iOS application icon named “Environment Alert System (EAS) is shown in Figure 6below. Forecasted air pollution data obtained from U.S. EPA’s AirNOW air pollution system (http://airnow.gov/) [13] has been used to test the
effec-app icon.
The system sends out the notifications to the users in the contaminated region. The settings of the apps can be easily customized by users at any time, as seen in Figure 7. The distance filter allows users to adjust the distance range for which they would like to receive notifications. Additionally, location information and notifications log sheet is stored on the server for the user to revisit historical data. This log file is limited to 500 entries and entries will be removed on a first
Alert system setting page for the iPhone iOS app.
The snapshots from Android and Apple iOS
seen in Figures 8,9, and 10. As it can be seen on Figures 8 and 9, a warning message along
tion area appears on the screen indicating the level of the contamination.
Figure 8. The Android air pollution alert app
Figure 9. The iPhone iOS
quality models and location-aware mobile devices
The snapshots from Android and Apple iOS Apps are seen in Figures 8,9, and 10. As it can be seen on Figures 8 and 9, a warning message along with the map of the pollu-tion area appears on the screen indicating the level of the
Android air pollution alert app.
International Journal of Environmental Monitoring and Analysis
Figure 10. A snapshot of an air quality map on the sm
The developed apps allow users monitor the Ozone and Particle pollution (PM) levels on a map at any time. Sele tion button at the top right and top left are used to select either one of them to monitor Different color codes are used to indicate the intensity level; green is the lowest and the red is the highest level of intensity. Additionally, the application also shows the update/refresh time of the server and the exact location of the smart phone user as well. Both standard and satellite images can be seen through Google Maps.
Figure 11. PM2.5 air quality map on Android
Figure 12. Ozone .5 air quality map on Android
International Journal of Environmental Monitoring and Analysis 2013, 1(1):
. A snapshot of an air quality map on the smart phone screen.
The developed apps allow users monitor the Ozone and on a map at any time. Selec-tion button at the top right and top left are used to select either one of them to monitor Different color codes are used dicate the intensity level; green is the lowest and the red is the highest level of intensity. Additionally, the application also shows the update/refresh time of the server and the exact location of the smart phone user as well. Both standard
an be seen through Google Maps.
M2.5 air quality map on Android devices.
e .5 air quality map on Android devices.
Figure 13. PM2.5 air quality map on iOS
Figure 14. Ozone air quality map on iOS
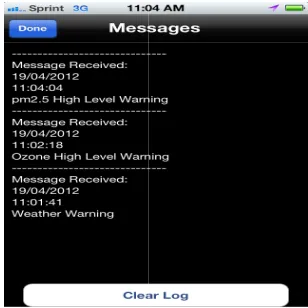
The server stores a history of warning messages sent to each user. A log file contains user information and the warning messages sent to the user along with time stamp of warning messages. A user can see this history by pressing on the ‘i’ icon located on the bottom right of the screen and easily access the log sheet. Figure 15 shows an example of browsing through the warnings received by a user. Figur shows the actual log file.
Figure 15. Example of Air Pollution warnings on Android devices
21-26 25
PM2.5 air quality map on iOS devices.
Ozone air quality map on iOS devices.
The server stores a history of warning messages sent to each user. A log file contains user information and the warning messages sent to the user along with time stamp of warning messages. A user can see this history by pressing on the bottom right of the screen and easily access the log sheet. Figure 15 shows an example of browsing through the warnings received by a user. Figure 16
26 Nuri Yilmazer et al.: A new generation air pollution alert system: integrating airquality models and location-aware mobile devices
Figure 16. The log file of Android air pollution alert app applications stored on the server.
3. Conclusions
We have successfully shown that Smart Phones can be utilized to develop a real-time air quality alert system which delivers timely and effective air quality information to users through location-aware mobile devices. As a future work, we plan to evaluate the effectiveness of the developed air pollution alert system for multi-users (>1,000) environment, and extend this technology for other disastrous scenarios such as tornadoes, flooding, and earthquake.
References
[1] Science Algorithms of the EPA Models-3 Community Mul-ti-scale Air Quality (CMAQ) Modeling System [Available
Online. Last accessed: October 2012]:
http://nepis.epa.gov/Exe/ZyNET.exe
[2] Clean Air Act [Available Online. Last accessed: October 2012]: http://www.epa.gov/air/caa/.
[3] American Lung Association: 2009, State of the Air 2009, p. 182.
[4] .Bell, M.L., Dominici, F. and Samet, J.M.: 2005, 'A me-ta-analysis of time-series studies of ozone and mortality with comparison to the national morbidity, mortality, and air pol-lution study', Epidemiology 16, 436-445.
[5] .Dominici, F., Peng, R.D., Bell, M.L., Pham, L., McDermott, A., Zeger, S.L. and Samet, J.M.: 2006, 'Fine particulate air pollution and hospital admission for cardiovascular and res-piratory diseases', Jama-Journal of the American Medical Association 295, 1127-1134.
[6] PanaghiotisKikiras, DimitrisDrakoulis, ’An Integrated Ap-proach for the Estimation of Mobile Subscriber Geolocation, Journal Wireless Personal Communications: Vol. 30 Issue 2-4, September 2004, 217–231.
[7] Y. Zhao. Mobile phone location determination and its impact on intelligent transportation systems. IEEE Transactions on Intelligent Transportation Systems, 1(1):55, 2000.
[8] P. Leijdekkers and V. Gay, “Personal heart monitoring and rehabilitation system using smart phones,” in ICMB. IEEE Computer Society, 2006, p. 29.
[9] R. Ballagas, M. Rohs, J. Sheridan, J. Borchers. The Smart Phone: A Ubiquitous Input Device. IEEE Per-vasive Com-puting, 5 (1), 2006.
[10] P. Mohan, V. N. Padmanabhan, and R. Ramjee, Nericell: Rich Monitoring of Road and Traffic Conditions using Mobile Smart phones, In Proc. of ACM SenSys ’08, Raleigh, NC, USA, Nov 2008.
[11] EijaKaasinen, ‘User needs for location-aware mobile ser-vices’, Pers Ubiquit Computing (2003) 7: 70–79.
[12] Marmasse N, Schmandt C (2000). Location-aware informa-tion delivery with Com Moinforma-tion. In: Thomas P, Gellersen HW (eds) Handheld and Ubiquitous Computing. Second Interna-tional Symposium, HUC 2000. Springer. pp 157–171.