Received 7 Jul 2016
|
Accepted 19 Oct 2016
|
Published 24 Nov 2016
Multiple myeloma risk variant at 7p15.3 creates
an IRF4-binding site and interferes with
CDCA7L
expression
Ni Li
1,2
, David C. Johnson
2
, Niels Weinhold
3,4
, James B. Studd
1
, Giulia Orlando
1
, Fabio Mirabella
2
,
Jonathan S. Mitchell
1
, Tobias Meissner
5
, Martin Kaiser
2
, Hartmut Goldschmidt
4,6
, Kari Hemminki
7,8
,
Gareth J. Morgan
3
& Richard S. Houlston
1,2
Genome-wide association studies have identified several risk loci for multiple myeloma
(MM); however, the mechanisms by which they influence MM are unknown. Here by using
genetic association data and functional characterization, we demonstrate that rs4487645
G4T, the most highly associated variant (
P
¼
5.30
10
25), resides in an enhancer element
47 kb upstream of the transcription start site of c-Myc-interacting
CDCA7L
. The G-risk allele,
associated with increased
CDCA7L
expression (
P
¼
1.95
10
36), increases IRF4 binding and
the enhancer interacts with the
CDCA7L
promoter. We show that suppression of
CDCA7L
limits MM proliferation through apoptosis, and increased
CDCA7L
expression is associated
with adverse patient survival. These findings implicate IRF4
-
mediated
CDCA7L
expression in
MM biology and indicate how germline variation might confer susceptibility to MM.
DOI: 10.1038/ncomms13656
OPEN
1Division of Genetics and Epidemiology, The Institute of Cancer Research, Surrey SM2 5NG, UK.2Division of Molecular Pathology, The Institute of Cancer
Research, Surrey SM2 5NG, UK.3Myeloma Institute for Research and Therapy, University of Arkansas for Medical Sciences, Little Rock, Arkansas 72205, USA.4Department of Internal Medicine V, University of Heidelberg, 69117 Heidelberg, Germany.5Department of Molecular and Experimental Medicine,
Avera Cancer Institute, La Jolla, California 92037, USA.6National Centre of Tumor Diseases, 69120 Heidelberg, Germany.7German Cancer Research Center,
69120 Heidelberg, Germany.8Center for Primary Health Care Research, Lund University, SE-205 02 Malmo, Sweden. Correspondence and requests for
G
enome-wide association studies (GWAS) have frequently
identified statistically significant associations within
noncoding regions of the genome; however, the causal
DNA sequence and their functional effects have only been
determined in a few instances
1.
GWAS have so far identified 17 risk loci for multiple myeloma
(MM), with the association signal at 7p15.3 containing
CDCA7L
(cell division cycle-associated seven-like protein) being shown to
be highly robust and not confined to a particular MM subtype
2–5.
CDCA7L
represents an attractive candidate for the functional
basis of the 7p15.3 association because of its role as a
MYC-interacting protein, acting as a binding partner of LEDGF/p75
(lens epithelium-derived growth factor) and potentiating
MYC-mediated transformation events
6–9. Given that deregulation of
MYC
typifies plasma cell neoplasms,
CDCA7L
therefore
represents an attractive functional basis of the 7p15.3 association.
Here we report the identification of the rs4487645 variant as
the potential functional basis of the 7p15.3 association for MM.
We demonstrate that through differential IRF4 binding
rs4487645 influences expression of c-Myc-interacting
CDCA7L.
Increased
CDCA7L
expression was associated with increased cell
proliferation and poorer patient survival. These findings provide
insight into the mechanistic basis of germline susceptibility to MM.
Results
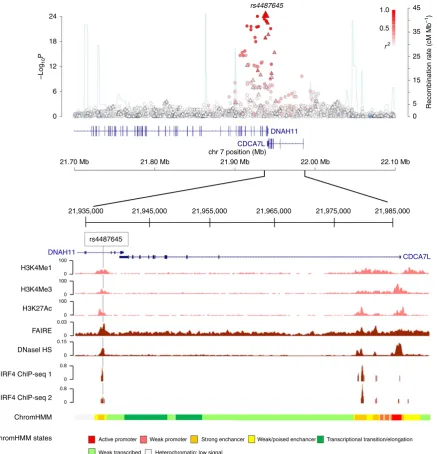
Fine mapping and epigenomic profiling of the risk locus
. We
have analysed a large meta-analysis of six MM GWAS conducted
in European populations totalling 9,866 cases and 239,188
con-trols
5. Imputation of these GWAS including use of 1000 Genomes
Project and UK10K data as reference
5confirmed the previously
identified single-nucleotide polymorphism (SNP) rs4487645 as
providing the strongest association signal at the 7p15.3 risk locus
2(
P
¼
5.30
10
25, odds ratio
¼
1.24; logistic regression followed
by fixed-effects meta-analysis, risk allele frequency
¼
0.65; Fig. 1).
In addition, we have excluded the existence of multiple
independent statistical signals at the 7p15.3 risk locus by
performing
association
testing
conditional
on
rs4487645
genotypes,
observing
no
additional
significant
variants.
Previously, we demonstrated an expression quantitative trait
locus (eQTL) signal between rs4487645 and
CDCA7L
(ref. 10),
with the risk allele associated with increased expression of
CDCA7L
. To further substantiate this eQTL, we analysed mRNA
expression data on CD138-purified plasma cells from 1,449 MM
cases from three independent series. Besides confirming that the
association of rs4487645 with
CDCA7L
was the strongest 7p15.3
eQTL (
P
¼
1.95
10
36; linear regression followed by
fixed-effects meta-analysis; Supplementary Table 1 and Supplementary
Fig. 1), conditional analysis provided no evidence for additional
independent signals
10.
To further prioritize candidate MM risk variants, we
examined the regulatory potential of SNPs in linkage
disequili-brium (
r
2Z
0.8) with rs4487645. We prioritized credible
candidate risk variants by their regulatory potential inferred
from B-cell-specific DNase I hypersensitivity (HS),
formalde-hyde-assisted
isolation
of
regulatory
elements
(FAIRE),
promoter-/enhancer-associated histone marks and chromatin
immunoprecipitation sequencing (ChIP-seq; Fig. 1 and
Supple-mentary Table 2)
11. SNP rs4487645 resides within a 1 kb active
enhancer region as predicted by ChromHMM, supported by
open chromatin analysis (DNase HS and FAIRE), as well as
H3K4Me1, H3K4Me3 and H3K27Ac peaks. ENCODE ChIP-seq
data confirmed that rs4487645 localizes within an IRF4/PU.
1-binding
motif
ETS/ISRE
(ETS/interferon-stimulated-response-element composite DNA motif)-consensus element
(EICE; 5
0-G[G/T]AANNGAAA-3
0).
No other candidate MM risk variant at the 7p15.3 locus
showed the unique combination of highly significant GWAS and
eQTL signal, open chromatin, active enhancer localization and
transcription factor binding. By analysing the germline exomes of
463 MM cases, we only identified one CDCA7L mutation
(S197Y) in one sequenced individual
12, thus excluding the
possibility that the 7p15.3 association signal is a consequence of
linkage disequilibrium with a rare disease-causing coding variant.
Collectively, these data suggest that rs4487645 is the single best
causal SNP candidate for the 7p15.3 association.
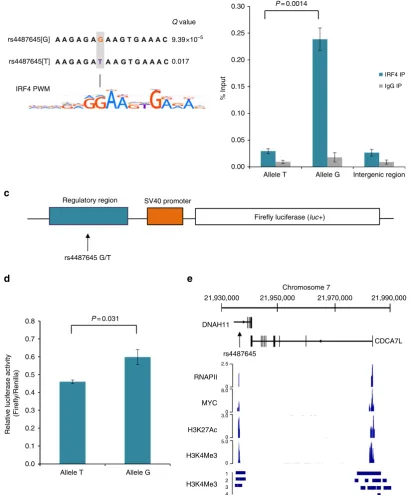
SNP rs4487645 modulates IRF4-binding affinity
. Using Find
Individual Motif Occurrences, we assessed the genomic sequence
overlapping rs4487645 with the DNA-binding position weight
matrices of multiple human transcription factors
13. In this
analysis, the IRF4 position weight matrix was the strongest
match for the sequence overlapping rs4487645, with a preference
for the risk-associated G-allele (G-allele
Q
value
¼
9.39
10
5;
T-allele
Q
value¼
0.017; Fig. 2a). To examine for differential IRF4
binding between the G and T alleles of rs4487645 and its binding
motif, we performed ChIP–qPCR (quantitative PCR) in the
GM11992 lymphoblastoid cell line, which is heterozygous for
rs4487645. The G-allele of rs4487645 showed significant
preferential binding to IRF4 (two-tailed
t
-test,
P
¼
0.0014;
Fig. 2b), supporting a role for rs4487645 in modulating
IRF4-binding affinity on the site of overlap.
SNP rs4487645 is localized within an enhancer element
. We
next performed luciferase reporter assays to determine the effect
of rs4487645 on enhancer activity in the MM cell line KMS11.
Transfection of constructs containing the risk G-allele showed
significant enhancement of normalized luminescence compared
with the T-allele (two-tailed
t
-test,
P
¼
0.031; Fig. 2c,d), consistent
with a model in which the causal risk variant is associated with
increased
CDC7AL
expression.
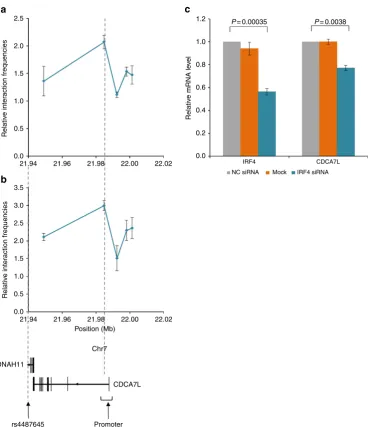
rs4487645 shows long-range interaction with
CDCA7L
promoter
.
Physical interactions between regulatory elements and promoters
have a major role in regulating gene expression
14,15. Following on
from our observation that rs4487645 is within an IRF4-bound
enhancer element, and that rs4487645 and the
CDCA7L
promoter
retain active regulatory chromatin marks (Fig. 2e)
16, we
interrogated using 3C-qPCR whether rs4487645 physically
interacts with the
CDCA7L
promoter in GM11992 and KMS11.
The genomic region to which rs4487645 maps was demonstrated
to form a chromatin-looping interaction with the
CDCA7L
promoter in both cell lines (Fig. 3a,b), suggesting a mechanism by
which IRF4-bound rs4487645 regulates
CDCA7L
expression.
IRF4
regulates
CDCA7L
expression
.
CDCA7L
expression is
significantly correlated with
IRF4
expression in CD138-purified
MM cells (Mann–Whitney–Wilcoxon test,
P
¼
0.0012;
Supple-mentary Fig. 2). To establish a direct relationship between
IRF4
and
CDCA7L
expression, we performed small interfering RNA
(siRNA) experiments in KMS11. Knockdown of
IRF4
was
accompanied by a significant reduction in
CDCA7L
mRNA
(two-tailed
t
-test,
P
¼
0.0038; Fig. 3c and Supplementary Fig. 3).
Collectively, these data are consistent with
CDCA7L
being a
downstream target of
IRF4
in MM, with increased binding of
IRF4 at the G-risk allele of rs4487645 leading to increased
CDCA7L
expression.
and H3K4Me3 chromatin marks and are enriched for MYC
and RNA polymerase II binding in MM1.S cells (Fig. 2e). Since
high levels of
MYC
were associated with high levels of
CDCA7L
in
MM
(Mann–Whitney–Wilcoxon
test,
P
¼
1.32
10
4;
Supplementary Fig. 4), this implies a potential network involving
MYC
,
IRF4
and
CDCA7L
at the 7p15.3 association region. A
significant correlation between
CDCA7L
expression and cellular
proliferation was shown as evidenced by the GPI in German
(
n
¼
658) and US (
n
¼
608) MM data sets (Pearson’s product–
moment correlation,
P
o1.0
10
16; Supplementary Fig. 5).
To directly investigate the effect of
CDCA7L
expression on
malignant phenotype, we knocked down
CDCA7L
levels in
KMS11 using short hairpin RNA (shRNA; Supplementary Fig. 6).
Reduction of
CDCA7L
expression was associated with reduced
cell proliferation (two-tailed
t
-test,
P
o0.05; Fig. 4a,b) and
increased apoptosis (two-tailed
t
-test,
P
o0.05; Fig. 4c,d). We
observed a 39% and 71% increase of apoptotic cells in the
shRNA-CDCA7L-1 and shRNA-CDCA7L-2 knockdown cell
lines, respectively, relative to control. In contrast, there was no
difference between the proportions of cells at different stages of
the cell cycle between
CDCA7L
knockdown and control cell lines
(Supplementary Fig. 7). Following on from this we examined the
impact of
CDCA7L
expression on MM patient outcome in five
independent series totalling 1,573 cases. High levels of
CDCA7L
24
18
12
6
0
DNAH11
CDCA7L
–Log
10
P
21.70 Mb
21,935,000 21,945,000 21,955,000 21,965,000 21,975,000 21,985,000
21.80 Mb 21.90 Mb
chr 7 position (Mb)
22.00 Mb 22.10 Mb
rs4487645
DNAH11
CDCA7L
H3K4Me1
H3K4Me3
H3K27Ac
FAIRE
DNasel HS
IRF4 ChlP-seq 1
IRF4 ChlP-seq 2
ChromHMM
ChromHMM states Active promoter Weak promoter
Weak transcribed
100
0
0
0
0
0
0
0 100
100
0.03
0.15
0.8
0.8
Strong enchancer
Heterochromatin; low signal
Weak/poised enchancer Transcriptional transition/elongation
45 1.0
rs4487645
0.5
r2 35
Recombination r
a
te (cM Mb
–1
)
25
15
5
0
Figure 1 | Genetic mapping and epigenetic landscape at the 7p15.3 locus.Manhattan plot of 7p15.3 is shown with genotyped (triangles) and imputed (circles) SNPs.log10Pvalues (yaxis) of the SNPs are shown according to their chromosomal positions (xaxis; NCBI build 37 of the human genome). The
0.30 P= 0.0014
P= 0.031
0.25
0.20 0.017
% Input
0.15
0.10
0.05
0.00
0.8
0.7
0.6
Relativ
e lucif
er
ase activity
(Firefly/Renilla)
0.5
0.4
0.3
0.2
0.1
0.0
IRF4 IP
IgG IP
Allele T
Regulatory region
rs4487645 G/T
21,930,000
DNAH11
rs4487645
CDCA7L
RNAPII 2.5
0
0
0
0
1 2 3 4 8.0
3.0
5.0 MYC
H3K27Ac
H3K4Me3
H3K4Me3
21,950,000
Chromosome 7
21,970,000 21,990,000 SV40 promoter
Firefly luciferase (luc+)
Q value
rs4487645[G]
rs4487645[T]
IRF4 PWM
9.39×10⁻⁵
Allele G Intergenic region
Allele T Allele G
a
c
d
e
b
expression were associated with poorer overall survival in MM
patients (Cox regression,
P
¼
3.55
10
4, hazard ratio
¼
1.52,
95% confidence interval: 1.21–1.90; Supplementary Fig. 8).
Discussion
Collectively, our data demonstrate that the underlying molecular
mechanism for the 7p15.3 MM risk locus is mediated through
rs4487645, which resides within a transcriptional enhancer and
disrupts an IRF4 transcription factor-binding site. Our data are
compatible with the rs4487645 G-allele, conferring an increased
MM risk through increased IRF4-mediated expression of
CDCA7L
. Furthermore, epigenetic and 3C data are consistent
with rs4487645 localizing within a chromatin contact domain
and forming a ‘loop domain’, which is expected to bring the
region into physical contact with the promoter of
CDCA7L
.
Mechanistically, our data also provide linkage between the G-risk
allele, which is associated with higher expression of
CDCA7L
in
MM, with effects on cell proliferation and response to apoptosis.
In patients the increased tumour proliferation is reflected in a
clinical phenotype characterized by adverse survival.
Importantly, our study highlights a previously unknown
functional interaction between
CDCA7L
and
IRF4
in MM.
IRF4
is a key transcriptional regulator in B-cell development with
critical functions in plasma cells. Moreover,
IRF4
is an essential
MM gene directing a broad expression programme; knockdown
of
IRF4
induces rapid non-apoptotic cell death
17.
IRF4
and
MYC
also form a positive regulatory loop in MM, reinforcing
expression of each other. We demonstrate a correlation
between
MYC
and
CDCA7L
expression in MM patients, and
2.5 1.2 P= 0.00035 P= 0.0038
1.0
0.8
0.6
0.4
0.2
0.0
NC siRNA Mock
IRF4 CDCA7L
IRF4 siRNA 2.0
1.5
1.0
0.5
0.0
3.5
3.0
2.5
2.0
1.5
1.0
0.5
0.0
21.94 21.96 21.98 Position (Mb)
Chr7
CDCA7L
Promoter rs4487645
DNAH11
22.00 22.02
21.94 21.96 21.98 22.00 22.02
Relativ
e
inter
action frequencies
Relativ
e inter
action frequencies
Relativ
e mRNA le
v
e
l
a
b
c
3.0 4.0 5.0 6.0
4.0 5.0 6.0
2.0
1.0
3.0
2.0
1.0
0.0
Nor
maliz
ed cell count
Nor
maliz
ed cell count
0.0
0 20 40
shRNA-NSC
shRNA-NSC
Annexin V-APC
D
API
P= 0.030
P= 0.032
P= 0.011
P= 0.0067 Necrotic
Q1
105
105
25
20
15
% Apoptosis 10
5
0
Late apoptosis Early apoptosis
shRNA -NSC
shRNA-CDCA7L -1
shRNA-CDCA7L -2 104
104 103
103 102
105
104
103
102
105
104
103
102
102 102 103 104 105 102 103 104 105
Q3
Q1
Q3
Q1
Q3 Q4
Q2
Q4 Q2
Q4 Q2
Viable Early apoptosis Viable Early apoptosis Viable Early apoptosis
Necrotic
Late apoptosis Late apoptosis Necrotic Late apoptosis
shRNA-CDCA7L-1
shRNA-CDCA7L-1
shRNA-CDCA7L-2
shRNA-CDCA7L-2
shRNA-NSC shRNA-CDCA7L-1 shRNA-CDCA7L-2
Hours after adding doxycyline
60 80
a
c
d
b
Figure 4 |CDCA7Lknockdown induces cell apoptosis and suppresses cellular proliferation.(a) Data shown are the mean cell counts of viable Trypan-blue-negative cells±s.e.m. for three biological replicates at 24, 48 and 72 h after addition of doxycycline (final concentration 1mg ml1). Data were normalized to initial seeding number at 0 h when doxycycline was added to cells. (b)Pvalues assessing the differences in normalized cell counts between
show that MYC binds to the
CDCA7L
promoter.
CDCA7L
has
been shown to be oncogenic in several cancers, in which MYC
physically interacts and induces expression of
CDCA7L
(refs 8,9).
Moreover,
CDCA7L
potentiates MYC-transforming activity, and
can complement a transformation-defective MYC mutant
6.
In conclusion, we provide compelling evidence of the causal
molecular mechanism for the 7p15.3 association for MM,
implicating a more extensive pathway linking
CDCA7L
,
IRF4
and
MYC
in the development of this malignancy. The importance
of enhancer-mediated
CDCA7L
expression in MM demonstrates
the potential of translating basic mechanistic insights of tumour
initiation towards development of therapeutic strategies. Indeed,
downregulation of
IRF4
in MM has been shown to be central to
potent antitumour activities by immunomodulatory drugs
18,19.
Similarly, bromodomain inhibition of the transcriptional
co-acti-vators CBP/EP300 is seen as a therapeutic strategy to target the
IRF4
network in MM
20. Conclusively, the molecular interactions
behind the 7p15.3 association potentially represent new targetable
components of the MM oncogenesis pathway.
Methods
Ethics
.
Collection of patient samples and associated clinicopathological informa-tion was undertaken with written informed consent and relevant ethical review board approval at respective study centres in accordance with the tenets of the Declaration of Helsinki. Specifically, the MRC Leukaemia Data Monitoring and Ethics committee (MREC 02/8/95, ISRCTN68454111, MREC 17/09/09, ISRCTN49407852), University of Heidelberg Ethical Commission (229/2003, S-337/2009, AFmu-119/2010) and the University of Arkansas for Medical Sciences Institutional Review Board (IRB 202077).ENCODE and chromatin state dynamics
.
To explore the epigenetic profile of association signals, we used DNAse HS, FAIRE, transcription factor ChIP-seq data, histone modifications (H3K4Me1, H3K4Me3 and H3K27Ac) and chromatin state segmentation (ChromHMM) from the ENCODE project in GM12878 (ref. 11). We used HaploReg21and RegulomeDB22to examine whether any of the SNPs or their proxies (that is,r2Z0.8 in the 1000 Genomes EUR reference panel) annotates putative transcription factor binding or enhancer elements. We assessed sequence conservation using GERP23and PhastCons24. We accessed RNA polymerase II, MYC, H3K27Ac and H3K4Me3 ChIP-seq data performed on MM1.S from GSE36354 data set, and MM-unique H3K4Me3 ChIP-seq data in four MM patients compared with normal bone marrow plasma cells from GSE53215 data set.Expression quantitative trait loci analysis
.
eQTL analyses were performed for genes within 1 MB of rs4487645 for CD138-purified plasma cells from 183 MRC Myeloma IX trial patients (GSE21349), 658 Heidelberg patients (E-MTAB-2299) and 608 US patients (GSE2658, GSE31161) using Affymetrix Human Genome U133 2.0 Plus Array10(Supplementary Table 3). Briefly, German, UK and US data were pre-processed separately, followed by analysis using a Bayesian approach to probabilistic estimation of expression residuals to infer broad variance components, accounting for hidden determinants influencing global expression (for example, copy number, translocation status and batch effects). The association between genotype of the sentinel SNP and gene expression of genes within 500 kb either side of rs4487645 was evaluated based on the significance of linear regression coefficients. We pooled data from each of the three studies under a fixed-effects model, controlling for false discovery rate (FDR) and calling significant associations with FDRr0.05. Conditional analysis was performed as described previously10.GPI
.
To investigate the relationship betweenCDCA7Lexpression and proliferation of MM plasma cells, we calculated GPI as recently described25using GC-RMA (GeneChip Robust Multiarray Averaging)-normalized German (n¼658) and US (n¼608) expression data.Relationship between gene expression
.
We assessed the relationship between IRF4andCDCA7Lgene expression (log2-transformed) in five independent MMdata sets GSE9782 (n¼265), GSE2658 (n¼559), GSE19784 (n¼320), E-MTAB-372 (n¼246) and GSE21349 (n¼183). TheCDCA7Lexpression in patients within upper and lower quartiles ofIRF4expression was compared using Mann–Whitney–Wilcoxon test for each data set. To assess the relationship betweenMYCandCDCA7L,CDCA7Lexpression in patients from the top and bottom quartiles ofMYCexpression in the five independent data sets was analysed by Mann–Whitney–Wilcoxon test.Pvalues from the five patient data sets were combined by Fisher’s Method. Statistical tests were conducted using the R software version 3.1.3.
Cell lines
.
Human MM cell line KMS11 was obtained from the American Type Culture Collection (ATCC) and grown in Advanced RPMI 1640 Medium (RPMI) supplemented with GlutaMAX and 10% heat-inactivated fetal bovine serum (FBS). Human lymphoblastoid cell lines GM11992 and GM12878 were obtained from Coriell Institute and grown in RPMI 1640 culture medium supplemented with 15% FBS. HEK293-T17 were obtained from ATCC and grown in DMEM supplemented with 10% heat-inactivated FBS. Cell culture media were obtained from Life Technologies (Carlsbad, CA, USA) and FBS from PAA Laboratories (Pasching, Austria). Cells were cultured at 37°C, 100% relative humidity and 5% CO2. Celllines used were confirmed to be mycoplasma-free (PCR Mycoplasma Test Kit I/C, PromoCell, Heidelberg, Germany). Genotype of rs4487645 in KMS11, GM11992 and GM12878 was confirmed by Sanger sequencing using sequencing primers detailed in Supplementary Table 4.
ChIP–qPCR assay
.
Chromatin from GM11992 was immunoprecipitated with the ChIP-IT Express Enzymatic Kit (Active Motif, Carlsbad, CA, USA), using 3mg anti-IRF4 (sc-6059X; Santa Cruz Biotechnology, TX, USA) and 3mg normal goat IgG antibodies (sc-2028; Santa Cruz Biotechnology) per immunoprecipitation (IP) reaction. Immunoprecipitated chromatin was subjected to real-time qPCR using SYBR Green PCR Master Mix (Life Technologies). qPCR was conducted as follows: 50°C 2 min, 95°C 10 min, 40 cycles of 95°C 15 s, 64°C 1 min, end cycle 95°C 15 s, 60°C 15 s and 95°C 15 s. Each IP was analysed with primers for rs4487645 (G/T) and intergenic control detailed in Supplementary Table 4. Primer efficiencies were corrected with a standard curve from serial dilutions of GM11992 genomic DNA. Data from IRF4 IP and control IP were presented as enrichment relative to input DNA. Each qPCR reaction was performed in three technical replicates, and the statistical significance was calculated over three biological replicates using two-tailedt-test.Plasmid construction and luciferase assays
.
AnB1 kb regulatory region with the non-risk allele of rs4487645 was amplified from human genomic DNA using primers detailed in Supplementary Table 4. Gel-purified PCR products (Qiagen, Hilden, Germany) were A-tailed using 2 U Thermoprime DNA polymerase (ThermoFisher Scientific, Waltham, USA) and 200mM dATP for 30 min at 70°C. The product was cloned into the PCR8/GW/TOPO vector and transformed into Escherichia coli. Single bacterial colonies containing the vector were cultured and purified (Qiagen Mini-prep Kit). The risk allele of rs4487645 was generated with site-directed mutagenesis using Quick Change XL (Agilent, Santa Clara, USA). Regulatory regions with both non-risk and risk alleles were cloned into pGL3 luc2-promoter vector using Gateway LR Clonase II (ThermoFisher Scientific). pGL3luc2constructs were amplified inE. colifollowed by purification of plasmid DNA using the QIAfilter Plasmid Midi Kit (Qiagen). Inserts and site-directed mutagenesis changes were Sanger-sequenced using primers detailed in Supplementary Table 4. The reporter constructs were introduced into KMS11 using nucleofection. In all, 5106cells were resuspended in 100ml Cell Line Nucleo-fector Solution V with 3mg reporter constructs and 60 ng of internal control plasmid (pRL-SV40). Nucleofections were performed using Amaxa Nucleofector I (X-01 programme; Lonza, Basel, Switzerland). Transiently transfected cells were cultured for 24 h, following which the luciferase assay was performed using the Dual-Luciferase Reporter Assay System (Promega, Madison, USA) as per the manufacturer’s recommendations. Firefly and Renilla luciferase luminescence were measured sequentially on a Fluoroskan Ascent FL plate reader (ThermoFisher Scientific). The ratio of luminescence from the experimental reporter to the luminescence from the control reporter was calculated for each sample, defined as the relative luciferase activity. Statistical significance was calculated using two-tailedt-test over three biological replicates.additional ligase and ATP next day (16°C at 900 r.p.m.) as per the protocol with modifications27. Finally, the ligated BAC library was purified with phenol:chloroform:isoamyl alcohol.
Chromatin-looping was interrogated between fragments mapping to rs4487645 and theCDCA7Lpromoter generated from Csp6I digestion using SYBR Green PCR Master Mix (Life Technologies). Forward primers were designed over the ligation junction of a ligation product, with a constant reverse primer from the fragment mapping to rs4487645. Primer sequences are given in Supplementary Table 4. qPCR was conducted as follows: 95°C 10 min, 40 cycles of 95°C 30 s, 68°C 30 s, end cycle 95°C 15 s, 60°C 15 s, 95°C 15 s. Primer normalization was done using the randomly ligated BAC control template. Primers were designed for a region between two Csp6I cut sites (intersite control) to control for loading of each 3C experimental library. Each qPCR reaction was performed with three technical replicates, and the data presented were the average of three biological replicates for each cell line.
siRNA knockdown
.
siRNA targetingIRF4and control siRNA (NC siRNA) were obtained from Eurofins Genomics (Wolverhampton, UK) and detailed in Supplementary Table 4. KMS11 cells were transfected with either 200 nM siRNA or no siRNA (Mock transfections) using nucleofection as described in luciferase assays. Total RNA was extracted 24 h post-transfection using the RNeasy Plus Mini Kit (Qiagen) and reverse-transcribed using the SuperScript First Strand Synthesis Kit (Life Technologies) according to the manufacturer’s recommendations. Knockdown efficiency was assessed using qPCR (1:20 dilution of cDNA as template) and western blotting using the standard protocols. Antibodies against IRF4, CDCA7L andb-actin for western blots are described below. Transcript levels ofIRF4andCDCA7Lexpression were quantified using SYBR Green PCR Master Mix (Life Technologies) and normalized toGAPDH. A standard curve of serial dilutions of KMS11 cDNA was used to normalize for primer efficiencies. qPCR was conducted as follows: 50°C 2 min, 95°C 10 min, 40 cycles of 95°C 15 s, 60°C 1 min, end cycle 95°C 15 s, 60°C 15 s and 95°C 15 s. Each qPCR reaction was performed with three technical replicates. Statistical significance was calculated using two-tailedt-test over three biological replicates. Primer sequences are detailed in Supplementary Table 4.Lentiviral transduction of shRNAs
.
Lentivirus constructs were produced by transient transfection of HEK293-T17 cells as described previously28,29. Briefly, HEK293-T17 was co-transfected with the pTRIPZ-based shRNA vectors, pCMVR8.47 and pMD2.G by calcium phosphate precipitation. pTRIPZ-based doxycycline-inducible lentiviral vectors, V2THS_26553 (shRNA-CDCA7L-1 in Fig. 4) and V2THS_26555 (shRNA-CDCA7L-2) forCDCA7Lknockdown, and non-silencing negative control RHS4743 (shRNA-NSC) were obtained from GE Healthcare Dharmacon (Little Chalfont, UK). The lentivirus particles were harvested, concentrated with Lenti-X Concentrator (Clonetech, Mountain View, USA) and used to infect KMS11. Transduced KMS11 were selected with 1mg ml1puromycin. The shRNA was induced from a tetracycline-inducible promoter with 1mg ml1doxycycline (Sigma, St Louis, USA). Expression of CDCA7Lwas assessed using qPCR and western blotting every 24 h post induction with doxycycline, with the optimal knockdown efficiency observed at 72 h.Western blotting
.
Transduced KMS11 fromIRF4orCDCA7Lknockdown were collected and lysed in RIPA buffer (1% w/v sodium deoxycholate, 1% v/v Triton X-100, 1% v/v Nonident P-40, 0.1% SDS, 150 mM NaCl, 50 mM Tris pH 8.0 and 30 mM NaF) supplemented with Complete Protease inhibitor cocktail (Roche). Protein concentrations were determined with the BCA Protein Assay Kit (ThermoFisher Scientific). Ten micrograms of each protein lysate were loaded on NuPAGE Novex 10% Bis-Tris Protein Gels (ThermoFisher Scientific) and run in 1NuPAGE MOPS SDS Buffer (ThermoFisher Scientific). Proteins were transferred to polyvinylidene difluoride membranes in iBlot2 Transfer Stacks (ThermoFisher Scientific) using the P0 programme of the iBlot2 Blotting System (ThermoFisher Scientific) according to the manufacturer’s recommendations. Western blotting was performed with anti-IRF4 (1:500 in 5% milk; sc-6059; Santa Cruz Biotechnology), anti-CDCA7L (1:2,000 in 5% BSA; A300-846A; Bethyl Laboratories, Montgomery, USA) or anti-b-actin (1:10,000 in 5% BSA; A5441; Sigma), and then with either anti-goat-HRP (horse radish peroxidase; 1:10,000 in 5% milk; ab97110; Abcam, Cambridge, UK), anti-mouse-HRP (1:5,000 in 5% milk; 7076S; New England Biolabs) or anti-rabbit-HRP (1:5,000 in 5% milk; 7074S; New England Biolabs). The EZ-ECL Chemiluminescence Detection Kit for HRP (Gene Flow, Lichfield, UK) was used for protein detection on the Fujifilm LAS-4000 Luminescent Image Analyser (GE Healthcare).Cell viability assays
.
KMS11 transduced with CDCA7L-1, shRNA-CDCA7L-2 or shRNA-NSC were plated at 30,000 cells ml1. shRNA expression was induced with the addition of 1mg ml1doxycycline att¼0 h. Cell viability was measured every 24 h by Trypan Blue exclusion and cytometry. In transduced KMS11 cells apoptosis was estimated using Annexin V/DAPI double staining assay Kit I (BD Biosciences, San Jose, USA) after 72 h induction following the manufacturer’s recommendations. Samples were analysed using a BD LSRII flow cytometer (BD Bioscience).Cell cycle analysis
.
After 72 h doxycycline induction-transduced KMS11 cells were fixed in 1 ml ice-cold 70% ethanol for 15 min, and then washed and resus-pended in 860ml PBS, 100ml RNase (1 mg ml1; Sigma) and 40ml PI (1 mg ml1; Sigma). After incubation at 37°C for 25 min, cells were analysed on a BS LSRII flow cytometer (BD Bioscience).Association betweenCDCA7Lexpression and patient outcome
.
To examine the relation betweenCDCA7Lexpression and patient outcome, we made use of data from five independent patient cohorts GSE9782 (n¼265), GSE2658 (n¼559), GSE19784 (n¼320), E-MTAB-372 (n¼246) and GSE21349 (n¼183). For each data set, the patients were grouped by theirCDCA7Lexpression (upper and lower quartiles). Analysis was performed using the log-rank test to estimate expression-associated hazard ratio and the 95% confidence interval. Overall tatistical significance tests were performed by combining the results for each data set under a fixed-effects model. Statistical test was conducted on R software version 3.1.3.Data availability
.
Existing patient expression data that support the findings of this study are deposited in GEO with accession codes GSE21349, GSE2658, GSE31161, GSE9782, GSE19784, and in EMBL-EBI with accession code E-MTAB-2299, E-MTAB-372.ChIP-seq data that support the findings of this study are deposited in GEO with accession codes: GSE36354, GSE53215, GSE32465 and GSE29611.
Epigenomic profiling data that support the findings of this study are deposited in GEO with accession codes: DNaseI HS and FAIRE: GSE40833,ChromHMM: GSE38163.
Sequence data that support the findings of this study are deposited in EGA with accession code: EGAS00001001147. The remaining data are available within the Article and Supplementary Information files or available from the authors upon request.
References
1. Edwards, S. L., Beesley, J., French, J. D. & Dunning, A. M. Beyond GWASs: illuminating the dark road from association to function.Am. J. Hum. Genet.93, 779–797 (2013).
2. Broderick, P.et al.Common variation at 3p22.1 and 7p15.3 influences multiple myeloma risk.Nat. Genet.44,58–61 (2012).
3. Chubb, D.et al.Common variation at 3q26.2, 6p21.33, 17p11.2 and 22q13.1 influences multiple myeloma risk.Nat. Genet.45,1221–1225 (2013). 4. Swaminathan, B.et al.Variants in ELL2 influencing immunoglobulin levels
associate with multiple myeloma.Nat. Commun.6,7213 (2015). 5. Mitchell, J. S.et al.Genome-wide association study identifies multiple
susceptibility loci for multiple myeloma.Nat. Commun.7,12050 (2016). 6. Huang, A.et al.Identification of a novel c-Myc protein interactor, JPO2, with
transforming activity in medulloblastoma cells.Cancer Res.65,5607–5619 (2005).
7. Zhou, L.et al.Silencing of thrombospondin-1 is critical for myc-induced metastatic phenotypes in medulloblastoma.Cancer Res.70,8199–8210 (2010). 8. Maertens, G. N., Cherepanov, P. & Engelman, A. Transcriptional co-activator p75 binds and tethers the Myc-interacting protein JPO2 to chromatin.J. Cell Sci.119,2563–2571 (2006).
9. Ou, X. M., Chen, K. & Shih, J. C. Monoamine oxidase A and repressor R1 are involved in apoptotic signaling pathway.Proc. Natl Acad. Sci. USA103, 10923–10928 (2006).
10. Weinhold, N.et al.The 7p15.3 (rs4487645) association for multiple myeloma shows strong allele-specific regulation of the MYC-interacting gene CDCA7L in malignant plasma cells.Haematologica100,e110–e113 (2015).
11. The ENCODE Project Consortium. An integrated encyclopedia of DNA elements in the human genome.Nature489,57–74 (2012).
12. Walker, B. A.et al.APOBEC family mutational signatures are associated with poor prognosis translocations in multiple myeloma.Nat. Commun.6,6997 (2015). 13. Kulakovskiy, I. V.et al.HOCOMOCO: expansion and enhancement of the
collection of transcription factor binding sites models.Nucleic Acids Res.44, D116–D125 (2016).
14. Rao, S. S.et al.A 3D map of the human genome at kilobase resolution reveals principles of chromatin looping.Cell159,1665–1680 (2014).
15. Mifsud, B.et al.Mapping long-range promoter contacts in human cells with high-resolution capture Hi-C.Nat. Genet.47,598–606 (2015).
16. Lin, C. Y.et al.Transcriptional amplification in tumor cells with elevated c-Myc.Cell151,56–67 (2012).
17. Shaffer, A. L.et al.IRF4 addiction in multiple myeloma.Nature454,226–231 (2008).
18. Lopez-Girona, A.et al.Lenalidomide downregulates the cell survival factor, interferon regulatory factor-4, providing a potential mechanistic link for predicting response.Br. J. Haematol.154,325–336 (2011).
20. Conery, A. R.et al.Bromodomain inhibition of the transcriptional coactivators CBP/EP300 as a therapeutic strategy to target the IRF4 network in multiple myeloma.eLife5, e19432 (2016).
21. Ward, L. D. & Kellis, M. HaploReg: a resource for exploring chromatin states, conservation, and regulatory motif alterations within sets of genetically linked variants.Nucleic Acids Res.40,D930–D934 (2012).
22. Boyle, A. P.et al.Annotation of functional variation in personal genomes using RegulomeDB.Genome Res.22,1790–1797 (2012).
23. Cooper, G. M.et al.Distribution and intensity of constraint in mammalian genomic sequence.Genome Res.15,901–913 (2005).
24. Siepel, A.et al.Evolutionarily conserved elements in vertebrate, insect, worm, and yeast genomes.Genome Res.15,1034–1050 (2005).
25. Meissner, T.et al.Gene expression profiling in multiple myeloma--reporting of entities, risk, and targets in clinical routine.Clin. Cancer Res.17,7240–7247 (2011).
26. van de Werken, H. J.et al.4C technology: protocols and data analysis.Methods Enzymol.513,89–112 (2012).
27. Schoenfelder, S.et al.The pluripotent regulatory circuitry connecting promoters to their long-range interacting elements.Genome Res.25,582–597 (2015).
28. Zufferey, R., Nagy, D., Mandel, R. J., Naldini, L. & Trono, D. Multiply attenuated lentiviral vector achieves efficient gene deliveryin vivo.Nat. Biotechnol.15,871–875 (1997).
29. Wiznerowicz, M. & Trono, D. Conditional suppression of cellular genes: lentivirus vector-mediated drug-inducible RNA interference.J. Virol.77, 8957–8961 (2003).
Acknowledgements
Myeloma UK provided principal funding. Additional funding was provided by Blood-wise, Cancer Research UK (C1298/A8362 supported by the Bobby Moore Fund), The Rosetrees Trust, Dietmar Hopp Foundation and the German Ministry of Education and Science (BMBF: CLIOMMICS (01ZX1309).
Author contributions
N.L., D.C.J. and R.S.H. drafted the manuscript; N.L., D.C.J. and R.S.H. designed the study; R.S.H. and G.J.M. obtained funding; N.L., J.B.S., G.O. and F.M. performed laboratory work; H.G., G.J.M., K.H. and M.K. performed sample ascertainment and provided data; N.L., D.C.J., J.S.M., T.M. and N.W. performed bioinformatics and statistical analyses. All authors contributed to the final manuscript.
Additional information
Supplementary Informationaccompanies this paper at http://www.nature.com/ naturecommunications
Competing financial interests:The authors declare no competing financial interests.
Reprints and permissioninformation is available online at http://npg.nature.com/ reprintsandpermissions/
How to cite this article:Li, N.et al.Multiple myeloma risk variant at 7p15.3 creates an IRF4-binding site and interferes withCDCA7Lexpression.Nat. Commun.7, 13656 doi: 10.1038/ncomms13656 (2016).
Publisher’s note:Springer Nature remains neutral with regard to jurisdictional claims in published maps and institutional affiliations.
This work is licensed under a Creative Commons Attribution 4.0 International License. The images or other third party material in this article are included in the article’s Creative Commons license, unless indicated otherwise in the credit line; if the material is not included under the Creative Commons license, users will need to obtain permission from the license holder to reproduce the material. To view a copy of this license, visit http://creativecommons.org/licenses/by/4.0/