Data Mining for Traffic Prediction and
Analysis using Big Data
Rahul Khokale#1, Ashwini Ghate*2
#
Assistant Professor & Head, Department of Computer Science & Engg. PIGCE, Nagpur (India) *Assistant Professor, Department of Computer Science & Engg. PIGCE, Nagpur (India)
Abstract — Today we are living in a data-driven world. Developments in data generation, gathering and storing technology have empowered organizations to gather data sets of massive size. Data mining is a term that blends traditional data analysis methods with cultured algorithms to handle the tasks stood by these new forms of data sets. This paper is a comparative analysis of various Data Mining of traffic data using big data, visualization and data mining techniques to predict and analyse traffic. Wireless sensor networks are a technology which has played a massive role enabling a Smarter City cities is using this technology to gather data related to traffic. The objective is to have a complete infrastructure that enable the monitoring of traffic behaviours so decisions on city development can be made in a smarter way. The work exploring the application of data mining tools to support in the progress of traffic signal judgement devices. The cluster analysis approach is able to apply a high-resolution system state description that takes advantage of the wide-ranging set of sensors arranged in a traffic signal system.
Keywords— Data Mining, Time of Day (TOD), Hierarchical Clustering
I. INTRODUCTION
In recent years the collection of information on traffic volumes has become a significant portion of the work of road planning programs in terms of both cost and personnel. Traffic data is partitioned into different regimes by identifying breakpoints for traffic variables in the data. In two-regime traffic models, critical occupancy is used to separate free flow and congested flow conditions. Observations with occupancy values smaller than critical occupancy are assumed to be in the free flow regime and observations with occupancy values greater than critical occupancy are assumed to be in the congested flow regime. Identifying the critical occupancy value from field observations is not trivial. Data mining is the process of discovering interesting knowledge, such as patterns, associations, changes, anomalies and significant structure from large amounts of data stored in databases, data warehouses, or other information repositories.
A case study was shown to prove that the use of tiered cluster study can be cast-off to routinely find time-of-day (TOD) breaks, based on the facts that
care the plan of a TOD signal controller system. The group investigation tactic is able to apply a high-resolution system state that takes full benefit of the widespread set of instruments positioned in a traffic signal system and group validation chains the premises accessible.
Intelligent transportation system (ITS) contains large figures of traffic radars that assemble huge numbers of data in an effort to offer data for the sustenance and development of gesture timing actions. Progressive forms of signal control, such as another and third group control, are reliant on on the device data complete by ITS.
II. LITERATURE REVIEW
This sector analyses the art in reflex tactics for creation flow rental number and appraisals the valid requests of design credit in traffic industrial. Pattern credit and gathering methods have remained used in many parts of conveyance corporate. Clustering methods are used to divider traffic flow data into free current and jammed flow. The grouping procedure outcome is used to create deterioration hysterics and to grow a flow-occupancy diagram. The typical method used toward classify breaks for TOD schemes is to strategy collective circulation sizes over the course of a day, and then usage ruling in the documentation of important changes in traffic capacity at the serious joint that designate a need for a diverse timing plan. It is vital to note that the volumes used to identify TOD intervals are bi-directional aggregate volume values form the critical intersection, consequently overlooking traffic situations at remaining connections. The use of an AM, Mid-day, PM and off top retro is a representative TOD period collection for transitioning between plans. Obviously, the current exercise of using solitary day, hand-counted volumes to define the state for time-of-day (TOD) plan growth may be scarce. Given that considerably more information is available to use in defining the stage of the system in electronic form, cluster analysis allows for a more complete state definition. This state definition is based on a advanced form of data existing from the system sensors to recognize TOD pauses and progress more fitting judgment plans.
Li and Zhang (2011) suggest a method for creating flow-occupancy diagram. In the first step, circulation data is divided to free flow and overfilled flow based on features of variations in traffic data time series. Next, a minimum code method is used to classify symmetry states tailed by the claim of a mixed
integer optimization method to create piecewise lined flow-occupancy fits. The main importance of the optimization procedure is to get fits with minimum total eccentricity.
Sun and Zhou (2005) apply gathering methods in the showing of multi-regime speed-density relations. Clustering techniques are used to recognize the failure points in a density diagram, speed-density data is then divided based on the recognized divides, and wrinkled return methods is used to create multi regime speed-density relations. K-means gathering procedure is applied to three data sets from three artery sections in San Antonio, Texas. Speed-density data is then grouped to two and three groups.
Xia and Chen (2007) categorize throughway working settings using an agglomerative gathering algorithm. Flow, speed, and tenancy data from a expressway sensor in California are used as a case study. Bayesian Information Criterion (BIC) and dispersal measurement techniques are used to recognize the number of clusters. The analysis propose that each cluster could represent a expressway flow phase.
Azimi and Zhang (2010) Traffic data is partitioned to six clusters, and the outputs are compared with Highway Capacity Manual thresholds for level of service.
While all of this approach can’t use for traffic regulatory and all types of road system. There is no any singular device to intellect the circulation data by that man power only gathering capacity of circulation data so this procedure will take extra time this is the first tricky in current scheme by the traffic sensor device can easily evade this tricky for physically gathering volume of traffic data easy to variation the system from static to dynamic so any time can easily gather the traffic data for choice making purpose and can avoid the attractive more time. Second problem there is no special data base to packing the size of traffic data by using special data base can easily avoid this problem and can store the bulk of circulation data from device any time animatedly so very easy to recap the traffic data for decision making purpose.
Framework for clustering traffic data
Clustering techniques can be used to enable the process of dividing traffic data into free movement and jammed flow datasets. However, bunching systems are not fully programmed, and the user has to select the number of clusters and the input variables for each grouping technique.
Big data gives us four terms to handle the large volume of data i.e. volume, velocity, variety and veracity.
database system perform searching competently through another device called Indexing
Velocity of traffic data for this system was deliver in at real-time. Again Map Reduce and Indexing was used to process and store the data.
Variety of the data sources traffic, climate and twitter contain data types such as timestamps, geo-spatial, cords and integers. The database system called MongoDB was used and provided for these needs.
Veracity in this case is the storing the data in training for analysis.The method in big data schemes is divide and conquer. MongoDB considers the tasks of the four V’s [6] and licenses worker’s device a project in such a way that data can be stored and recovered professionally. NoSQL is trivial Big Data database which gears the solution for the database design making guides is critical. These calendars allow for the system to divide a group into parts. In the background the database the gatherings are being bunched and an catalog table is then created for plotting data and its location on the file system. Traditional database systems are planned to activate on a single machine. This offers a control to the scalability of the key as volume is limited. The use of request and growth performs have become supple, as making have grown onto the cloud for multi-tenet user base the database needs to grow flat the more workers there are using the system. Big data will also give a marvelous platform to user in companies to work, by providing the great data bases.
III. RELATED WORK
A. BIG DATA SOLUTION OVER TRAFFIC
ANALYSIS AND MONITORING
T
he real-time processing capabilities of big data can accurately probe traffic accidents, its prognostic ability can effectively predict the occurrence of traffic incident, using microwave detection systems, video surveillance systems, mobile detection system, we can build an effective security model to improve the safety of vehicles. When security incident sharpened, and emergency rescue needed, Because of its inclusive processing and decision-making ability, quick reply skill, big data can greatly recover the capability of emergency rescue, and reduce casualties and property losses.B. ARCHITECTURE OF INTELLIGENT
TRANSPORTATION ON BIG DATA
PLATFORM
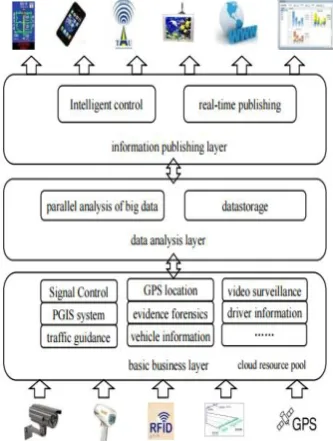
Intelligent transportation system on big data platform is a combination of multiple systems, models, department, technology. It can be said, It is a comprehensive system of system science,
management science, mathematics, economics, behavioral science, and information technology. From the architecture, the platform includes basic business layer, data analysis layer and information publishing layer. As shown in Figure 1.
The basic business layer is the foundation of data analysis layer and information publishing layer, its main function is to complete the basic work of the various business units, and to produce basic business data. It includes traffic information collection system, signal control systems, video surveillance systems, illegal evidence forensics system, 122 alarm receive and dispose system, GPS vehicle location tracking system, traffic guidance system, vehicle information management system, driver information management system, PGIS
Fig 2: Architecture of Intelligent Transportation on Big Data Platform
ecosystem, use commercial cheap server as hardware platform, use the open-source Linux as operating system. The information publishing layer according the result of the data analysis layer, publishes traffic conditions to public, business units, industry executives, etc. by internet, mobile terminal, desktop application, report, for their travel and business decisions. It is necessary for friendly interface, operating easily, rich feature. The information published include traffic condition, traffic warning, data charts for decision. With the development of the times, publishing channels become diversified, changed from traffic radio and information bulletin board to today's traffic radio, mobile TV, microblog, WeChat, information bulletin board and other forms and channels. By providing technical approach big data applied to the transportation industry have following advantages:
1. To handle large amount of data traffic monitoring system, use the big data technology
Big data resolve the difficulties such as data storage, data analysis and data management. Hadoop system is developed to handle the large amount of data. This complete information can be stored on different nodes. A particulate set of nodes are divided into the tasks. Each task is subdivided into different sub tasks, and can be complete with Map Reduce model. more control model of application, has a great deal of equipment, if a little accident occurred, the entire system will run into inefficient state, after using big data technology, the information system can process the data and discover the accident in good time, automatically handle it, or reported to the management staff and ask them to make decisions. Big data has a good predictive ability, it can reduce the probability of false alarm and under reporting of traffic incidents.
2. Big data can improve the efficiency of transportation industry:
Transportation industry, involving many aspects of work, need to handle massive amounts of data, has 3. Big data can improve the safety level of traffic: The real-time processing capabilities of big data can accurately probe traffic accidents, its predictive ability can effectively predict the occurrence of traffic incident, using microwave detection systems, video surveillance systems, mobile detection system, we can build an effective security model to improve the safety of vehicles.
4. Querying the travel path of a vehicle:
Enquiring the travel path of a vehicle has an significant role in the public security enquiry work at a specific period of time. This work needs a lot of manpower, to hunt the surveillance video day and dark, to look for mistrustful busses manually, then the travel path of the vehicle is drawn manually. Now, ITS can resolve this problem competently, the knife can find and greatest the plat quantity of the transient vehicle, except it into H Base, catalogue on plat quantity and transient time, when asking the travel path, arrive the start while and end while, then an neat data set is refunded, now we canister draw the foldaway path very wild giving it, it can reach the another level.
5. Checking and controlling the fake vehicles: The fake vehicles, we call it clone vehicle, its plate number, type, color, even credentials are the same as the true vehicle, its harmfulness is obvious. The police carried out its strict management and control to identify the fake vehicle, fully relying on personal experience before, the police can touch the plat, enquire the driver, query the information of the vehicle and driver.
IV.CONCLUSIONS
In this paper, we discuss the different traffic monitoring by using big data transportation industry, and advantages of big data used in the transportation industry. Then propose an architecture of intelligent transportation system on big data platform, at last, we discuss the key technology in ITS. The cluster analysis approach is able to utilize a high-resolution system state definition that takes full advantage of the extensive set of sensors deployed in a traffic signal system and cluster validation supports the hypotheses presented. The use of data mining technique for hierarchical clustering algorithm that used to automatically generate TOD intervals and plans for signal plan development directly benefits transpiration engineering, while the application of cluster analysis as a basis for real-time control benefits the systems engineering field. From the research presenting here, the timing plan development and maintenance process can be replicated and automated.
REFERENCES
[1] Xiaoyan ,―Data Mining Based Algorithm for Traffic Network Flow Forecasting‖ , IEEE, 2003.
[2] C. Y. Fang et. al. ― A System to Detect Complex Motion of Nearby Vehicles on Freeways‖ , IEEE, 2003, pp. 1122 – 1127 .
[3] J.Han and M.Kamber, ―Data Mining: Concepts and Techniques,‖ Morgan Kaufmann Publishers, San Francisco, CA, 2006. ISBN: 1-55860-489-8.
[4] JemalAbawajy. Comprehensive analysis of big data variety landscape.International Journal of Parallel, Emergent and Distributed Systems.2015,30(1):5-14.
[5] Ana L.C. Bazzan, FranziskaKlügl. Introduction to Intelligent Systems in Traffic and Transportation. Synthesis Lectures on Artificial Intelligence and Machine Learning. 2013,7(3).
[7] Wei Shi, Jian Wu, Shaolin Zhou, Ling Zhang. Variable message sign and dynamic regional traffic guidance. Intelligent Transportation Systems Magazine, IEEE. 2009,1(3):15-21.
[8] EPJ Data Science. Personalized routing for multitudes in smart cities.EPJ Data Science.2015,4(1).
[9] Yuan Yuan Zhang, Shi Song Yang, Qing Cai, Peng Sun. Traffic Flow Forecasting Based on Chaos Neural Network. Applied Mechanics and Materials.2010,20-23:1236-1240. [10] Muhammad Rauf, Ahmed N. Abdalla,
AzharFakharuddin;Elisha. Response Surface Methodology in-Cooperating Embedded System for Bus’s Route Optimization. Research Journal of Applied Sciences, Engineering and Technology.2013,5(22):5170-5181.
[11] Cueva-Fernandez, Guillermo, Espada, JordánPascual, etc. An expert system for vehicle sensor tracking and managing application generation. Journal of Network & Computer Applications.2014,42:178-188.
[12] Filippo, L., Rindt C. R., McNally, M. G. and Ritchie, S. G. (2001). TRICPS /CARTESIUS: