ScholarlyCommons
Publicly Accessible Penn Dissertations
2018
Measuring Preferences For Uncertainty
Robert MislavskyUniversity of Pennsylvania, [email protected]
Follow this and additional works at:https://repository.upenn.edu/edissertations
Part of theEconomics Commons
This paper is posted at ScholarlyCommons.https://repository.upenn.edu/edissertations/2744
For more information, please [email protected].
Recommended Citation
Mislavsky, Robert, "Measuring Preferences For Uncertainty" (2018).Publicly Accessible Penn Dissertations. 2744.
Abstract
Understanding decision making under uncertainty is crucial for researchers in the social sciences,
policymakers, and anyone trying to make sense of another’s (or their own) choices. In this dissertation, my coauthors and I make three contributions to understanding preferences for uncertainty regarding (a) how preferences are measured, (b) how these preferences may (or may not) manifest in a consequential real-world context, and (c) how different types of advice influence opinions about uncertain events. In Chapter 1, we examine methods that researchers use to study preferences for uncertainty. We find that the presence of uncertainty is often confounded with the presence of “weird” transaction features, dramatically overstating the presence of uncertainty aversion in these experiments. In Chapter 2, we show that extreme uncertainty does not exist in the context of corporate experimentation, despite speculation by pundits and researchers. In fact, people judge experiments similarly to how they would judge simple gambles, with the experiment being judged near the “expected value” of the policies it implements. In Chapter 3, we find that the format in which uncertainty is presented impacts how people combine forecasts from multiple sources. Numeric probability forecasts are averaged, while verbal forecasts are combined additively, with people making more extreme judgments as they see additional forecasts.
Degree Type
Dissertation
Degree Name
Doctor of Philosophy (PhD)
Graduate Group
Operations & Information Management
First Advisor
Uri Simonsohn
Keywords
judgment and decision making, risk preferences
Subject Categories
Economics | Social and Behavioral Sciences
Robert Aron Mislavsky
A DISSERTATION
in
Operations, Information and Decisions
For the Graduate Group in Managerial Science and Applied Economics
Presented to the Faculties of the University of Pennsylvania
in
Partial Fulfillment of the Requirements for the Degree of Doctor of Philosophy
2018
Supervisor of Dissertation
_____________________
Uri Simonsohn
Professor of Operations, Information and Decisions, Professor of Marketing
Graduate Group Chairperson
______________________
Catherine Schrand, Celia Z. Moh Professor, Professor of Accounting
Dissertation Committee:
Joseph Simmons, Associate Professor of Operations, Information and Decisions
DEDICATION
ACKNOWLEDGMENTS
My five years here have convinced me that the Wharton Decision Processes group
is the best place in the world to do decision-making research. As a result, there are too
many people to acknowledge in a relatively short space, but I’ll do my best.
First and foremost, I would like to thank my advisor, Uri Simonsohn, for his
guidance, encouragement, patience, and general thoughtfulness throughout my career.
Berkeley Dietvorst (Chapter 2) and Celia Gaertig (Chapter 3) have been terrific
collaborators on this dissertation and even better friends.
I am grateful to the rest of the faculty and students in the group who have been
great role models and friends. In particular, I would like to thank Joe Simmons, Deb
Small, Katy Milkman, Maurice Schweitzer, Brad Bitterly, and Shalena Srna.
John Sperger, Sara Sermarini, Sargent Shriver, Laura Kuder, Johanna
Matt-Navarro, and Catherine O’Donnell provided valuable research assistance, and the
Wharton Behavioral Lab and Wharton Risk Center provided important financial support.
I would not have made it here at all without Erich Studer-Ellis, Carey
Morewedge, Eyal Pe’er, and Colleen Giblin, who gave me a great introduction to
academic life and research.
Finally, none of this would have been possible without my family’s love, support,
ABSTRACT
MEASURING PREFERENCES FOR UNCERTAINTY
Robert Mislavsky
Uri Simonsohn
Understanding decision making under uncertainty is crucial for researchers in the social
sciences, policymakers, and anyone trying to make sense of another’s (or their own)
choices. In this dissertation, my coauthors and I make three contributions to
understanding preferences for uncertainty regarding (a) how preferences are measured,
(b) how these preferences may (or may not) manifest in a consequential real-world
context, and (c) how different types of advice influence opinions about uncertain events.
In Chapter 1, we examine methods that researchers use to study preferences for
uncertainty. We find that the presence of uncertainty is often confounded with the
presence of “weird” transaction features, dramatically overstating the presence of
uncertainty aversion in these experiments. In Chapter 2, we show that extreme
uncertainty does not exist in the context of corporate experimentation, despite speculation
by pundits and researchers. In fact, people judge experiments similarly to how they
would judge simple gambles, with the experiment being judged near the “expected value”
of the policies it implements. In Chapter 3, we find that the format in which uncertainty is
presented impacts how people combine forecasts from multiple sources. Numeric
probability forecasts are averaged, while verbal forecasts are combined additively, with
TABLE OF CONTENTS
DEDICATION ... ii
ACKNOWLEDGMENTS ... iii
ABSTRACT ... iv
LIST OF TABLES ... vi
LIST OF FIGURES ... vii
INTRODUCTION ...1
CHAPTER 1. When Risk is Weird ...4
Abstract ...4
Introduction ...5
Studies 1-3 ...9
Study 4 ...14
Study 5A ...18
Study 5B...19
Study 6 ...20
General Discussion ...24
Appendix ...31
CHAPTER 2. Critical Condition ...32
Abstract ...32
Introduction ...33
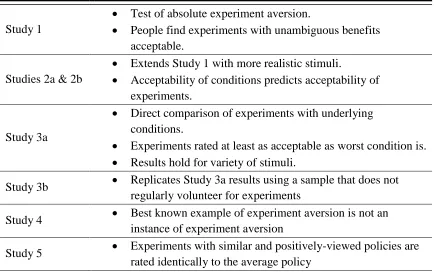
Study 1 ...38
Study 2A ...44
Study 2B...46
Study 3A ...47
Study 3B...50
Study 4 ...53
Study 5 ...56
General Discussion ...58
CHAPTER 3. 60% + 60% = 60%, but Likely + Likely = Very Likely ...63
Abstract ...63
Introduction ...64
Study 1 ...68
Study 2 ...70
Study 3 ...72
Study 4 ...75
General Discussion ...78
LIST OF TABLES
TABLES IN CHAPTER 1
Table 1. Index of supplementary materials ...30
TABLES IN CHAPTER 2
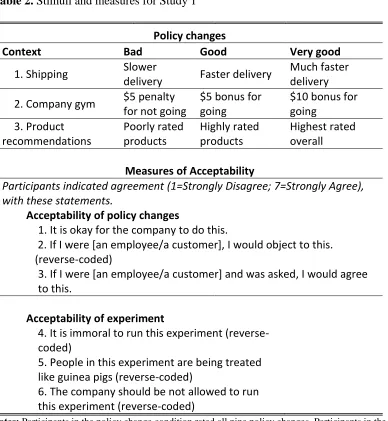
Table 2. Stimuli and measures for Study 1 ...40 Table 3. Overview of study design and contributions ...45 Table 4. Index of supplementary materials ...62
TABLES IN CHAPTER 3
LIST OF FIGURES
FIGURES IN CHAPTER 1
Figure 1. Average valuations (Studies 1-3) as a function of risk and weirdness ...14 Figure 2. Prior uncertainty effect studies are weirder than their baseline comparisons ....21
FIGURES IN CHAPTER 2
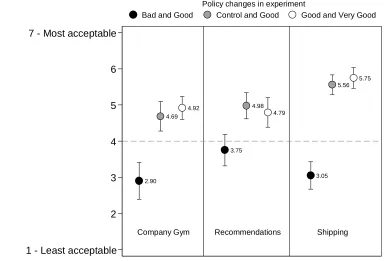
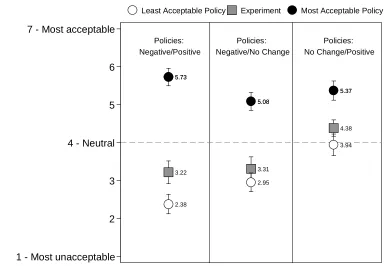
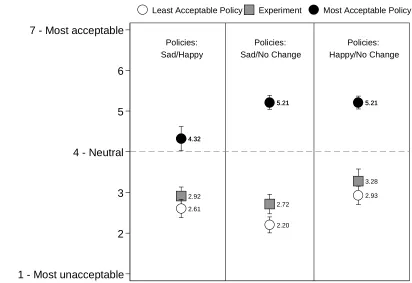
Figure 3. Experiments without bad policies are rated positively (Study 1) ...43 Figure 4. Experiments are no less acceptable than their least acceptable condition ...51 Figure 5. Facebook experiments are no less acceptable than their least acceptable
condition ...55
FIGURES IN CHAPTER 3
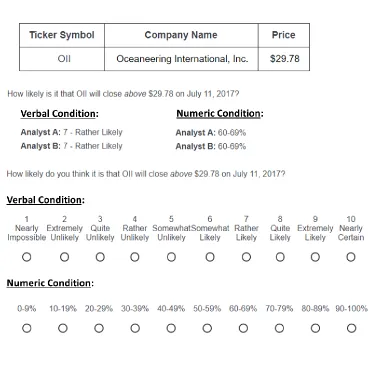
Figure 6. Sample Study 1 stimuli and response scale ...69 Figure 7. Participants’ forecasts become more extreme when they see additional forecasts
INTRODUCTION
Understanding decision making under uncertainty is crucial for researchers in the
social sciences, policymakers, and anyone trying to make sense of another’s (or their
own) choices. In this dissertation, my coauthors and I make three contributions to
understanding preferences for uncertainty. First, we examine how preferences for
uncertainty are typically measured, finding that many common methods may overstate
the presence of uncertainty aversion in experiments. Second, we test preferences for
uncertainty in a consequential real-world context, corporate experimentation, where a
company’s employees and customers are randomly assigned to different outcomes.
Finally, we show that when presented with multiple forecasts for uncertain events, people
combine these forecasts differently depending on whether they are provided numerically
or verbally, resulting in potentially drastic differences in internal judgments of an event’s
uncertainty. Taken together, our findings have consequences for researchers,
organizational decision makers and policymakers, and individuals, which we discuss
throughout.
In the first chapter of my dissertation, “When Risk is Weird: Unexplained
Transaction Features Lower Valuations,” we examine a potential cause of a major
behavioral anomaly in risk preference, the uncertainty effect (Gneezy, List, & Wu, 2006).
Although prior research on the uncertainty effect finds the introduction of risk causes
substantial violations of the internality axiom, where participants value a gamble less
“weird” transaction features. In typical risk preference studies, valuations of risky
gambles are typically compared to valuations of certain outcomes. However, risky
gambles often include additional features, such as purchasing a lottery ticket or flipping a
coin, whereas the certain outcomes do not. We propose that an aversion to weird features,
rather than uncertainty itself, drives the extreme risk aversion found in paradigms such as
the uncertainty effect. As a result, we believe that these studies typically overstate the
presence of risk aversion. In an incentivized experiment under high stakes, participants
are essentially risk neutral when comparing gambles with “weird” transaction features to
certain outcomes that have the same transaction features.
In the second chapter, “Critical Condition: People Only Object to Corporate
Experiments If They Object to a Condition,” we investigate preferences for uncertainty in
a consequential real-world context—corporate experimentation. Although
experimentation is one of the most effective tools for determining the impact of a given
policy, which could allow organizations to test whether certain policies are beneficial
before rolling them out more broadly, there is a widespread perception that people dislike
corporate experimentation as a general rule (e.g., M. N. Meyer, 2015; M. N. Meyer &
Chabris, 2015). If such “experiment aversion” exists, it could severely hamper the ability
of researchers to learn about the world and test theories in real-world settings. However,
in 5 studies, we show that a general experiment aversion does not exist. Rather, people
dislike experiments only when they dislike a specific policy that the experiment
implements. Further, people evaluate experiments with an objectionable policy more
In the final chapter, “60% + 60% = 60%, but Likely + Likely = Very Likely,” we
find differences in how people combine probability forecasts from multiple advisors
depending on whether those forecasts are given numerically or verbal. Specifically, we
find that, consistent with prior research (e.g., Budescu & Yu 2006, 2007), participants
average numeric probability forecasts. For example, if two weather forecasters predict
that there is a “60% chance” and a “70% chance,” respectively, that it will rain,
participants’ own predictions typically lie between 60% and 70%. However, participants
combine verbal forecasts more additively. That is, if the forecasters say rain is “probable”
and “likely,” participants tend to make predictions that are more extreme than each
CHAPTER 1.
WHEN RISK IS WEIRD:
UNEXPLAINED TRANSACTION FEATURES LOWER VALUATIONS
Robert Mislavsky
Uri Simonsohn
ABSTRACT
We define transactions as weird when they include unexplained features, that is, features
not implicitly, explicitly, or self-evidently justified, and propose that people are averse to
weird transactions. In six experiments, we show that risky options used in previous
research paradigms often attained uncertainty via adding an unexplained transaction
feature (e.g., purchasing a coin flip or lottery), and behavior that appears to reflect risk
aversion could instead reflect an aversion to weird transactions. Specifically, willingness
to pay drops just as much when adding risk to a transaction as when adding unexplained
features. Holding transaction features constant, adding additional risk does not further
reduce willingness to pay. We interpret our work as generalizing ambiguity aversion to
The amount people are willing to pay for a given item is influenced by the context
in which the purchase takes place (Ariely, Loewenstein, & Prelec, 2006; Jung, Perfecto,
& Nelson, 2016; Lichtenstein & Slovic, 2006). Transactions, the necessary steps to
acquire the item, are a part of every purchase context.
In this paper, we identify a transaction attribute which negatively influences
willingness to pay: the extent to which it contains features that lack an explanation. These
explanations may be (i) implicit, based directly on consumers’ past experiences with
similar transactions, (ii) explicit, explained by the seller, or (iii) self-evident, based on
reasonable inferences from context. For brevity, we refer to transactions that include
unexplained features as “weird.” When using the term weird, we refer exclusively to such
a definition—the presence of unexplained features.
To illustrate how the presence of unexplained features may manifest itself in a
transaction and how the three aforementioned types of explanations might mitigate their
impact on willingness to pay, consider a restaurant that sells lunches by placing them in
boxes and then asks people to pay for the right to open the box and take the lunch from
the box. Placing the lunch in a box and asking to pay to open it could constitute an
unexplained transaction feature and may make customers uncomfortable or suspicious
(e.g., is the lunch in the box because the restaurant doesn’t want you to see what it really
looks like?). An explanation could easily mitigate any such consequences. An implicit
explanation would be if the “box” was simply a vending machine; customers could draw
on their prior experience and the transaction feature is no longer unexplained.
self-service boxes, which we’ve introduced to help you get your food more easily.” The
transaction feature is again no longer unexplained thus no longer expected to reduce
valuations.
Note that unexplained is not the same as novel. A completely novel transaction
feature could come with an explanation. For example, imagine a restaurant that requires
customers to draw on a piece of glass with their finger in order to get their lunch. That is
an unusual transaction feature. But if the glass is an iPad screen, and the drawing is the
customer’s signature, customers facing this transaction feature for the very first time
would easily generate a self-evident explanation for why the transaction feature is there. It
would not be expected to lower valuations.
We conjecture that the presence of unexplained features lowers willingness to pay
because they trigger reactions akin to ambiguity aversion (Ellsberg, 1961; Frisch &
Baron, 1988; Keren & Gerritsen, 1999) in general and comparative ignorance in
particular (Chow & Sarin, 2001; Fox & Tversky, 1995; Fox & Weber, 2002). Relevant
but unknown information may make consumers less confident in the decision to make the
purchase (Chow & Sarin, 2001; Fox & Tversky, 1995; Fox & Weber, 2002) or perhaps
make them feel the seller has more information that she may use to her advantage (Frisch
& Baron, 1988, p. 153; Keren & Gerritsen, 1999). The presence of unexplained features
creates an imbalance between seller and buyer in terms of what relevant information they
have for the transaction. Weirdness aversion, the aversion to transactions with
unexplained features, may then constitute the generalization of ambiguity aversion to
We demonstrate the practical relevance of an aversion to unexplained transaction
features by focusing on a research paradigm where researchers unintentionally
manipulated the presence of unexplained transaction features and obtained a result, often
referred to as the “uncertainty effect” (Gneezy et al., 2006). We find that the uncertainty
effect may instead be caused by weirdness, or the presence of unexplained transaction
features.
Gneezy et al. (2006) documented that people were willing to pay less for a risky
prospect than for its worst possible outcome. For instance, people were willing to pay an
average of $26.10 for a $50 Barnes and Noble gift card but only $16.12 for a gamble
where participants were guaranteed to win either a $50 or $100 gift card, each with a
50% probability. This general finding has been replicated by many independent research
teams (e.g., Andreoni & Sprenger, 2011; Newman & Mochon, 2012; Simonsohn, 2009;
Yitong Wang, Feng, & Keller, 2013; Yang, Vosgerau, & Loewenstein, 2013).1
These uncertainty effect studies pit valuations of a risky option against valuations
of a riskless one. The risky option requires a mechanism that introduces risk, while the
riskless option does not. For example, researchers have generated risky prospects by
asking participants to buy coin flips, lottery tickets, unlabeled envelopes, and gift cards of
unknown value and have compared participants’ valuations of these transactions to that
of buying a gift card outright. There is no explicit nor implicit justification to sell gift
1 Keren and Willemsen (2009) report results where the uncertainty effect is not observed when comparing
average valuations. Gideon Keren shared the raw data from that article with us. We analyzed it as in Simonsohn (2009), comparing the entire distributions of responses and found that a substantial share of participants do show the effect. Rydval et al. (2009) provide the only failure to replicate the uncertainty effect that we are aware of. Their favored explanation is that participants in other experiments
cards of unknown value or to utilize a coin flip to determine their value. Therefore, while
these mechanisms do generate risk, they also introduce unexplained features to the
transaction.
Uncertainty effect studies, therefore, have included a risky transaction with
unexplained features and a not risky one without unexplained features, perfectly
confounding risk with weirdness. In this paper, we report studies that manipulate the
presence of unexplained features independently of risk. Our results are consistent with an
aversion to unexplained features accounting for somewhere between the preponderance
and the totality of the uncertainty effect. After presenting our empirical results, we
discuss how unexplained features could be present in other paradigms used to study
consumer behavior.
TRANSPARENT REPORTING
Studies 1-5 were run on Amazon’s Mechanical Turk (MTurk) and were
administered through Qualtrics. Study 6 was incentive compatible and run in a behavioral
lab. For all studies we decided sample size before collecting any data. MTurk participants
were not allowed to participate in more than one study. We included attention checks for
Studies 5A and 5B. Studies 5A, 5B, and 6 were preregistered. For all studies we report all
data exclusions (if any), all manipulations, and all measures. Data, analysis code,
STUDIES 1-3: WEIRD, BUT NOT RISKY
Our first three studies are similar, so we present them together. In all three we
modified the traditional uncertainty effect paradigm to disentangle the effect of risk from
the effect of unexplained features on valuations. For a more fluent reading experience, we
refer to transaction that include unexplained features as “weird” and to the presence of
such features as “weirdness.” The uncertainty effect paradigm pits the valuation of a
riskless prospect (e.g., buying a $50 Target gift card) against that of a risky one (e.g.,
flipping a coin to determine if the gift card is for Target or for Walmart). This paradigm
confounds risk and weirdness because the manipulation that introduces risk also
introduces unexplained features to the transaction (e.g., flipping a coin). To examine the
importance of this confound, we created a third type of transaction, one that was weird
but not risky. Specifically, this was a transaction that includes the same unexplained
features present in the risky transactions (e.g., buying a token redeemable for a gift card)
but with a certain outcome (e.g., the value of the gift card is known).
Method
Design. In Study 1 (N = 603; 29.6% female), we randomly assigned participants
to one of three conditions asking them indicate their maximum WTP for a transaction.
Condition 1. Neither weird nor risky:2
We want to know how much you would be willing to pay for two different items, a $50 Walmart gift card and a $50 Target gift card.
If you could buy only the $50 Walmart gift card, what is the most you would pay for it?
If you could buy only the $50 Target gift card, what is the most you would pay for it?
Condition 2. Weirdand risky:
Imagine that you are standing in front of a table that has a locked box on it. The box has two gift cards inside: a $50 Walmart and a $50 Target gift card.
You can pay to open the box and choose a gift card, which will be yours to keep. The gift cards do not have the names of the stores printed on them, so you will not know which gift card is which.
What is the most you would be willing to pay to open the box?
Uncertainty effect studies compare the valuation of similar pairs of transactions. Any
difference in WTP can therefore be caused by the risk difference (having a known vs.
unknown outcome) or by the weirdness difference (buying outright vs. paying to open a
box). We addressed this confound by adding a weird but not risky condition. Participants
read the same scenario as those in the weird and risky condition, except the gift cards were
labeled, so participants knew which card they were getting before choosing. Specifically,
it read (differences between Conditions 2 and 3 underlined here but not in original
materials):
Condition 3. Weird but not risky:
Imagine that you are standing in front of a table that has a locked box on it. The box has two gift cards inside: a $50 Walmart and a $50 Target gift card.
2 In Study 1, some participants valued Walmart/Target gift cards and others valued Amazon/Barnes &
You can pay to open the box and choose a gift card, which will be
yours to keep. The gift cards have the names of the stores printed
on them, so you will know which gift card is which.
What is the most you would be willing to pay to open the box?
After running this study, we identified a potential confound. The weird
transactions (paying to take one of two gift cards from a box) had two possible outcomes,
while the not weird transaction had only one. We believed this difference, rather than
weirdness, could explain any observed differences (e.g., because people are averse to
explicitly rejecting an outcome). In Study 2 (N = 308; 35.5% female) we reran the two
weird conditions and added a new weird condition that had only one possible outcome.
Across the three conditions, then, participants paid to open a box and take a card from it.
The conditions differed on whether the box contained one labeled gift card (new
condition), two labeled gift cards, or two unlabeled gift cards. We did not rerun the
neither risky nor weird condition.
In Study 3 (N = 403; 36.8% female) we reran all four conditions from Studies 1
and 2 with a different operationalization of risk and weirdness: purchasing a token at an
event and redeeming it for a gift card. The four conditions were:
1. Neither weird nor risky
What is the highest amount you would be willing to pay for a $50 [Walmart/Target] gift card?
(Target and Walmart counterbalanced within-subjects)
2. Weird but not risky, one option
Imagine that you are at an event where there are tokens for sale. These tokens can be redeemed at a cashier for a $50 [Walmart/Target] gift card. What is the highest amount you would be willing to pay for one of these tokens?
3. Weird but not risky, two options
Imagine that you are at an event where there are tokens for sale. These tokens can be redeemed at a cashier for your choice of either a $50 Walmart gift card or a $50 Target gift card. What is the highest amount you would be willing to pay for one of these tokens?
4. Weird and risky
Imagine that you are at an event where there are tokens for sale. These tokens can be redeemed at a cashier for either a $50 Walmart gift card or a $50 Target gift card. The cashier will flip the token, and if it lands on heads, you will receive the Walmart gift card. If it lands on tails, you will receive the Target gift card. What is the highest amount you would be willing to pay for one of these tokens?
Results
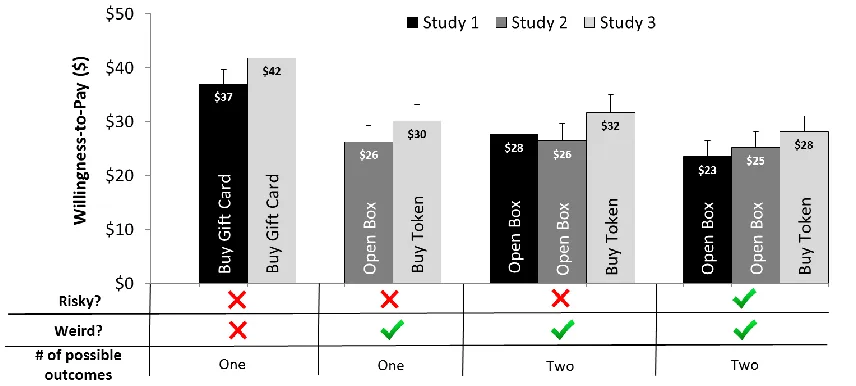
Figure 1 depicts results for Studies 1-3. We identify four main takeaways:
1. In Studies 1 and 3, we replicate the original uncertainty effect (Study 2 does
not allow testing it). Participants valued the weird and risky prospects (M =
$25.80), less than their least-valued neither weird nor risky gift card (M =
$39.37). The risky option was valued significantly less than its worst outcome
in both studies, ts > 6.58, ps < .001.
2. Holding weirdness constant, there is no apparent uncertainty effect.
Comparing the two weird conditions, risky gift cards (M = $25.60 across all
studies) were not valued significantly less than the riskless gift cards (M =
$28.39 across all studies), whether they had one or two options (Study 1:
t(199) = 1.92, p = .057; Study 3: ts < 1.64, ps > .10). Based on point-estimates
of the means, the effect of weirdness is two-thirds (Study 1) to three-quarters
for.3 We believe some of this residual effect we are attributing to uncertainty
is also attributable to weirdness, because it seems likely that, in these
scenarios, uncertainty makes the weird scenarios weirder by adding an
additional unexplained feature, flipping a token to determine the value of a
gift card. We could not estimate this for Study 2, because it did not include a
not weird condition.
3. Contrary to our initial expectations, these results are not driven by the number
of potential options. Valuations for the weird but not risky transactions are
similar when they involve one or two possible outcomes, ts < .71, ps > .47.
4. Study 3 rules out a potential confound for Studies 1 and 2. In the box
scenarios, participants may have believed that they had to make two
payments, one to open the box and another to purchase the gift card. Because
very few participants paid $0 in the weird scenarios (as would be expected if
this were the case; see Supplement 2), we believe this is unlikely, although a
reviewer also raised the possibility that participants may have averaged the
two payments when reporting their WTP. We obtain very similar results in the
token scenario, where this ambiguity is not present, which appears to rule this
possibility out.
3 For the Barnes & Noble and Amazon gift cards in Study 1, the means are $35.91 (neither weird nor risky),
Figure 1. Average valuations (Studies 1-3) as a function of risk and weirdness
Notes: Hypothetical valuations for $50 gift cards. Risk involves whether it is for Target or Walmart, operationalized via opening a box and selecting one of two unlabeled envelopes (Studies 1 & 2), or purchasing a token exchangeable for one of the two gift cards, determined by flipping the token (Study 3). Weird but riskless involves labeled envelopes (Studies 1 & 2), or participants choosing what to redeem the token for (Study 3). Transactions with one outcome (bottom row) involve box with 1 gift card (Study 2) or token with predetermined value (Study 3). Error bars represent 95% confidence intervals.
STUDY 4: BIGGER DIFFERENCES IN OUTCOMES
In the first three experiments, the risky prospects involved gift cards with the
same face value ($50) for different stores (e.g., Target vs. Walmart). This design,
originally used by Newman and Mochon (2012), allowed us to create weird but not risky
conditions where participants could meaningfully choose between gift cards, whereas
choosing between a $50 card and a $100 card is not a meaningful choice. However,
minimizing outcome variance may have inflated the importance of the unexplained
features. In other words, we may have found risk did not matter much because we created
situations without much risk. In this experiment, we created risky prospects with greater
Method
Sample. We recruited 604 participants (39.4% female), each paid $0.25.
Design. Participants were randomly assigned to one of eight conditions in a
between-subjects design. Two not weird conditions were similar to those in Studies 1 and
3: participants provided their WTP for either a $50 Target gift card or a $100 Target gift
card bought outright. The remaining six conditions involved weird transactions and
conformed to a 2 (transaction: box vs. token) x 3 (value: $50 vs. $100 vs. risky) design.
Participants read either the box or token scenarios from the prior studies, where the
outcomes were either a $50 Target gift card for sure, a $100 Target gift card for sure, or a
Target gift card that was worth either $50 or $100, each with 50% probability. We did not
include a condition where participants could choose either a $50 or $100 gift card
because we assumed all participants would choose $100. We decided before data
collection began to obtain 120 observations from the not weird conditions and 60 from
each weird condition (since we had two versions of weirdness, 60*2=120).
Results
Beginning with the token conditions, the uncertainty effect was again replicated
when not accounting for transaction weirdness. Participants valued the risky token $6.27
less than they did its worst possible outcome purchased outright (M = $37.23 and M =
paid $5.59 more for the risky prospect (token exchangeable for $50 gift card: M =
$31.64; risky token: M = $37.23), t(118) = 1.57, p = .12.4
The uncertainty effect was also replicated in the box conditions ($50 Target gift
card bought outright: M = $43.50; risky box: M = $25.23), t(180) = 9.13, p < .001. The
difference between the risky prospect and its least valued outcome was much smaller
when comparing the two weird conditions ($50 gift card in box: M = $29.44; risky box
with $50 or $100 gift card: M = $25.23), t(120) = 1.40, p = .16. The total uncertainty
effect is about $18 ($43.50-$25.23). The effect of weirdness alone is about $14. As
argued above, the residual $4 effect could be the result of weirdness if choosing among
unlabeled cards seems less justified than taking a labeled card out of a box.
There was also a sizable main effect of weirdness for individual valuations of the
$50 and $100 gift cards. Buying a $50 or $100 gift card outright was valued at $43.50
and $86.49, respectively, whereas a $50 or $100 gift card in a box was valued at $29.44
and $51.47, respectively, and a token exchangeable for a $50 or $100 gift card was
valued at $31.64 and $65.93, respectively, ts > 5.38, ps < .001. We report all pairwise
comparisons in Supplement 4. In sum, we obtain results similar to those of Studies 1-3
using risky prospects with greater outcome variance. The data are consistent with
unexplained features accounting for somewhere between the preponderance and the
totality of the uncertainty effect.
4 Analyzing the data as in Simonsohn (2009), the lower bound of people paying less for the uncertain item
STUDIES 5A AND 5B: EVALUATING WEIRDNESS OF PRIOR UNCERTAINTY
EFFECT STUDIES
In Study 5 we more directly test if prior uncertainty effect studies have
unintentionally manipulated weirdness by asking participants to evaluate the weirdness of
the underlying transactions in those studies.
One may measure weirdness on absolute or relative scales, although each has its
limitations. Absolute scales (e.g., “How weird is this transaction?”) are ambiguous about
what a transaction is being compared to, or equivalently, what the values in the scale
represent. Relative scales, on the other hand, (e.g., “Which transaction is weirder?”), may
create demand effects or change participants’ definitions of weirdness where they think
the weirdest transaction is the one that is least like the others (even though it may be the
simplest). Since neither approach was obviously superior, we pursued both, and in both
cases we explicitly defined weirdness to our participants as involving the presence of
unexplained features. Participants judged weirdness on both an absolute scale (Study 5A)
and on a relative scale (Study 5B). We obtained consistent results with both methods.
Risky transactions in prior uncertainty effect studies are weirder than their riskless
STUDY 5A: BETWEEN-SUBJECTS RATINGS OF WEIRDNESS
Method
Sample. We recruited 714 MTurk participants, 600 of whom (53.3% female, Mage
= 35.3 years) passed an attention check and were able to continue to the rest of the
survey, each paid $0.40 (pre-registration: https://aspredicted.org/3mu9d.pdf).
Design. In a between-subjects design, participants evaluated the weirdness of
transactions used in prior uncertainty effect studies. Participants began by reading this
passage:
We will show you an example of a purchase that experimenters ask participants to evaluate. We are interested in knowing how
“weird” you think the purchase is. By “weird,” we mean how much
the purchase has unusual and unexplained features.
Participants then read one of eight questions used in prior uncertainty effect
studies—two from Gneezy et al. (2006), three from Yang et al. (2013), and three from
this paper. Three of these questions were “baseline” questions (i.e., the riskless valuations
that were used as control conditions in uncertainty effect studies).5 We preregistered that
we would collapse the ratings for these conditions for analysis. The other five valuations
were used in prior studies—Gneezy et al.’s (2006, p. 1301) lottery, Yang et al.’s (2013, p.
737) certain and uncertain coins, our certain and uncertain boxes (Study 4). See the
Appendix for the exact text of these stimuli. After reading the question, participants rated
its weirdness using the following scale: “How weird is it to buy a gift [card/certificate]
5 These questions were slightly adapted in order to sound like an actual transaction (e.g., “Imagine you are
like this?” (1 = It is not weird at all; 2 = It is a little weird; 3 = It is very weird; 4 = It is
extremely weird). If risk and weirdness were confounded in these studies, we would
expect that the weird transactions would be rated as weirder than the baseline ones.
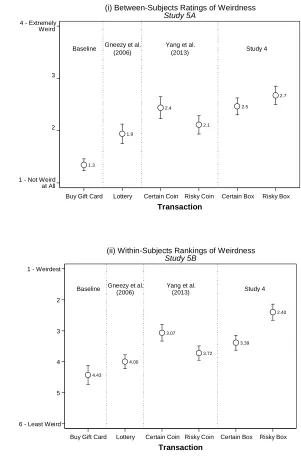
Results. Consistent with the notion that prior uncertainty effect studies have
confounded risk and weirdness, participants rated all of the weird transactions (1.94 ≤ Ms
≤ 2.68) as weirder than the baseline transaction (M = 1.35), all ts > 4.83, all ps < .001.
See Figure 2, panel (i). In addition to this pre-registered comparison, we compared the
share of participants rating a transaction as “not weird at all.” Seventy percent of
participants gave this rating to the baseline transaction compared to between 8% and 39%
for the weird transactions, Zs > 4.45, ps < .001.
STUDY 5B: WITHIN-SUBJECTS RANKINGS OF WEIRDNESS
Method
Sample. We recruited 184 participants, 153 of whom (42.7% female, Mage= 35.5
years) passed an attention check and were able to continue to the rest of the survey, each
paid $0.40 (pre-registration: https://aspredicted.org/p4hi5.pdf).
Design. All participants were given the same instructions as in Study 5A, but
instead of rating them between-subjects, they were shown six transactions (one of the
three baseline transactions and all five weird transactions) and asked to rank them from
Results
Consistent with Study 5A and more generally with the notion that prior
uncertainty effect studies have confounded risk and weirdness, participants ranked
purchasing a gift card outright as the least weird (M = 4.43 out of 6) out of all the
transactions (between 2.40 for the Risky Box, t(149) = 8.47, p < .001, and 4.00 for the
GLW Lottery, t(149) = 2.00, p = .047). See Figure 2, panel (ii). Here the weirdness
difference between the baseline and the original uncertainty effect (Gneezy et al., 2006)
seems smaller than in Study 5A. Part of this may be explained by some participants
reversing the scale, since 14% of participants ranked the baseline transaction as the
weirdest (the second most popular answer). Nevertheless, looking at the number of
participants who ranked the transaction as least weird, a comparison not included in our
pre-registration, we see a more substantial difference. Specifically, while 46% of people
ranked the baseline as the least weird, only 15% did for the Gneezy et al. (2006) lottery,
Z = 5.97, p < .001.
STUDY 6: INCENTIVIZED LAB STUDY
To this point, all of our studies have used hypothetical scenarios. To address the
possibility that our findings were driven in part by participants’ inattention or lack of
motivation, our last study is an incentive-compatible replication (pre-registration:
Figure 2. Prior uncertainty effect studies are weirder than their baseline comparisons
Notes: Panel (i) shows between-subjects ratings (Study 5A; N=600) of transactions used in prior uncertainty effect studies (see Appendix). The scenarios were described verbatim to participants. The y-axis shows the average response to the question: ‘We are interested in knowing how “weird” you think the purchase is . . . By “weird,” we mean how much the purchase has unusual and unexplained features.’ Panel (ii) shows within-subjects rankings of weirdness (Study 5B; N=153) of the same scenarios.
1.3 1.9 2.4 2.1 2.5 2.7
Baseline Gneezy et al. (2006)
Yang et al.
(2013) Study 4
1 - Not Weird at All 2 3 4 - Extremely Weird H o w w e ir d i s i t to b u y a g ift c a rd l ik e th is ?
Buy Gift Card Lottery Certain Coin Risky Coin Certain Box Risky Box
Transaction
(i) Between-Subjects Ratings of Weirdness
Study 5A 4.43 4.00 3.07 3.72 3.39 2.40
Baseline Gneezy et al. (2006)
Yang et al.
(2013) Study 4
1 - Weirdest
2
3
4
5
6 - Least Weird
W e ir d n e s s R a n k in g
Buy Gift Card Lottery Certain Coin Risky Coin Certain Box Risky Box
Transaction
(ii) Within-Subjects Rankings of Weirdness
Method
Sample. We recruited 219 participants (71.1% female, Mage = 20.8 years) at the
Wharton Behavioral Lab. This study was part of a larger lab session with several
unrelated studies, and all participants were paid $10 for completing the session.
Design. In a three-cell between-subjects design, participants indicated their
willingness to pay (WTP) for an item. The three conditions were (i) buying a $50
Amazon gift card (neither weird nor risky condition), (ii) paying to open a locked box
with a $50 Amazon gift card and taking the card (weird but not risky condition), and (iii)
paying to open a locked box containing a $50 gift card and a $100 gift card, with values
only visible on the inside, and taking a card without knowing its value (weird and risky
condition).
One in every twenty participants was randomly selected to have their decision
count for real and receive a $100 bonus (to fund the purchase). To make the WTP
elicitation incentive-compatible, a price was set but not revealed to participants. If
participants’ WTP was greater than that price, they made the purchase and paid that price.
Otherwise, they kept the entire bonus and did not make a purchase. To indicate their
WTP, we showed participants a price, starting at $5, and they indicated if they would
make the purchase for that amount. If they said yes, we increased the price by $5, and
they answered again. This was repeated until they answered “No” or the price reached
$100.6 The highest price participants said “Yes” to is our dependent variable. We
purposefully avoided a multiple-price-list and used a multiple-price-sequence, concerned
that the price list could prompt participants to choose valuations in the middle of the
range for the uncertainty condition, attenuating the uncertainty effect (original materials:
https://osf.io/x8cqm/).7
Results
Without accounting for weirdness, for the presence of unexplained transaction
features, participants again acted as if they were extremely risk averse. Willingness to
pay for the weird and risky transaction(M = $39.24) was similar to that for the neither
weird nor risky one (M = $38.70), t(143) = .19, p = .85, even though the former has an
expected value approximately 50% higher than the latter. As in prior uncertainty effect
studies, this suggests the presence of direct risk aversion, since neither prospect theory
nor expected utility theory can generate such extreme levels of risk aversion. But if
defined narrowly, as obtaining a strictly lower mean, this result does not replicate the
uncertainty effect.8 In any case, this comparison confounds risk and weirdness.
Controlling for weirdness, participants appear to show very mild (if any) risk
aversion: the riskypurchase (M = $39.24) was valued noticeably above the not risky one
7 A reviewer expressed this concern about a multiple-price-sequence that we thought was worth sharing
with readers: “[A] price-sequence may not be innocuous, either: The initial, low prices may serve as anchors for subjects’ valuations […] which may bias WTPs down. If such anchoring effects were
asymmetric, and were more pronounced for risky or weird transactions (because, say, preferences for risky or weird transactions are less stable), then they could make the experimental results difficult to interpret.” To respond to this concern we ran a study on MTurk manipulating whether the multiple-price-sequence was increasing or decreasing. The effect of weirdness is significant and of the same magnitude for both. See Supplement 7.
8 Although we preregistered that we would calculate the proportion of the uncertainty effect explained by
(M = $30.47), t(143) = 2.94, p = .004. In fact, participants valued the uncertain gift card
close to what a risk neutral buyer would be expected to value it. In particular, assuming
participants would pay twice as much for a $100 gift card as they would for a $50 gift
card (which is a conservative assumption that does not account for diminishing sensitivity
or marginal utility), a risk neutral valuation of the risky gift card is $45.71 (1.5 * $30.74),
which is not much higher than what we observe ($39.24), t(143) = 1.77, p = .080.9
Finally, holding risk constant, we replicate weirdness aversion. The not weird
purchase (M = $38.70) was valued above the weird one (M = $30.48), t(144) = 3.17, p =
.002.
GENERAL DISCUSSION
We have documented that the presence of unexplained features lowers willingness
to pay (WTP). We manipulated the presence of such features, weirdness, independently
of risk and found that the effect of weirdness on WTP is of about the same magnitude as
the uncertainty effect, which had previously been attributed to the presence of
uncertainty. These results suggest that subtle transaction features can have dramatic
effects on WTP—dramatic enough for multiple independent research teams to run
successful replications of the original Gneezy et al. (2006) finding, but subtle enough that
they did not notice the potential confound when doing so (including one of us; see
Simonsohn, 2009).
9 To perform this t-test we multiplied all valuations in the weird but not risky condition by 1.5, and
Unexplained features is the key manipulation
We have characterized our key manipulations as increasing weirdness, or
introducing unexplained features to transactions. Some of the seven members of our
review team proposed alternative interpretations for our manipulations. One reviewer
proposed that perhaps we simply manipulated the total number of features (whether weird
or not). We do not believe the number of features per se is critical. First, in an
experiment included in a prior version of the manuscript, we found that merely adding
features did not reduce valuations (see supplement 6). Second, in many empirical studies,
valuations are often elicited with procedure that require different numbers of steps (e.g.,
asking for a price outright vs. going through a multiple-price list), and it has not been
previously documented that transactions with more steps lead to lower valuations. Third,
there is no obvious psychological process that would seem to justify this prediction. In
contrast, we believe that all mechanisms that have been proposed for ambiguity aversion
would also predict that unexplained features lower valuations.
Another reviewer proposed that perhaps what’s special about the features we
introduced is not that they are unexplained features, but that they are unusual features that
transactions outside the lab would not include. That is to say, people would pay less for
opening a box to buy an item, not because they see no reason to have that extra step, but
because outside the lab they have never purchased an item by paying to open the box. We
do not find this alternative explanation compelling either. First, most transactions in the
lab are rather unusual. Take, for example, our baseline condition in incentive-compatible
a pre-set price to determine if they would purchase a $50 gift card held by the
experimenter. This is not a transaction they would engage in outside the lab. And yet,
their WTP was a rather high $38.70 and comparable to the valuations from prior studies
that did not involve the convoluted incentive-compatible mechanism (e.g., $37 in Study 1
here).
Second, we can easily imagine situations where a completely new transaction
feature, because it is accompanied by an explanation, would not be expected to lower
WTP. Consider again that example from the introduction about a person’s first payment
by signing on an iPad, or perhaps an American asked to pay in rubles during her first
coffeeshop visit in Moscow. In these examples, consumers are facing entirely novel
transaction features, but these features have self-evident explanations and would not be
predicted to lower WTP.
When risk is not weird
Our studies manipulate unexplained features independently of risk (i.e., we
include transactions that are weird but not risky), but not risk independently of
unexplained features (i.e., we do not include transactions that are not weird but risky).
The absence of a not weird but risky cell in our experiments may pose some problems for
the interpretation of our studies. If a not weird but risky condition was valued similarly
(or lower) than a weird and risky scenario, it would imply that unexplained features
moderate, rather than account for, the effect of risk in those transactions. Although we
This is a challenge to explore empirically because it requires a situation where
risk is an expected feature (e.g., buying stocks), and is therefore not weird. In such
situations, however, offering an option with no risk (e.g., a riskless stock) would be
weird, since it would involve the presence of a feature that requires an explanation (“why
is this stock riskless?”). Yang et al.’s (2013) Experiment 4 provides an example of our
concern. They include a condition where participants indicate their WTP for a coin flip
that paid a $50 gift certificate if the coin landed on heads or tails (“Certain Coin Flip,” p.
737). In our Studies 5A and 5B, we asked participants to rate how weird this transaction
was, and they rated it as weirder than the risky coin flip (i.e., as containing more
unexplained features), likely because a coin flip implies risk and removing risk makes the
coin flip unnecessary.
Further, even holding all features of a transaction constant, all risk per se may not
be equally unexplained. For instance, in most gambling situations, payoffs are inversely
proportional to the probability of winning. Therefore, a lottery with a 1% chance of
winning $100 and a 99% chance of winning $50 is more typical (i.e., has an implicit
explanation) than a gamble with a 99% chance of winning $100 and a 1% chance of
winning $50. If this were true, and if unexplained features reduce valuations, people
should appear more risk averse for the latter lottery. A closer look at Gneezy et al. (2006,
p. 1287) reveals evidence consistent with this conjecture. Participants are risk seeking
(i.e., WTP > Expected Value) when there is a 1% chance of winning the larger price and
risk averse (i.e., WTP < Expected Value) when there is a 99% chance of winning the
identical ($37.50) in this study. Of course, this is speculative and there are several
potential explanations for these findings that have little to do with the specific transaction
features (e.g., probability weighting; McGraw, Shafir, & Todorov, 2010; Rottenstreich &
Hsee, 2001).
Attributing the uncertainty effect to unexplained transaction features may reconcile
inconsistent findings
The “direct risk aversion” explanation for the uncertainty effect (Gneezy et al.,
2006; Simonsohn, 2009) seems at odds with studies that show consumers responding
more favorably to risky promotions than to riskless ones. Specifically, Mazar,
Shampanier, and Ariely (2016) find that consumers prefer a probabilistic discount to a
certain discount of the same expected value (e.g., a 10% chance of getting item for free
vs. a certain 10% discount), while Goldsmith and Amir (2010) find that offering a
randomly determined prize for making a purchase is nearly as effective as offering the
most attractive prize for sure.
If the uncertainty effect were caused by unexplained transaction features, rather
than direct risk aversion, at least two explanations arise for the apparent contradiction.
First, it may be that consumers can readily identify a reason for a company to offer the
type of promotions examined in those studies. They have an explanation, so they are not
aversive.10 Second, in uncertainty effect studies, the focal item (e.g., the gift card
participants are purchasing) is uncertain, while in the risky promotion studies, the
“bonus” is uncertain. The focal transaction does not contain an unexplained feature, the
bonus does. Perhaps people tolerate (or even prefer) these features in such circumstances.
Another difference is that uncertainty effect studies typically use WTP as their
dependent variable, while the risky promotion studies use choice (Mazar et al., 2016) and
attractiveness ratings (Goldsmith & Amir, 2010). Perhaps the WTP question implicitly
forces a transaction on participants, enhancing the negative suspicions of buyers, but this
pressure dissipates in the other tasks. Moon and Nelson (2015) do not replicate the
uncertainty effect with a choice task, but Gneezy et al. (2006, p. 1292) do. The role of
elicitation mode on the effects of risk and of unexplained features remains an open
question, as there are too many differences in these respective designs to meaningfully
interpret the differences in results.
Potential transaction feature confounds in other literatures
Much of consumer research involves the comparison of valuations of the same
item across different transaction contexts. For example, the endowment effect compares
valuations of items being sold against those being purchased, and time preference studies
compare the valuations of delayed payments occurring at different points in time (e.g.,
payments happening today vs. payments happening in the future). Those contextual
differences may unintentionally have added unexplained features as well.
For example, it may be the case that giving participants an item and immediately
ask them to sell it is an atypical feature, relative to giving them money and offering the
delaying a payment due today may be perceived as less justified than delaying a payment
occurring in the future. This potential confound would lead to more severe discounting of
immediate than future delays, typically interpreted as evidence of impatience. In many
cases, however, controlling for these differences may be difficult. In our case, for
example, we could not find a way to induce risk without adding transaction features, so
we added features to the riskless option, this may be the easiest path to control for the
weirdness confound in other paradigms as well.
This paper contains a supplement. Table 1 summarizes its contents.
Table 1. Index of supplementary materials (available from http://osf.io/fzjuw)
Section Pages
Supplement 1. Complete age data for Studies 1-4 2
Supplement 2. Additional Analyses for Study 1 3-4
Supplement 3. Within-subject variation in valuation of gift cards in Studies
1-3 5
Supplement 4. Pairwise comparisons across all conditions in Study 4 6 Supplement 5. All means and pairwise comparisons for Studies 5A-B 7 Supplement 6. Study S1 – Isolating and mediating with weirdness 8-10 Supplement 7. Study S2 – Comparing ascending and descending price
Appendix. Stimuli used in Studies 5A and 5B
Baseline (randomly selected from the following):
• Imagine that you could buy a $50 gift certificate to Barnes and Noble as part of
this study. The gift certificate is good for use within the next two weeks.
• Imagine that you could buy a $50 Target gift card as part of this study.
• We are interested in how much you would pay for a $50 Barnes & Noble gift
certificate, which you could buy as part of this study.
Gneezy, List, and Wu (2006, p. 1301) Lottery
Imagine that we offer you a lottery ticket that gives you a 50 percent chance at a $50 gift certificate for Barnes and Noble, and a 50 percent chance at a $100 gift certificate for Barnes and Noble. Whichever gift certificate you win is good for use within the next two weeks.
Yang, Vosgerau, and Loewenstein (2013, p. 737) Certain Coin
We are interested in how much you would be willing to pay for participating in a coin flip. If heads comes up, you will get a $50 gift certificate for Barnes & Noble bookstore. If tails comes up, you will get a $50 gift certificate for Barnes & Noble bookstore.
Yang, Vosgerau and Loewenstein (2013, p. 737) Uncertain Coin
We are interested in how much you would be willing to pay for participating in a coin flip. If heads comes up, you will get a $50 gift certificate for Barnes & Noble bookstore. If tails comes up, you will get a $100 gift certificate for Barnes & Noble bookstore.
Study 4 Certain Box
Imagine that you are standing in front of a table that has a locked box on it. The box has a $50 Target gift card inside. You can pay to open the box and take the gift card, which would be yours to keep.
Study 4 Risky Box
Imagine that you are standing in front of a table that has a locked box on it. The box has two gift cards inside: a $50 Walmart and a $50 Target gift card.
CHAPTER 2.
CRITICAL CONDITION:
PEOPLE ONLY OBJECT TO CORPORATE EXPERIMENTS
IF THEY OBJECT TO A CONDITION
Robert Mislavsky
Berkeley Dietvorst
Uri Simonsohn
ABSTRACT
Why have companies faced a backlash for running experiments? Academics and pundits
have argued that it is because the public finds corporate experimentation objectionable. In
this paper we investigate “experiment aversion,” finding evidence that, if anything,
experiments are rated more highly than the least acceptable policies that they contain. In
five studies participants evaluated the acceptability of either corporate policy changes or
of experiments testing those policy changes. When all policy changes were deemed
acceptable, so was the experiment, even when it involved deception, unequal outcomes,
and lack of consent. When a policy change was unacceptable, the experiment that included
it was deemed less unacceptable. Experiments are not unpopular, unpopular policies are
In June 2014, the Proceedings of the National Academy of Science (PNAS)
published an article describing the results of a field experiment where academic authors
(Kramer, Guillory, & Hancock, 2014) partnered with Facebook to manipulate content
users saw (i.e., “News Feeds”), showing either more positive or more negative emotional
content, to measure potential emotional contagion. A month later, the online dating site
OkCupid published a blog post titled “We Experiment on Human Beings,” which
described three experiments they had run on their users (Rudder, 2014). Reaction to the
revelation of these experiments was swift and highly negative.
The backlash the Facebook and OkCupid experiments received, described by a
Forbes contributor as “one epic freak out” (Muse, 2014), dominated several news cycles
despite competing for attention with the 2014 World Cup and major U.S. Supreme Court
rulings. Articles describing the negative reaction to the Facebook experiment reached the
front page of the Wall Street Journal and were the number one most popular/shared
articles on several news outlets, including The Atlantic, The Wall Street Journal, and The
BBC.11 Articles on CNN.com and in the New York Times proclaimed that Facebook
treated users like “lab rats” (Goel, 2014; Goldman, 2014). When the OkCupid experiment
was revealed, an article in FastCompany declared that the experiment was “way creepier”
than Facebook’s (Greenfield, 2014). Even legislators got involved, calling for
investigations into data collection practices (R. Meyer, 2014; Stampler, 2014). A few
months later, Facebook’s chief technology officer formally acknowledged that the
company was “unprepared” for the reaction elicited by the experiments and admitted that
11 Internet Archive screenshots from The Atlantic (June 29, 2014), Wall Street Journal (June 30, 2014), and
they “should have considered non-experimental ways” to conduct research on the topic
(Schroepfer, 2014).
In this paper, we present evidence suggesting that the backlash to these
experiments had nothing to do with the experimentation itself. Instead, the backlash was
likely driven by the specific policies that these experiments contained (i.e., the individual
treatment arms), and reactions would have been at least as negative if these were
implemented as standalone policy changes, outside of an experimental context. We
conclude that marketing researchers and organizational decision makers should not
hesitate to run field experiments using treatment arms that they would also be
comfortable implementing as individual policy changes, since experimentation does not
make policies more objectionable. Similarly, implementing objectionable policies outside
of an experiment will not make them more palatable to the public.
FIELD EXPERIMENTS AND MARKETING SCIENCE
Experimentation provides an unrivalled source of actionable intelligence for
businesses, governments, and non-profit organizations (Zoumpoulis, Simester, &
Evgeniou, 2015), allowing researchers to identify the causal effects that alternative
policies have on behavior.12 Field experiments overcome the lower external validity of
stylized lab experiments by taking place in the precise environment where specific policy
changes will occur (DellaVigna, 2009). In part because of these advantages, field
experimentation has become a popular tool for marketing scholars that is used to test and
12 We define an experiment as an instance where an organization implements different policies for
complement existing theory, as well as develop new insights into buyer behavior on
wide-ranging topics. Within marketing, field experiments have been used to explore
charitable giving behavior (Sudhir, Roy, & Cherian, 2016), the effect of social influence
on the adoption of new technologies (Miller & Mobarak, 2015), strategies for inducing
multi-channel buying (Montaguti, Neslin, & Valentini, 2016), and consumer purchasing
habits after the end of a promotion (Yanwen Wang, Lewis, Cryder, & Sprigg, 2016).
Given the value of field experimentation, concerns about its acceptability must be
taken seriously. Many pundits and scholars have interpreted the backlash to well-known
field experiments as evidence that people have a broad and substantial aversion to
experimentation. Gino (2015), for instance, proposed that managers are hesitant to run
experiments within their own organizations, in part because they believe that customers
and employees do not want to be experimented on. Hill (2014) found that companies that
do run experiments often resort to using terms like “diagnostic test” or “A/B test” to
avoid presumed negative associations with experimentation (see also, Luca, 2014). M.
N. Meyer (2015) stated that people view field experiments as “more morally suspicious
than an immediate, universal implementation of an untested practice” (p. 278) and titled
this preference the “A/B illusion.”
If consumers are indeed averse to experimentation, it would constitute an
important barrier to evidence-based marketing and future collaborations between
academics and organizations. Organizational decision makers may hesitate to run or
engaging with companies that they believe will experiment on them. In this article, we
investigate whether or not such an aversion to experimentation exists.
THREE FORMS OF “EXPERIMENT AVERSION”
We define three different forms that experiment aversion could take and preview
our ability to empirically distinguish among them in this article:
1. Absolute experiment aversion – All experiments are deemed unacceptable,
independent of the policies they include.
2. Relative experiment aversion – An experiment is less acceptable than the
policies it contains, either because experimentation is a negative attribute (i.e.,
a main effect), or because the underlying policies are deemed less acceptable
when they are part of an experiment (i.e., an interaction). This means
experiments with acceptable policies could still be considered acceptable in
absolute terms, but less acceptable than their underlying policies.
3. Critical condition – There is no experiment aversion. The acceptability of an
experiment is instead a weighted average of the acceptability of its policies.
Most importantly, this implies an experiment is no less acceptable than its least
acceptable policy. Thus, an experiment is only viewed negatively if one of its
conditions is viewed negatively.
In Studies 1 and 2, we test for absolute experiment aversion and find several
instances where experiments are, in fact, rated positively. Thus, we reject absolute
against the acceptability of their underlying policies, finding that experiments are rated as
no less acceptable than their least acceptable policies, consistent with the critical
condition account of experiment aversion. Experiments, however, were also rated as less
acceptable than the simple average acceptability of the underlying policies. This may
reflect either moderate relative experiment aversion or negativity bias, where people give
more weight to negative attributes than to positive ones (e.g., Folkes & Kamins, 1999;
Rozin & Royzman, 2001; Skowronski & Carlston, 1989). In Study 5, we tease these two
apart by asking participants to evaluate experiments with two positive policies that are
similarly acceptable (thus negativity bias should be absent), and find no evidence of even
modest experiment aversion. Therefore, our combined results support the “critical
condition” account of experiment evaluation.
TRANSPARENT REPORTING
In all 5 studies, participants read scenarios describing an action that a company
could take (either an experiment or a universal policy change) and indicated how
acceptable each action is. We ran all studies, except for Study 3b, on Amazon’s
Mechanical Turk (MTurk) using Qualtrics. Study 3b was a pen-and-paper survey of
non-academic university staff.
Study materials, data, analysis code, and supplements for all studies as well as
preregistrations for Studies 3b-5 are available at https://osf.io/z39aq. We report studies in
the order they were conducted (except for Study 3b, which was added at the request of
reviewers and conducted after Study 4) and discuss all additional studies conducted but
size before beginning data collection.13 We report all data exclusions, all manipulations,
and all measures.
STUDY 1: PEOPLE DO FIND (SOME) EXPERIMENTS ACCEPTABLE
Our first study tests for absolute experiment aversion—people always object to
experiments, even if all conditions are unambiguously beneficial. We presented
participants with descriptions of corporate experiments that contained unambiguously
positive conditions (e.g., giving $5 to employees for visiting the gym) or unambiguously
negative conditions (e.g., taking $5 from employees for not visiting the gym). If absolute
experiment aversion exists, participants should find all experiments objectionable. If
experiments are instead evaluated based on their conditions, participants should only
object to experiments that contain unambiguously negative conditions. Throughout these
scenarios, we also added various aspects of experimentation that may contribute to
experiment aversion, such as deception and lack of consent. If these specific features
cause experiment aversion, participants should view these experiments negatively, even if
they have only unambiguously positive conditions.
Method
Sample. We recruited 577 participants on MTurk, of which 505 successfully
passed the attention check (37.5% female, Mage = 34.1 years). Participants were paid
$0.75 for completing the study.
13 In our online studies, we typically obtained sample sizes that slightly exceeded our goals because some
participants did not submit a completion code, allowing additional participants to take the survey.