Research article
Available online www.ijsrr.org
ISSN: 2279–0543
International Journal of Scientific Research and Reviews
Seismic Performance of G+4 Existing R.C.C Structure by Using
E-Tabs
Dinesh M
Department of Civil and Structural Engineering SCSVMV University Tamil nadu India
Kanchipuram-631561 Email: dineshstruct09@gmail.com
ABSTRACT
In past earthquakes many R.C.C concrete structures have been severely damaged or collapsed, have indicated the need for evaluating the seismic adequacy of existing buildings. In particular, the seismic rehabitation of older concrete structures in high seismicity areas is a matter of growing concern, since structures venerable to damage must be identified and an acceptable level of safety must be determined.to make such assessment, simplified linear-elastic methods are not adequate.
Although different procedures are possible, the non-linear static analysis, also known as the push over analysis, is a method for evaluating the performance. on this study, the method is used to evaluate the performances of RC plane frames. Reinforced concrete frame building are becoming increasingly common in urban and rular India due to increases in population and safety in such situation is much more important.
The static pushover analysis is becoming a popular tool for seismic performance evaluation of existing structures. The expectation is that the pushover analysis will provide adequate information on seismic demand imposed by the design ground motion on the structural system and its components. the purposes of the paper is to summarize the basic concepts on which the pushover analysis can be used. Asses the accuracy of pushover predictions, identify condition under which the push over will provide adequate information and perhaps more importantly, identify cases in which the pushover predictions will be inadequate or even misleading. The paper deals with non-linear analysis of an Existing RCC frame. The main aim is to carry out the pushover curves of the RCC frame and to calculate the displacement of the frame.
The analysis is carried out by using ETABS software. Push-over curves for the frame are obtained and carried out.
KEYWORDS
:
Limitstatemethod, Staddpro, Nonlinearstaic Analysis, ETABS, Pushover curve,Capacity Spectrum method, Performance point.*Correspondence Author
Dinesh M
Department of Civil and Structural
Engineering SCSVMV University Tamil nadu
India Kanchipuram-631561
1. INTRODUCTION
1.1
Back ground:
The major criteria now-a-days in designing RCC structures in seismic zones iscontrol of lateral displacement resulting from lateral forces. In this thesis effort has been made to
investigate the lateral displacement and Base Shear in RCC Frames. RCC Frames with G+4 are
considered.
Non-linear static analysis (pushover analysis) was carried out for the frames and the frames
were then compared with the push over curves. Displacement and Base shear are calculated from the
curves.
The nonlinear analysis of a frame has become an important tool for the study of the concrete
behaviour including its load-deflection pattern and cracks pattern. It helps in the study of various
characteristics ofconcrete member under different load condition.
1.2 Objective:
To study the performance of RC plane frames under lateral loads (Earthquake loads).
To study the inelastic response of RC plane frames using Pushover analysis
To study the variation of pushover curve for a plane framed structure.
1.3 Scope:
Only multi-storey frames are considered.
Plan irregularities are not considered.
Push over analysis is used as a non-linear static method to predict the actual
performance of the RC Frames under lateral loadings.
1.
METHODOLOGY
:For the purpose of study, a plan of G+4 floor levels were considered. For push over study,
RC plane frames in each floor were analysed and designed for gravity loads as per IS 456:2000 and
lateral loads (earthquake loads) as per IS 1893 (part-1):2002.
1.2 Structural Modelling
1.2.1 Introduction
Building codes are revised from time to time and the revision necessitates checking the
adequacy of existing building for the demand as per the latest codes of practice. Code of practice for
plain and reinforced concrete for general building construction was first published by the Bureau of
Indian Standards (BIS) in 1953 and subsequently got revised in 1957. It was further revised in 1964.
In this version and before only working stress method was in practice. The limit state design
Similarly, the code for criteria for earthquake resistant design of structures IS: 1893 was introduced
in 1962. This standard was subsequently revised in 1966, 1970, 1975, 1984 and 2002.
1.2.2 Code based Design
In India the two design approaches are used for the design of RC structures as per IS: 456 and
they are i) working stress method (IS: 1964and IS: 1978) and ii) limit state method (IS:
456-1978 and IS: 456-2000). The conceptual difference between working stress method and limit state
method is given in the Table 3.1. The estimation of design seismic base shear based on seismic
coefficient method as per the revisions of IS: 1893.The conceptual development and methodology
adopted in working stress and limit state method are discussed in the following sections along with
problem definition.
1.2.3 Flexure member
A reinforced concrete beam should be able to resist tensile, compressive and shear stresses induced
in it by loads on the beam. Concrete is fairly weak in tension and strong in compression. But steel
strong in tension. Thus, tensile weakness of concrete is overcome by the provision of reinforcing
steel in the tension zone round the concrete to make a reinforced concrete beam.
There are three types of reinforced concrete beams:
1) Singly reinforced beams
2) Doubly reinforced beams, and
3) Flanged beams.
Doubly reinforced sections are used in situation where reversal of moments is likely (as in
multistoried frame subjected to lateral loads)
1.2.4 Compression member
A column forms a very important component of a structure. Columns support beam which in
turn support walls and slabs. It should be realized that the failure of a column results in the collapse
of the structure. A column is defined as a compression member; Columns may be cast to any one of
the following shapes- square, rectangular, circular, hexagonal, octagonal, etc. for column members
the I.S. The procedure for design of compression member subjected to axial load and bending
moment as per IS: 456-1964. Recommendations for longitudinal and transverses details are given in
1.2.4.1 Long columns
A column will be considered as short when the ratio of the effective length to its least lateral
dimension is less than or equal to 12, otherwise the column will be considered as a long column.
1.2.5 Limit State Method
This method of design is based on limit state concepts. In this method, the structure shall be
designed to withstand safely all loads liable to act on it throughout its life; and it shall also satisfy the
serviceability requirements, such as limitations on deflection and cracking. The acceptable limit for
the safety and serviceability requirement before failure occurs is called limit state method. All
relevant limit states shall be considered in design to ensure an adequate degree of safety and
serviceability. In general, the structure shall be designed on the basics of the most critical limit state
and shall be checked for other limit states.The Design should be based on characteristic values for
material strengths and applied loads, which take into account the variations in the material strengths
and in the loads to be supported. The characteristic values should be based on statistical data if
available; the ‘design values’ are derived from the characteristics values through the use of partial
safety factors, one for material strengths and the other for loads. In the limit state method of design
which covers forms of failure, structure are designed for limit states at which the structures causes to
function, the most important thing is
1) The limit state of collapse or total failure of the structure.
2) The limit state of serviceability which includes excessive deflection and excessive local
damage.
1.3 Modelling
All the beam members and column members are drafted in auto cad and imported to
staad.pro. The loads and properties were assigned there and then imported to the respective software
i.e., E-tabs. The analysation there was performed, and results tabulated. The plan considered was
represented below.
1.4 Materials
The modulus of elasticity of reinforced concrete as per IS 456:2000 is given by
1.5 Structural Elements
In this section, the details of the modelling adopted for various elements of the frame are
1.5.1 Beams and Columns
Beams and columns were modelled as frame elements. The elements represent the strength,
stiffness and deformation capacity of the members. While modelling the beams and columns, the
properties to be assigned are cross sectional dimensions, reinforcement details and the type of
material used.
1.5.2 Beams and Columns joints
The beam-column joints are assumed to be rigid.
1.5.3 Foundation modelling
Fixed supports were provided at the ends of supporting columns.
1.6 loads
All loads acting on the building except wind load were considered. These are
1) Dead Load
2) Live Load
3) Lateral Load due to Earthquake
It was assumed that wind load will not govern the demands on the members.
1.7 Preliminary data
PRELIMINARY DATA:
TYPE OF THE STRUCTURE : MULTI-STOREY RIGID JOINED FRAME
ZONE : 3
NUMBER OF STORIES : FOUR (G+4)
GROUND STOREY HEIGHT :3 meters
FLOOR TO FLOOR HEIGHT :3 meters
EXTERNAL WALLS :230 mm (INCLUDING PLASTERING)
INTERNAL WALLS :150 mm (INCLUDING PLASTERING)
LIVE LOAD : 2 KN/m2
MATERIALS : M25 AND Fe 415
SEISMIC ANALYSIS : EQUIVALENT STATIC METHOD [ IS :1983 PART
1:2002]
DESIGN PHILOSOPHY : LIMITS STATE METHOD [ IS :1983 PART 1:2002]
DUCTILITY DESIGN :[ IS 13920:1993]
SIZE OF EXTERIOR COLUMN :300X300 mm
SIZE OF INTERIOR COLUMN :300X300 mm
LONGITUDINAL AND
TRANSVERSE DIRECTION :300X450 mm
TOTAL DEPTH OF SLAB :150 mm
1.8Loads Combinations
The load combinations considered in the analysis according to IS 1893:2002 are given
Table:1
Table: 1 load combinations
Load case Details of load cases
1 1.5(DL+LL)
2 1.2(DL+LL+EL) 3 1.2(DL+LL-EL)
4 1.5(DL+LL)
5 1.5(DL-EL)
6 0.9DL+1.5EL
7 0.9DL-1.5EL
1.9Loading Data
DEAD LOAD [DL]
Floor Finish (FF)1KN/Sq.m
Weight of Slab25: *D KN/Sq.m [D=Total depth of slab]
(Assuming total depth of slab150mm)
Weight of Walls Terrace Water Proofing (TWF): 1.2KN/Sq.m
External wall (250mm thick)
=4.45KN/m/meter height (17.8 @ 0.25)
Internal Wall (150mm thick)
=3.25KN/m/meter height (17.8@ 0.15)
LIVE LOAD [LL]
Roof =1.5KN/m2
Live load on floor: 2KN/m2
EARTHQUAKE LOAD [EQ]
Referring from IS Code 1893: Part 1(2002)
αh = (Z/2) *(Sa/g) *(I/R)
Z = 0.16(Zone 3)
Sa/g = 2.5
T = 0.09* h/sqrt.d
=0.09* 15/sqrt (7.4)
I (Importance factor) = 1.0
R (Response factor) =3.0[OMRF]
EARTHQUAKE LOAD ANALYSIS
Determination of total base shear
Dead load
a, weight of floor i.e (Ws+FF)
=42.30*7.40*(3.25+1.00)
=1330.33KN
b, weight of roof i.e (Ws+TWF+FF)
=42.30*7.40*(3.25+1.20+1.00)
=1705.95KN
C, weight of peripheral beams (transverse)
[{2(3.0-0.45/2-0.30/2) *3.375} *2+{1(2.4-0.30/2-0.30/2)*3.375}*2]
=35.44+14.175
=49.615KN
d, weight of peripheral beams (longitudinal)
= [{(2.8-0.30/2-0.30/2) *3.375*2}
+{(3.8-0.30/2-0.30/2)*3.375*2}+{(4.5-0.30/2-0.30/2)*3.375*2}}*2+{(4.5-0.30/2-0.30/2)*3.375*2}*2]
= [(16.875+23.625+56.70] +(56.7+56.7)]
=307.8KN
e, weight of parapet wall [1.0m height,150mm thick]
=2*(42.30+7.40) *1.0*3.25
=323.05KN
f, weight of external wall (thickness of wall 230m)
=20*0.230*(70.44+13.75) *(3.00-0.45)
=987.548KN
g, interior beam (transverse)
= [(3.0-0.3) +(2.4-0.3) +(3.0-0.3) *3.375*11*2]
=455.625KN
h, interior beam (longitudinal)
= {[{(2.8-0.3) +(3.8-0.3) +(4.5-0.3)} *3.375*9]} *2
=625.725KN
i, weight of interior wall
Length (transverse)
= {(3.0-0.45/2-0.3/2) *2+(2.4-0.3)} *8
=58.8m
Length (longitudinal)
= {(2.8-0.3) +(3.8-0.3) +(4.5-0.3) *9*2}
=183.6m
Height=3.00-0.56=2.55m
Weight =20*0.15*(58.8+183.6) *(3.00-0.45)
=1854.36KN
j, weight of exterior column /height
=2*12*0.30*0.30*25
=54.00KN/m
k, weight of interior column/height
=2*12*0.30*0.30*25
=54.00KN/m
LIVE LOAD
Live load on roof =zero
Live load on floors
=50%of 2KN/m.sqm=1KN/m.sqm
Total live load on each floor
=42.30*7.40*1
=313.02KN
Concentrated mass:
AT ROOF
= (b+c+d+e+(f/2) +g+h+(i/2) +(j*3/2) +(k*3/2) +0.0 = 5869.89KN
AT FIRST FLOOR
=(a+c+d+f+g+h+i+(j+k) *(3.0+3.0) *1.00)+313.02) = 6572.01KN
AT SECOND, THIRD, FOURTH FLOOR
==(a+c+d+f+g+h+i+(j+k) *(3.0) +313.02) = 6248.01KN
TOTAL WEIGHT
= 5869.89+(3*6248.01) +6572.01 = 31,185.93KN
TOTAL BASE SHEAR
= αh *w
=1871.15KN
BASE SHEAR @ EACH FRAME
Vb = 1871.15/12 = 155.92KN
DETERMINATIONS OF DESIGN LATERAL LOADS AT EACH FLOOR:
LOAD W1(KN) H1(m) Wi*Hi sqm Wi*hi sqm/ ∑Wi*hi sqm
Q1=Vb*Wi*hi
sqm/∑Wi*hi
sqm (KN)
ROOF 5869.89 15.00 1.32X10^6 0.439 68.44 FOURTH
FLOOR
6248.01 12.00 8.99X10^5 0.298 46.46 THIRD FLOOR 6248.01 9.00 5.06X10^5 0.168 26.19 SECONDFLOOR 6248.01 6.00 2.24X10^5 0.074 11.53 FIRST FLOOR 6572.01 3.00 5.9X10^4 0.019 2.96
GROUND FLOOR
_ 0.00 _ _ _
∑ = 3.01X10^6 0.99 (1.0) 155.58
Table: 2 Lateral Load Distribution
1.10 Structure Analysis
Fig: 2 RCC frame with reactions in (staad pro)
Fig: 4 RCC Frame with Bending Moment in (Staad Pro)
Table:3 Result of analysis under various load combinations
Members beams
Load case Shear(fy) Moment(mz) Max shear (fy)
Max moment (mz)
1 1 29.695 13.167 48.774 49.323 2 48.774 39.606
3 48.774 39.606 4 37.713 48.057 5 37.713 48.057 6 35.137 49.323 7 35.137 49.323 2 1 37.985 23.762
42.718 43.495 2 42.718 43.495
3 42.718 43.495 4 24.737 36.532 5 24.737 36.532 6 21.007 34.162 7 21.007 34.162
3 1 42.264 30.815 44.902 47.82 2 44.902 47.82
3 44.902 47.82 4 23.66 36.937 5 23.66 36.937 6 19.315 33.747 7 19.315 33.747
4 1 43.615 30.671 43.615 43.516 2 43.536 43.516
5 23.085 34.745 6 18.827 31.807 7 18.827 31.807
5 1 29.323 17.78 41.578 39.315 2 41.578 39.315
3 41.578 39.315 4 30.851 37.919 5 30.851 37.919 6 28.21 36.196 7 28.21 36.196
6 1 37.977 24.124 43.163 44.113 2 43.163 44.113
3 43.163 44.113 4 25.193 37.107 5 25.193 37.107 6 21.507 34.669
1.11 Structure Design
1.11.1 Design of Beams
Assuming 25mm dia bars with 25mm clear cover
Effective depth(d) = 450 – 25 – 25/2 = 412.5mm
d' / d = (25+12.5) / (412.5) = 0.091 =0.10
Reinforcement from table D, sp16 1980
Mulim /bdsq = 3.45 [for M25 and Fe415]
= 3.45 *300*412.5sq = 176.11KNm
Beam 1
Actual moment = 49.32KNm
Mulim = 176.11KNm
Actual moment is less than Mulim, so the section is a singly reinforced section.
Reinforcement from table 2, sp16 1980
Mu / bdsq = (49.32x10^6) / 300 *412.5sq = 0.96
Referring table3, sp16 1980 corresponding to Mu /bdsq & M25 = Pt = 0.291
Area = 0.291/100 *300*412.5 = 360.112sqmm
Provide [4 @ 16mm dia bars = 804.24sqmm]
1. Top and bottom reinforcement shall consist of atleast 2 bars throughout the member length.
2. Tension steel ratio
Min ≤ 0.24 *sqrt(fck/fy)
Hence ok
3. Max = 3.45 given 0.291
Maximum ratio at any section should not exceed = 3.45
Beam 2
Actual moment = 43.32KNm
Mulim = 176.11KNm
Actual moment is less than Mulim, so the section is a singly reinforced section.
Reinforcement from table 2, sp16 1980
Mu / bdsq = (43.32x10^6) / 300 *412.5sq = 0.85
Referring table3, sp16 1980 corresponding to Mu /bdsq & M25 = Pt = 0.246
Area = 0.246/100 *300*412.5 = 304.42sqmm
Provide [4 @ 16mm dia bars = 804.24sqmm]
1. Top and bottom reinforcement shall consist of atleast 2 bars throughout the member length.
2. Tension steel ratio
Min ≤ 0.24 *sqrt(fck/fy)
= 0.058 given 0.246
Hence ok
3. Max = 3.45 given 0.246
Maximum ratio at any section should not exceed = 3.45
Beam 3
Actual moment = 47.22KNm
Mulim = 176.11KNm
Actual moment is less than Mulim, so the section is a singly reinforced section.
Reinforcement from table 2, sp16 1980
Mu / bdsq = (47.22x10^6) / 300 *412.5sq = 0.85
Referring table3, sp16 1980 corresponding to Mu /bdsq & M25 = Pt = 0.276
Area = 0.276/100 *300*412.5 = 341.42sqmm
provide [4 @ 16mm dia bars = 804.24sqmm]
1. Top and bottom reinforcement shall consist of atleast 2 bars throughout the member length.
2. Tension steel ratio
Min ≤ 0.24 *sqrt(fck/fy)
= 0.058 given 0.276
Hence ok
Maximum ratio at any section should not exceed = 3.45
Beam 4
Actual moment = 30.87KNm
Mulim = 176.11KNm
Actual moment is less than Mulim, so the section is a singly reinforced section.
Reinforcement from table 2, sp16 1980
Mu / bdsq = (30.87x10^6) / 300 *412.5sq = 0.60
Referring table3, sp16 1980 corresponding to Mu /bdsq & M25 = Pt = 0.171
Area = 0.171/100 *300*412.5 = 211.612sqmm
Provide [4 @ 16mm dia bars = 804.24sqmm]
1. Top and bottom reinforcement shall consist of atleast 2 bars throughout the member length.
2. Tension steel ratio
Min ≤ 0.24 *sqrt(fck/fy)
= 0.058 given 0.171
Hence ok
3. Max = 3.45 given 0.171
Maximum ratio at any section should not exceed = 3.45
Beam 5
Actual moment = 24.285KNm
Mulim = 176.11KNm
Actual moment is less than Mulim, so the section is a singly reinforced section.
Reinforcement from table 2, sp16 1980
Mu / bdsq = (24.285x10^6) / 300 *412.5sq = 0.47
Referring table3, sp16 1980 corresponding to Mu /bdsq & M25 = Pt = 0.142
Area = 0.142/100 *300*412.5 = 175.42sqmm
Provide [4 @ 16mm dia bars = 804.24sqmm]
1. Top and bottom reinforcement shall consist of atleast 2 bars throughout the member length.
2. Tension steel ratio
Min ≤ 0.24 *sqrt(fck/fy)
= 0.058 given 0.142
Hence ok
3. Max = 3.45 given 0.142
Maximum ratio at any section should not exceed = 3.45
size of the column: 300 x 300 mm
grade - M25
vertical reinforcement – fe415
axial load - 1700 KN
bending moment - 56 KN-m
the general required of the column for ductility will follow from is-13920:1993
vertical reinforced of the column in designed according to 456:2000.
column subjected to bending and axial load
1. is 13920 :1993 specification will be applicable
2. if axial stress >0.1 fck
3. 1700 x 1000/300x300 = 18.89 n/sq.mm
4. 18.89> 2.5
5. minimum dimension of the member should be less than 200mm
6. shortest cross section dimension perpendicular dimensions should not be less than 0.4
7. i.e 300/300=1.0
8. vertical longitudinal reinforcement assumes 20mm dia with 40 mm cover
9. d'= 40+10=50mm
10. d'/10=50/300=0.16
11. from chart:45, sp-16,1980 (d'/d=0.15,415 n/sq.mm)
12. pu/fck bd=1700x1000/2250x1000=0.7556
13. reinforced on four side from chart 45, SP-16 ,1980
14. p/fck= 0.095, in reinforcement in %=0.095x25=2.375%
15. as=pbd/100=2.375x300x300/100=2137.4 sq.mm
16. lap splice only in central halg portion of the member hoop over the entire splice length at
spacing <150 not more than 50% bar shall be spliced at are section any are of column that extenda
more than 100mm should be detailed as per is: 13920:1993
17. TRANSVERSE REINFORCEMENT:
18. HOOP REQUIREMENT AS PER FIG-7, IS 13920:1993
19. IF THE LENGTH OF THE HOOP >300 mm A CROSS TIE SHALL BE PROVIDED AS
SHOWN IN FIG- 7B DETAILED AS FIG – 7C IN IS 13920:1993
20. HOOP SPACING SHOULD NOT BE GREATER THAN HALF LATERAL DIMENSIONS
OF THE COLUMN i.e 300/2=150mm
21. THE DESIGN SHEAR FORCE FOR COLUMN SHALL BE MAXIMUM OF (a) AND (b)
23. i.e, TABLE
24. FACTORED SHEAR GIVE BY
25. Vu=1.4[(MubLlim+ MubRlim)]/h
26. MubLlimand MubRlim MOMENT OF RESISTANCE OF OPPOSITE SIGN OF BEAM AND
bg IS THE STOREY HEIGHT
27. MOMENT OF RESISTANCE OF BEAM
28. d'/d = 0.10
29. Mu/bd2=56/0.3x 0.3 =6.2 N/mm2
30. FROM THE TABLE 50 FROM CODE SP-16:1980
31. Pt=2.045
32. Pt=1.146
33. Pt=2.045 X 300 X 412.52
34. 2530.75 mm2 (4@20 dia +4@ 22 dia = 2776.63 mm2)
35. Pb=21.146x300x412.52=1418.17 mm22 (2@16 dia + 4@ 22 dia = 1922mm2)
36. REFFERING TABLE 2, SP 16:1980
37. Mulim/bd2=1.45
38. Mulim(HOGGING MOMENT CAPACITY = 1.45 X 300 X 3002=391.5 KN-m
39. Mulim/bd2=1.20
40. SAGGING MOMENT CAPACITY = 1.20 X 300 X 3002=324 KN-m
41. Vu = 1.4 (392 +324)/3 = 335.07 KN
42. Vc = Γcbd= 0.53 X 300 X (300-50) =39.750 KN
43. Γc= 1X 1.67
44. ð = 1+3 Pu/Agfck= 1+3X 1700X102/90X1000X25=3.36
45. As=Pbd/100
46. Chart -45
47. P/fck = 0.08 REINFORCEMENT IN %
48. = 0.08 X 25 = 2%
49. As=pbd/100=2x 300X 300/100 = 1800mm2
50. 6@20 dia = 1885 mm2
51. Ast=As/2=942
52. THERE FORE NOMINAL SHEAR REINFORCEMENT SHALL BE PROVIDED IN
ACCORDSNCE WITH 26.5.16 OF IS 456:2000
53. USE 8mm dia TWO LEGGED STIRRUPS
55. For minimum stirrups
56. Sv ≤ Asv 0.87fy/0.4 X b=300
57. THE SPACING SHALL BE LESSER OF
58. 0.75d= 0.75X 250 = 187.5 mm
59. 300 mm (7.3.1)
60. 302 mm AS CALCULATED
61. SPECIAL CONFINING REINFORCEMENT
62. SPECIAL CONFINING REINFORCEMENT WILL PROVIDE OVER A LENGTH
63. OF 10 TOWARDS THE MID SPAN COLUMN
64. b <≠ {DETH OF MEMBER =300mm
{1/6(CLEAR SPAN = (3-0.45)/6X425
{450mm.
65. THE SPACING OF HOOP SHALL NOT EXCEED
66. ðMAX ≥≠ {1/4(MINIMUM MEMBER DIMENSION) SHOULD NOT BE LESS THAN
75mm (Sh), SHOULD NOT BE GREATER THAN 100mm.}
67. MINIMUM AREA OF CROSS SECTION OF THE BAR FORCING HOOP IN
68. Ash= 0.18X Sh X fck/fy(Ag/Ak-1.0)
69. 89.45 mm2
70. JOINT FRAMES:
71. THE SPECIAL CONFINING REINFORCEMENT AS REQUIRED AT THE END OF
COLUMN SHALL BE PROVIDED THROUGH THE JOINT AS WELL ENLESS THE JOINT IS
CONFINED BY 8.2
72. A JOINT WHICH HAS BEAM FRAMES INTO ALL VERTICAL FACES OF IT AND
BEAM WIDTH IS AT LEAST ¾ OF THE COLUMN WIDTH MAY BE PROVIDED WITHJ
HALF THE SPECIAL CONFINING REINFORCEMENT REQUIRED AT THE END OF THE OF
THE COLUMN THE SPACING OF HOOP SHALL NOT EXCEED 150mm
73. Ash= 89.45/2=44.72mm2
74. Use 8mm dia bar (50.26mm2) AT A USE 8mmdia BAR (50.26mm2) AT A SPACING OF
94.8 X50.26/44.72=106.5mm.
2. Pushover Analysis of frame
Pushover analysis of frames
Pushover analysis is a static, nonlinear procedure in which the magnitude of the lateral loads
is incrementally increased, maintaining a predefined distribution pattern along the height of the
and the maximum inelastic deflection. Local nonlinear effects are modelled, and the structure is
pushed until a collapse mechanism is developed. At each step, the base shear and the roof
displacement can be plotted to generate the pushover curve.
2.1Necessity of Non-Linear Stati Pushover Analysis(NLSA)
The existing building can become seismically deficient since seismic design code requirements are
constantly upgraded and advancement in engineering knowledge. Further, Indian buildings built over
past two decades are seismically deficient because of lack of awareness regarding seismic behaviour
of structures. The wide spread damage especially to RC buildings during earthquakes exposed the
construction practices being adopted around the world, and generated a great demand for seismic
evaluation and retrofitting of existing building stocks
2.1.1Purpose of Push-Over Analysis
The purpose of pushover analysis is to evaluate the expected performance of structural systems by
estimating performance of a structural system by estimating its strength and deformation demands in
design earthquakes by means of static inelastic analysis and comparing these demands to available
capacities at the performance levels of interest. The evaluation is based on an assessment of
important performance parameters, including global drift, inter-story drift, inelastic element
deformations (either absolute or normalized with respect to a yield value), deformations between
elements, and element connection forces (for elements and connections that cannot sustain inelastic
deformations), The inelastic static pushover analysis can be viewed as a method for predicting
seismic force and deformation demands, which accounts in an approximate manner for the
redistribution of internal forces that no longer can be resisted within the elastic range of structural
behaviour.
2.1.2Non-Linear Static Analysis for buildings
Seismic analysis of buildings can be categorized depending upon the sophistication of modelling
adopted for the analysis. Buildings loaded beyond the elastic range can be analysed using
Non-Linear static analysis, but in this method, one would not be able to capture the dynamic response,
especially the higher mode effects. This is pushover analysis. There is no specific code for NLSA.
This procedure leads to the capacity curve which can be compared with design spectrum/DCR of
members and one can determine whether the building is safe or needs strengthening and its extent.
The capacity of structure is represented by pushover curve. The most convenient way to plot the load
deformation curve is by tracking the base shear and the roof displacement. The pushover procedure
can be presented in various forms can be used in a variety of forms for the use in a variety of
pattern, incrementally, until the structure reaches the limit state. There are several types of
sophistication that can be used over for pushover curve analysis.
Level-1: It is generally used for single storey building, where at a single concentrated horizontal
force equal to base shear applied at the top of the structure and displacement is obtained.
Level-2:In this level, lateral force in proportion to storey mass is applied at different floor levels in
accordance with IS: 1893-2002 (Part-I) procedure, and story drift is obtained.
Level-3: In this method lateral force is applied in proportion to the product of storey masses and first
mode shape elastic model of the structure. The pushover curve is constructed to represent the first
mode response of structure based on the assumption that the fundamental mode of vibration is the
predominant response of the structure. This procedure is valid for tall buildings with fundamental
period of vibration upto 1 sec.
Level-4: This procedure is applied to soft storey buildings, wherein lateral force in proportion to
product of storey masses and first mode of shape of elastic model of the structure, until first yielding,
the forces are adjusted with the changing the deflected shape.
Level-5:This procedure is similar to level 3 and level 4 but the effect of higher mode of vibration in
determining yielding in individual structural element are included while plotting the pushover curve
for the building in terms of the first mode lateral forces and displacements. The higher mode effects
can be determined by doing higher mode pushover analysis. For the higher modes, structure is
pushed and pulled concurrently to maintain the mode shape.
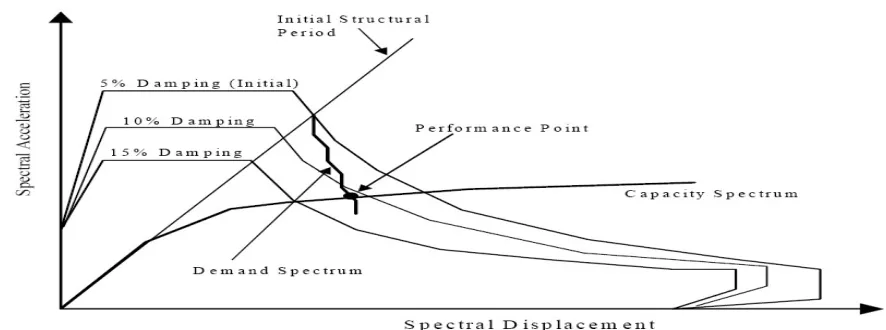
2.1.3 Capacity Spectrum method
The nonlinear static pushover analysis is a comprehensive method of evaluating earth quake
response of structures explicitly considering nonlinear behaviour of structure elements. The capacity
spectrum method is on approach for implementing pushover analysis that compares structure capacity with
The capacity spectrum method estimates peak response by expressing both structure capacity and
ground shaking demand in terms of spectral acceleration and displacement (hence the name capacity
spectrum)
A capacity spectrum is the base shear versus roof displacement curve. When the demand spectrum
is plotted along with the capacity spectrum in an Acceleration Displacement Response Spectrum (ADRS)
format, the two curves may meet to give a performance point. The performance point represents the
maximum deformation and the degree of damage that the building will sustain the applied static forces.
Fig -5 capacity spectrum curve
2.2 Seismic load Distribution
Pushover analysis requires the seismic load distribution with which the structure will
be displaced incrementally. The load distribution is based on the first three mode shapes.
2.3Different Hinge properties in Pushover Analysis
There are three types of hinge properties in E-Tabs. They are
1) Default hinge properties,
2) User-defined hinge
properties and
3) Generated hinge properties.
Only default hinge properties and user-defined hinge properties can be assigned to frame
elements. When these hinge properties are assigned to a frame element, the program automatically
creates a different generated hinge property for every hinge.
2.4 Limitations of Pushover Analysis
Although pushover analysis has advantages over elastic analysis procedures, underlying
assumptions, the accuracy of pushover predictions and limitations of current pushover procedures
identification of failure mechanisms due to higher modes of vibration are important issues that affect
the accuracy of pushover results.
3.Modelling of frame
3.1Modelling of frame
All the preliminary modelling was done in staad.pro and the modelled frame was imported
into E-Tabs. A four-storey frame was modelled in STAAD Pro. and imported to E-Tabs. The main
aim is to derive the difference in displacement & Base Shear.
3.2Member Properties
All the beams in the frame were sized to 0.30m X 0.45m
All the columns in the frame were sized to 0.3m X 0.3m in case-1
The slab of 0.15m thickness was taken for the analysis purpose and assigned to
each floor.
Default M3hinge was assigned to beams.
Default P-M-M hinge was assigned to columns.
3.3Member Loading
All the members were assigned the following loadings.
Self-Weight
External Wall Load--- 17.8 KN/m
Internal Wall Load--- 14 KN/m
Live Load--- 2 KN/m
Earth Quake Loading--- as per IS-code:1983-2002
It was assumed that the wind force was not governing the frame efficiency.
3.4 Push over cases
Two pushover cases were defined for the analysis
Push1 also known as gravity pish which is done for gravity loading (DL+LL) for which it is
done in Load defined pattern.
Push-2also known as lateral push in which the governing load is lateral load (EQ)for which it
is done in displacement defined pattern.
4.RESULTS AND DISCUSSIONS
The results from the analysis are the deflected shape and the formation of hinges with
increasing load and their performance levels.
The frames can be found from the displacement and base shear plots i.e., push-over curve.
Capacity Spectrum curve can be drawn from the analysed plot.
From the capacity spectrum curve the existence of performance point can be noted. If the
performance point doesn’t exist, the structure fails to achieve the target performance level.
Fig: 6 RCC Frame (Plan) in ETABS
Fig: 8 RCC frame with user defined Hinges
Table: 4 RCC frame Pushover curve
PUSHOVER CURVE OF FRAME
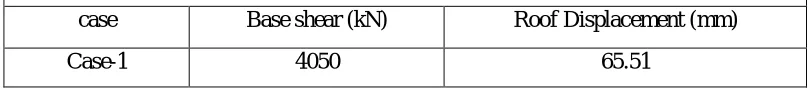
Table :6 Maximum Base shear and Roof displacement for the G+4-storey building
case Base shear (kN) Roof Displacement (mm)
Case-1 4050 65.51
4.2 Summary and Conclusioms
Performance evaluation procedures aim at assessing the inelastic base shear and inelastic
displacement capacity of existing building. Modelling of building for performance evaluation
necessitates the knowledge about the section and reinforcement details of existing buildings.
In this thesis, the evolution of RC design procedure of limit state method as given in different
versions of IS: 456 are discussed. Various provisions in detailing such as minimum and maximum
compression / tension reinforcement, transverses reinforcement for flexural and compression
members with appropriate spacing of rectangular stirrups are critically reviewed and tabulated.
Design steps for Reinforced concrete beams and columns as per limit state method are presented.
Spread sheets are developed for the design of RC beams and columns as per limit state method.
In this thesis one typical designs have been carried out as per present codes of practice. The
nonlinear static analyses are carried out and the capacity curves are generated. The actual values of
maximum base shear and roof displacement capacities for the frame are brought out clearly. The
performance points are obtained, and the corresponding base shear and roof displacements are
arrived for NTC 2008 Target Displacement. It is clearly found that the frame to meet the
performance point.
REFERENCES
1. ATC-40 Seismic evaluation and retrofit of concrete building” , Redwood City, CA: Applied
Technology Council, 1996; 1&2.
2. Anthoine A, A simple displacement control technique for pushover Analyses, Earthquake
Engineering Structure Dynamic. 2006; 35: 851-866.
3. ATC, Development of performance-based Earthquake Design Guidelines”. ATC 58,
Redwood City, 2002.
4. Bertero R.D and Bertero V.V Performance- based seismic engineering: the need for a reliable
conceptual comprehensive approach, Earthquake engineering &Structural Dynamics 2002; 31:
5. Chopra A.K and Goel R.K, A modal pushover analysis procedure for estimating seismic
demands buildings, Earthquake Engineering and Structural Dynamics, 2001; 31: 561-582.
6. CSI, Computers and Structures Inc., SAP 2000- Static and dynamic finite element analysis of
structures. Berkely, USA, 20005.
7. Fajfar P, Capacity Spectrum Method based on Inelastic demand Spectra, Earthquake
Engineering & Structural Dynamics 1999; 28: 979-993.
8. FEMA- 273, NEHRP Guidelines for the Seismic Rehabilitation of Buildings”, Federal
Emergency Management Agency, Washington DC,1997.\
9. FEMA -356 (2000), Pre-standards and commentary for the seismic rehabilitation of
buildings”, Federal Emergency Management Agency, Washington DC,1997.
10. Ghobarah A, KalKan E, Kunnath S.K, Performance-based design in earthquake engineering:
State of development, Engineering Structures, 2001; 23: 878-884.
11. IS: 456:2000 Indian standard for plain and Reinforced Concrete Code of Practice, Bureau of
Indian Standards, New Delhi-110002.
12. IS: 1893 (Part 1) Indian standards Criteria for Earthquake Resistant Design of Structures,
Bureau of Indian Standards, plain and New Delhi-110002.
13. KalKan E, and Kunnath S.K (2006), Adapative Modal Combination Procedure for Nonlinear
Static Analysis of Building Structure, Journal of structural engineering ASCE, November 2006.
14. Kailar V and Fajfar P, Simple Push-over Analysis of Asymmetric Buildings, Earthquake
Engineering and Structural Dynamics, 1997; 26: 233-249.
15. Krawinkler H, Seneviratana G.D.P.K, Pros and Cons of a pushover analysis of seiemic
performance evaluation, Engineering Structures, 1998; 20( 4-6): 452-464.
16. Kappos A.J and Panagopoulos G, Performance- Based seismic design of 3D RC Building
using inelastic static and dynamic analysis procedures, ISET Journal of Earthquake Technology,
paper No444, March 2004; 41(1): 141-158.
17. KalKan E and Kunnath S.K Assessment of current nonlinear static procedure for seismic
evaluation of Building Structures, 2007; 29: 305-316.
18. Lin Y.Y, Chang K.C and Wang YL, Comparison of displacement coefficient method and
capacity spectrum method with experiment results of RC Columns, Earthquake Engineering structure
Dyn.2004; 33: 35-48.
19. Moghadam A.S and Tso W.K, 3-D Pushover Analysis for Damage Assessment of Buildings,
JSEE: Summer 2000; 2(3).
20. Mario Paz Structural Dynamics (Theory and Computation), Second Edition, CBS Publishers.
21. Pinho R, Antoniou S, Casarotti C, Lopez M, An Innovative Displacement- Based Adaptive
Pushover Algorithm for Assessment of Building and Bridges, Advances in Earthquake Engineering
for urban risk reduction. NATO Workshop, Istanbul 2005.
22. Pan P and Ohsaki M, Nonlinear multimodal pushover analysis method for spatial structure,