328
Development Of A Computerized I-V-Tracing
System For Solar PV Module Testing
Gour Chand Mazumder, Partha Ranjan Biswas, Nasif Shams, Saiful Huque, Md. Habibur Rahman
Abstract: this paper is about a development work of I-V-Curve tracing system. The system is automatic and replaces manual procedure of conventional I-V-Curve tracing method for Photovoltaic Solar Cell or Panel. This system is basically a combination of several blocks consisted by electronic devices and instrument groups. Some blocks are developed for measurement requirements and some are proprietary. This instrument can be used at solar module assembling industry for panel testing. In recent years there are significant rises on the counts of these types of business in developing countries. As this particular requires much lesser cost in comparison to other such type, it is expected that this device may contribute to solar industry to help manufacturing process and quality control. Universities and laboratories may also find this suitable for their purpose. Although there are some little fluctuations in the acquired data, the system can analyze the module characteristics properly.
Keywords: Solar Photovoltaic Module; I-V-Characteristics Curve, Voltage sensor; Current Sensor; Staircase Generator; Active Load; Threshold Attenuation; Arduino Uno; Fill Factor
————————————————————
I.
INTRODUCTION
This particular system is capable to measure performance parameters of a solar cell as well as module automatically.
Fig.1. Connection Diagram of Conventional Method I-V-Tracing
The performance parameters are IV characteristics curve, Maximum power point, Fill factor etc. Conventional Method of determining these parameters is a tedious manual process. Beside this there is a common problem occurs in this measurement setup. When very low resistance is applied, huge current flows and burns the resistance. In that method a variable resistance is needed to be connected with PV module.
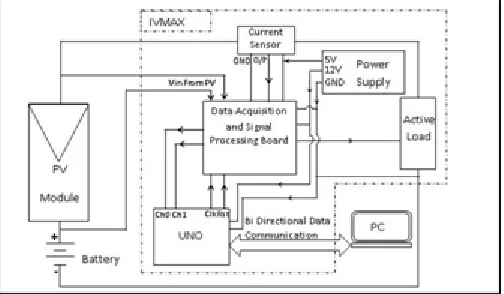
This resistance is used as the load. Generally a Potentiometer is used for this purpose. Someone needs to change the load manually and take voltage and current data corresponding to that load. Meanwhile the solar radiance data should be recorded. This instrument incorporates these tasks altogether, automates the process and solves problems. Beside this the system will be accessible and can be run from a computer and data will be saved in hard drive which facilitates easy calculation later. To do so a handful number of individual working units were developed and synchronized their tasks. Figure01 shows a conventional method of determining I-V-Curve tracing. At the time of system design the philosophy of conventional system was kept in mind and an active load was developed to replace the manual variable resistance. This
Fig. 02. The block diagram of the entire system. active load is actually a programmable variable resistance. The program was set to trigger a staircase circuit. Stair case circuit will continue to change active load resistance level. At different level of resistance the current and voltage values from the panels will be different. Data at each value of resistance was taken. It was scoped by the program. Active load plays a very important role to automate overall measurement process of this system. Arduino sends a clock signal to the staircase circuit resides in acquisition card. When staircase unit receives a clock signal it starts changing the resistance level of active load. Staircase generator controls the active load. A battery was used to ________________________
Gour Chand Mazumder, Institute of Energy, University Of Dhaka, Dhaka, Bangladesh, [email protected] Partha Ranjan Biswas, Institute of Energy, University Of
Dhaka, Dhaka, Bangladesh, [email protected] Nasif Shams, Institute of Energy, University Of Dhaka,
Dhaka, Bangladesh, [email protected]
Saiful Huque, Institute of Energy, University Of Dhaka, Dhaka, Bangladesh, [email protected]
329 detect the negative voltage during short circuit condition of
measurement process. The working mechanism of each developed block will be described in following sections and some sample data taken during the test in laboratory will be shown.
A. Voltage Sensor
In this case voltage difference of the pv panel is measured with the help of a difference amplifier. This circuit is non inverting amplifier and an attenuator in nature, figure 03. The highest input voltage for the difference amplifier is open circuit voltage from PV panel. Output of difference amplifier for this arrangement is the difference between battery positive terminal voltage and PV panel positive terminal voltage. See figure 03. These two inputs were taken with respect to the negative terminal of battery. PV panel remains in series with the battery, see figure 02; and negative terminal of battery only reaches the ground directly. Finally this circuit gives the difference of its two input values with respect to the ground. The output will be equivalent to the feed voltage of non-inverting terminal in this case and which is the required data for PV voltage. This plain value of voltage is attenuated by tuning the
Fig. 03. Voltage Sensor Circuit Diagram
resistance value at offset null and was feed to the channel 0 of Arduino, see figure 02. As third party device does not permit to send more than 5v so the highest possible value of voltage was attenuated 5 volt and lowest as zero. However, in this arrangement there is a possibility that the voltage across the pv panel become negative during the measurement of short circuit current. Because the input voltage from the panel will be forced to be zero and the battery will be supplying current. This condition can alter the voltage across the pv panel. That is why the program of this circuit is designed to always keep the output in the positive side and we used a battery.
B. Current Conditioning Circuit
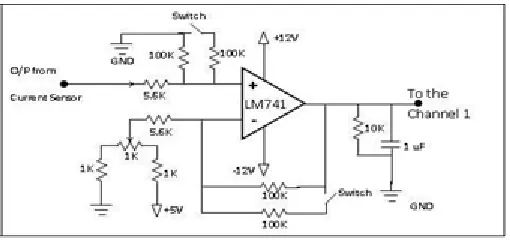
We used a current sensor unit which is a third party device named Allegro ACS712. This device uses hall sensor and its output is voltage. A conditioning circuit, see Figure 04; is used to attenuate the output of current sensor. Current senor output is directly feed into conditioning circuit’s input terminal. As manufacturer specification, input output/output characteristics of current sensors 0 (zero) volt for 0 (zero) ampere, 5 (five) volt for 10 and can measure up to 30 ampere of current at this ratio. Current conditioning circuit is used to scale down the current sensor output to fit the Arduino input capacity. The final output from this conditioning circuit is 2.5V for 0A, 3V for 10A and 5V for 30A. To achieve this we developed a difference amplifier as our current conditioning circuit. This is a
non-inverting amplifier. We fed 2.5 volt with respect to the ground to its inverting terminal through an adjustable voltage divider. Current sensor also gives output with respect to the ground itself and was fed to the non-inverting leg of the op-amp. When the output of current sensor is 2.5V the conditioning circuit will give 0V and 0.5V for 3V input, figure04.
Fig.04. Conditioning circuit for the current sensor
Figure 05: Conditioning circuit characteristics This circuit has two sensitivity switches to select data sampling rate. We denoted this as high and low resolution sensing. The output of this circuit is fed to the channel 1 of Arduino. [07]The gain of this amplifier is 10dB (adjustable with the help of sensitivity switches, switch 1 and 2). Gain of this circuit actually controls the data sampling rate. We have set another switching arrangement in the inverting side also. This is useful to modify or scale the non-inverting input further.
C. Active Load
330 exclusively to develop the active load. To operate the
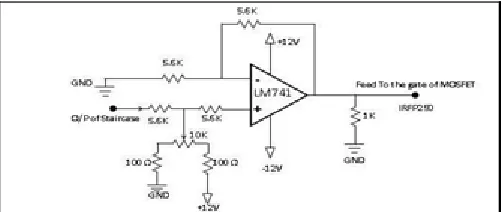
MOSFET in its linear region we needed a series of voltage which are gradually increasing in nature.
Figure 06: Active load Circuit
We used IRFP25 as the active device and a stair case voltage generator for sending different voltage levels to its gate. The threshold level of that device is 4.50 volt so minimum 4.5 volt is required for the initialization of its required operation. [08]
Fig. 07.Transfer characteristics of the MOSFET
D. Stair Case Generator
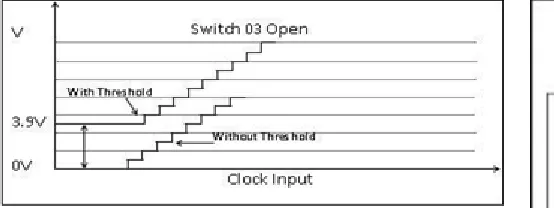
The staircase generator receives clock and reset signals sent from the Arduino. This Staircase generator produces a series of voltages with respect to the series of pulses given to its clock input, figure 08. The staircase generator, Figure 8; is composed of one analog to digital converter DAC0808 IC and two74LS293 binary counters. We implemented an 8 bit synchronous counter by these two 74LS293 IC. The outputs are then directly feed to DAC0808 an 8 bit digital to analog converter. This IC converts the binary inputs to the corresponding analog voltages. The analog output from DAC0808 is then passed through an amplifier. The feedback resistance value of this amplifier can be changed. [13]This results two different levels of gain and gives two different step size of the staircase. We used a switching arrangement between two similar parallel resistances in the feedback path. Figure 23 shows the output of the amplifier stage of the stair case generator. If the switch 03 remains open the gain will be higher and the step size will be bigger. The case is opposite when the switch is closed. Bigger steps will result in less number of acquired data. We have already discussed earlier that we need initially 4.5 volt to reach the threshold point of the IRFP250. The amount of current flow is dependent on this active load. The UNO sends the clock pulses to the counter in a regular interval.
Fig. 8. Stair case generator
Figure 09: Representation of the stair case generated by the circuit
E. Threshold Supply Circuit
As the counter values change, the staircase voltage increases in every count. In each voltage level there will be change in the resistance level inside the channel between the drain and source of the MOSFET. [10] With the changes in resistance the current will change. Before sending next clock the corresponding voltage and current from the system is taken thereby. It is assumed to get data in each clock. If we send the staircase directly to the gate of the MOSFET, we will lose a handful and important data of current and voltages from PV panels. If we do not initialize the MOSFET to its threshold it will take many steps to reach at the threshold level by the staircase itself. We have scope the accuracy and resolution of our instrument by this adaption. This also ensures the certainty of the operation. [11] [12].
Fig. 10. Threshold Supply Circuit
331
Figure 11: Stair case with and without the threshold voltage
II.
PROGRAM FLOW
The system may refer as an automated data acquisition instrument. The program is written on the Arduino UNO platform. Arduino has its own programming language and computer interface. [12] This is a microcontroller based module. Here we are describing the basic workflow of the overall instrument. The program starts with the declaration of some variables. These are namely IP for PV current, IPA for average PV current, VP for PV voltage and VPA for average PV voltage. These variables are string type. Then Arduino sends a reset signal to the counter circuit pin no 12,13 which are shorted together. This resets all values to zero. This time the MOSFET gate signal will be of 4.5 volt. It means the open circuit condition and this is our starting step of the measurement. Then increase counter value by 1 and check the value for 255. If it is no then read the channel 0 for 10 times and store these values to the variable IP and again read channel 1 for 10 times and store values to the variable VP predominantly we feed the current sensing circuit output to the channel 0 and voltage sensing circuit output to the channel 1. [12] After this the average of these values two variables will be stored respectively in IPA and VPA. These IPA and VPA will be sent to the Arduino console in the computer through USB channel. After doing this it will check for the VPA for zero. If zero is found it means the short circuit condition for the panel. This is the end condition for the operation. Then a reset signal will be given to the counter and the program will enter in an infinite loop to make the device idle.
III.
CALIBRATION
TO
LINEARITY
AND
DETERMINATION
OF
CONVERSION
FACTORS FOR DATA REALIZATION
The calibration is done for the current sensor, voltage sensor and staircase generator circuit. To calibrate in an efficient way it is obligatory to take as many data as possible. So, we took data for every aspect like high and low resolution for current (In high resolution the amount of data taken are much higher than the low resolution for same scale of input) and step size for staircase in smaller and larger steps. Data taken was enough to calibrate the measurement in a satisfactory level.
Figure12: Work Flow Diagram
A. Current Sensor Calibration
To calibrate the current sensor we used a dc current generator to feed a variable load. We connected the sensor in series with that load. At different values of load different amount of current flew through the sensor and we took those sensor output by Arduino and recorded the corresponding sensor output and Arduino output at computer. After that the data was tabulated and determined the conversion factor. These data present the input current from current generator and output value from Arduino. The ratio between input and output represents the conversion factor. We have taken the average of the conversion factor for each dataset. For low resolution it is 0.009254694 and 0.004637175 for high. The data was taken in both low resolution (switch ON) and high resolution mode (switch OFF). [13]. Here we have shown only for low resolution data conversion factor in table 1.
TABLE 1: CURRENT SENSOR CALIBRATION WHEN SENSITIVITY SWITCHES ARE ON.
B. Voltage Sensor Calibration
Voltage calibration procedure is the same as it is described in the previous section. We used a voltage divider circuit connected to a voltage source for voltage sensor calibration. The voltage across a resistance is fed to the sensor and data was taken through Arduino. At first we took data for 24 volt system. Voltage was supplied through a variable DC voltage source up to 27.6 volt. Each data set found from Arduino corresponding to the voltage applied was recorded as before. Here the average voltage conversion factor is 0.027421202. Later we used two 33kΩ resistors for voltage divider and calibrated for larger than 27.6 volt. For this conversion factor was found 0.159889938.
C. Staircase Step Size Determination
332 (smaller step size) and OFF for low resolution (larger step
size). We found Average smaller Step size is 0.05 volt and Average larger Step size 0.61 volt.
D. PV Module Testing and Data presentation
After calibrating the instrument developed it was necessary to have some test run. The first test run resultant graph is given below, The converted value, in this case, the current and voltage values found by the multiplication by the conversion factor were also plotted the graph is given below, It is clear that the amount of data at the first is not sufficient to get a standard I-V curve. It was identified that the staircase step size was too large to get sufficient data at the first few moments. After realizing the problem the staircase size was modified and test was run again the graph is shown in figure 23.The converted data plot is also shown here,
TABLE 2: VOLTAGE SENSOR CALIBRATION
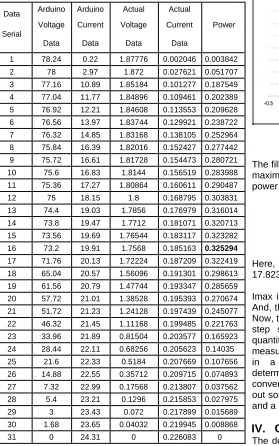
Data Arduino Arduino Actual Actual Voltage Current Voltage Current Power Serial
Data Data Data Data
1 78.24 0.22 1.87776 0.002046 0.003842 2 78 2.97 1.872 0.027621 0.051707 3 77.16 10.89 1.85184 0.101277 0.187549 4 77.04 11.77 1.84896 0.109461 0.202389 5 76.92 12.21 1.84608 0.113553 0.209628 6 76.56 13.97 1.83744 0.129921 0.238722 7 76.32 14.85 1.83168 0.138105 0.252964 8 75.84 16.39 1.82016 0.152427 0.277442 9 75.72 16.61 1.81728 0.154473 0.280721 10 75.6 16.83 1.8144 0.156519 0.283988 11 75.36 17.27 1.80864 0.160611 0.290487 12 75 18.15 1.8 0.168795 0.303831 13 74.4 19.03 1.7856 0.176979 0.316014 14 73.8 19.47 1.7712 0.181071 0.320713 15 73.56 19.69 1.76544 0.183117 0.323282 16 73.2 19.91 1.7568 0.185163 0.325294 17 71.76 20.13 1.72224 0.187209 0.322419 18 65.04 20.57 1.56096 0.191301 0.298613 19 61.56 20.79 1.47744 0.193347 0.285659 20 57.72 21.01 1.38528 0.195393 0.270674 21 51.72 21.23 1.24128 0.197439 0.245077 22 46.32 21.45 1.11168 0.199485 0.221763 23 33.96 21.89 0.81504 0.203577 0.165923 24 28.44 22.11 0.68256 0.205623 0.14035 25 21.6 22.33 0.5184 0.207669 0.107656 26 14.88 22.55 0.35712 0.209715 0.074893 27 7.32 22.99 0.17568 0.213807 0.037562 28 5.4 23.21 0.1296 0.215853 0.027975 29 3 23.43 0.072 0.217899 0.015689 30 1.68 23.65 0.04032 0.219945 0.008868
31 0 24.31 0 0.226083 0
Figure 23: I-V curve of the module tested The power curve of the module is also given below,
Figure 24: Power curve of the module tested The fill factor of the module was calculated by measuring maximum voltage, maximum current and the maximum power point. The formula is,
= ×
Here, Vmax is the value of the maximum voltage = 17.8237813
Imax is the value of the maximum current = 0.6306558 And, the maximum power point is, Pmax = 8.599113357 Now, the fill factor is 0.765 The conversion factor and the step sizes of the staircase generator are the two quantities should be accurate for error free measurement. It is found that the values obtained were in a consistence behavior which facilitates the determination of the various circuit constant like conversion factor and step size. The first test run pointed out some problem with the step size but it was corrected and a better less fluctuated data were acquired.
IV.
CONCLUSION
333 properly although it has some fluctuations. This system can
take up to 256 sets of voltage and current data within a second. Development of this instrument was not very costly as we used very basic, cost effective electronic devices available in local market. This system requires less costing than other similar packages available. [3] Our system can measure up to 27.6 volt and 10 Ampere of maximum current. That means it can test solar panels of 250 Watt easily. It is a common practice to measure the voltage and current of the solar modules along with radiation measurement. [14] At present we haven’t deployed that feature in our instrument. But this will not hamper the measurement process because the instrument takes data within a second so radiation can be measured easily for that time slab [14]. This is a limitation of our instrument. The instrument size is small, portable and conveyable. The system needs only 12 volt power supply. We recommend using the instrument in the laboratory environment where a computer and other accessories like batteries will be available. As solar module assembling companies are emerging in developing countries, they can use this as module testing instrument.
REFERENCE
[1] N. Akter, Alternative Energy Situation in Bangladesh,a Country Review , Regional Training Orientation Course on Alternative Energy Technologies, Approtech ASIA, Philippine Social Development Center, Philippines, July 1997
[2] D. Markova, St. Platikanov and M. Petkov, Modelling of Electrical Characteristics of Photovoltaic Power Supply Sources, Technical University of Gabrovo, Faculty of Electrical Engineering and Electronics , HadjiDimitar Str., 5300 Gabrovo, Bulgaria
[3] Q. Folker and R. Hanitsch, Numerical Simulation of Current-Voltage Characteristics of Photovoltaic Systems with Shaded Solar Cells, Solar Energy, (1996) PP 56−6, 513−520.M. S.
[4] Ziyada, B. Borowy and A. Amin, Photovoltaic Module-Site Matching Based on the Capacity Factor, IEEE Transactions on Energy Conversion, 10−2 (1995) 326−332.
[5] R. Lamoureux, D. Sadarnak and N. Buchheit, Estimated Energy Gain Provided by an MPPT to Stand-Alone Photovoltaic System, 2nd World Conference and Exhibition on Photovoltaic Solar Energy Conversion (6-9 July), Vienna, Austria 1998.
[6] E. Van Dyk and E. L. Meyer, Analysis of the Effect of Parasitic Resistances on the Performance of Photovoltaic Modules, Renewable Energy, Vol. 29, No. 3, 2004.
[7] J. J. Carr, 1991, Designer’s Handbook of Instrumentation and
Control Circuits, Academic Press, San Diego, PP 115-198.
[8] J. C. Whitaker, The Electronics Handbook, CRC
Press,1996, PP-78-156.
[9] P. Elgar, Sensors for Measurement and Control, Addison Wesley Longman, Essex, UK, 1998, PP 98-234.
[10]P. Srividyadevi, D.V. Pusphalatha, G. Rangaraju and P.M. Sharma, Measurement of Power and Energy Using Arduino, International Science Congress Association, Received 1st October 2013, revised 17th October 2013, accepted 24th October 2013.
[11]G. Tripathi, S. Mainkar and S. Sunny, DAC Interfacing with 8051 International Journal of Research in Advent Technology, Vol.2, No.2, February 2014 E-ISSN: 2321-9637 124.
[12]F. Shafing and M. Niedra, Extended Change Of Passively Forced Current In Their Active Region, Report Srerdrup Technoloqy PP 14 CSCL U9A N 89- 26 1 50, G3/33 0220031, Sverdrup Technology, Inc. NASA Lek Research Center Group, Cleveland, Ohio
[13]P. Pramod., A High Speed Parallel Counter Architecture and its Implementation in Programmable, Square Finder cum Frequency Divider Circuit, International Journal of Computer Applications (0975 – 8887), Volume 46– No.12, May 2012, 22