© Swiss Society of Economics and Statistics 2015, Vol. 151 (4) 261–298 a Acknowledgments: This article has greatly benefited from the guidance of the Editor, Volker
Grossmann, and the comments and suggestions of two anonymous reviewers of this journal. The research has been supported by the Swiss State Secretariat of Economics (Seco). b ETH Zurich, KOF Swiss Economic Institute, Leonhard strasse 21, CH-8092 Zurich, Phone:
+41 44 632 51 68, email: [email protected]
c ETH Zurich, KOF Swiss Economic Institute, Leonhard strasse 21, CH-8092 Zurich, Phone: +41 44 632 53 29, email: [email protected]
d Corresponding author; ETH Zurich, KOF Swiss Economic Institute, Leonhardstrasse 21, CH-8092 Zurich, Phone: +41 44 632 63 07, email: [email protected]
1 In this paper, the term FDI pertains to all forms of equity-based foreign activities of domes-tic companies, i.e. wholly-owned foreign affiliates, majority/minority stakes in foreign firms; equity-based joint ventures/alliances with foreign partners.
The Characteristics of FDI Activities Located in Different
Host Regions – A Study Based on Firm-Level Data
aSpyros Arvanitisb, Heinz Hollensteinc and Tobias Stuckid
Keywords: Foreign Direct Investment; Global Location Portfolios; Intra-Firm Trade JEL classification: F2
1. Introduction
Foreign direct investments (FDI) have grown at high rates over the last three decades. Correspondingly, the theoretical and empirical literature dealing with a multitude of aspects of FDI strongly expanded (for a detailed overview see, e.g., Dunning and Lundan, 2008). However, there are some topics for which empirical evidence remains relatively scarce, in particular as far as it is based on the analysis of firm data.
In this paper we use firm-level data in order to explain the probability that a firm locates FDI activities in a certain region. We investigate the relationship between the FDI location probability and a series of firm characteristics that according to literature are associated with the FDI propensity. This allows us to identify differences in the characteristics of firms at time of observation, depend-ing on where they have located their FDI activities. More concretely we will con-sider the following three bundles of firm characteristics: (a) the type of FDI (ver-tical, horizontal, distribution-oriented), (b) the relevance of FDI experience, and (c) the importance of the firm’s capacity to innovate.
So far, the choice among alternative FDI locations has primarily been inves-tigated with country data (see, e.g., Blonigen and Wang, 2005; Brainard, 1993; Eaton and Tamura, 1994; Ekholm, 1998; Duanmu, 2012, 2014; Kang and Jiang, 2012; specifically for services: Py and Hatem, 2009) or with sub-national data (see, e.g., Guimaraes et al., 2000; Barrios et al., 2006; Basile et al., 2008). These studies analyze how country/regional characteristics affect FDI flows. Blonigen and Wang (2005), for example, find substantial differences in the factors determining FDI in less developed host countries as compared to those in advanced economies. However, macro-level studies do not take into account the heterogeneity of firms within a country/region. Therefore a more disaggre-gated analysis of the choice of FDI locations is required, which in the optimal case combines information on the parent company, its foreign affiliates and the relationship between them.
The scarce firm-level literature analyzing the structural characteristics of FDI located in different host regions can be divided into two groups. The first group of studies deals with the differences among many host regions with respect to one or very few characteristics. Davidson (1980), for example, investigates the rela-tionship between FDI experience of U.S.-based MNEs and their FDI locations. Shatz and Venables (2000) analyze whether the share of U.S. and Japanese affiliate production that is sold back to the home country differs between host countries. Chen and Moore (2010) analyze whether total factor productivity of French parent firms differs between FDI locations. Demirbag and Glaister (2010) investigate whether FDI experience, project type (research vs. develop-ment) and industry affiliation differ among five target regions characterized by different location characteristics (R&D wages, availability of researchers, etc.). Siedschlag et al. (2013) examined the factors that determine the location choice of R&D activities of European multinational firms in the period 1999–2006.
The Characteristics of FDI Activities Located in Different Host Regions 263
Swiss Journal of Economics and Statistics, 2015, Vol. 151 (4)
2 In 2009, these regions held more than 95 % of the total foreign capital stock of Swiss companies.
3 An earlier version of this paper is found in Arvanitis et al. (2011), chapter 4 and it is part of this study, which was financed by the State Secretariat for Economic Affairs (SECO).
specific characteristics of Japanese parent companies (R&D intensity, prior host country experience, size) and their foreign subsidiaries (size, age, equity owner-ship) differ between FDI in developed countries and those in less advanced econ-omies. Further, Aw and Lee (2008) compare some characteristics of Taiwanese MNEs investing in China with those doing so in the USA. More specifically, they focus on differences with respect to productivity and innovation activity of the parent firms.
We are able to differentiate between host regions in more detail than in the second category of previous studies. Concretely, we are able to distinguish nine host regions (EU15/EFTA, Eastern Europe, Southeast Europe, Russia, North America, Latin America, China, Asian Tigers and Southeast Asia including India)2, which differ, in the first place, in terms of demand-, cost- and
knowl-edge-related location advantages.
At the same time, we can account for the characteristics of FDI activities at firm level in a more differentiated way than it is the case in most previous inves-tigations of the first group.3 We are in a position to do so as we have at our
dis-posal a unique firm-level data set (cross-section for 2010, 1921 firms) contain-ing for a large number of Swiss MNEs information. More specifically, the data includes information to the parent company (first-time FDI activity, firm age, R&D intensity, share of employees with a degree at the tertiary level, firm size, industry affiliation), the foreign subsidiaries (type of business function, objectives of the functional units based on a number of motives of foreign activity), and the two-way transactions between the parent company and its foreign affiliate(s).
4 This is not an exhaustive list of potential region-level drivers of FDI activities (e.g., exchange rate, tax differentials, and trade protection are missing). We have focused on more structural characteristics that do not change much. For example, exchange rates and tax differences that fluctuate stronger than other economic factors such as purchasing power and transportation and communication costs are not taken into consideration in Table 1. However, as we focus in this study on differences at firm-level characteristics, we cannot go into more detail. 5 The available micro-level data used in the econometric analysis allows to distinguish nine
dif-ferent host regions of FDI, i.e. EU15/EFTA, Eastern Europe, Southeast Europe, Russia, North
The estimation results indicate that there is low correlation between a firm’s innovative potential and FDI experience, respectively, and the location of their FDI activities. However, the type of FDI significantly differs between the regions. For example, we find that Asia is a very heterogeneous host region. Some parts (sub regions) are attractive for cheap production activities (indicating vertical FDI in Southeast Asia/India), the more advanced “tiger countries” are important sales markets (indicating horizontal FDI), whereas China receives a mix of vertical and, due to its large and fast-growing market, horizontal FDI.
The remainder of the paper is organized as follows: Section 2 provides a detailed characterization of the regions hosting FDI. In Section 3 we present the conceptual background of the analysis and derive the hypotheses regarding the role of firm characteristics for locating activities in the different regions (Sec-tion 3). In Section 4 we describe the database, and in Section 5 we discuss how we empirically test the hypotheses. The model estimates are presented in Sec-tion 6. Finally, we summarize and draw some conclusions.
2. Region-level Determinants of FDI: Descriptive Analysis
of the Characteristics of FDI Host Regions
To be able to formulate clear hypotheses at the micro level about the charac-teristics of the FDI activities located in different host regions, we first have to characterize the different FDI host regions relative to each other and relative to Switzerland, the home country of the firms, based on a descriptive analysis of five standard determinants of FDI at country or region level as used in gravity models (see, e.g., Nachum et al., 2008): level and growth rate of purchasing power, transportation and communication costs, wage costs, innovative poten-tial, and investment costs (see Table 1 for exact definition of used indicators).4
The Characteristics of FDI Activities Located in Different Host Regions 265
Swiss Journal of Economics and Statistics, 2015, Vol. 151 (4)
America, Latin America, China, Asian Tigers and Southeast Asia/India (EU15/EFTA: Aus-tria, Belgium, Britain, Denmark, Finland, France, Germany, Greece, Iceland, Ireland, Italy, Liechtenstein, Luxembourg, the Netherlands, Norway, Portugal, Spain and Sweden; Eastern Europe: Baltic countries, Czech Republic, Hungary, Poland, Slovakia and Slovenia; Southeast Europe: Albania, Bosnia, Bulgaria, Croatia, Macedonia, Montenegro, Romania and Serbia; Russia: Belarus, Russia, and Ukraine; North America: Canada and the USA; Asian Tigers: Hong Kong, Korea, Singapore and Taiwan; Southeast Asia/India: India, Indonesia, Malaysia, Philippine and Thailand). Due to econometric reasons (see Section 5.2) we grouped them into five “main regions”, provided that they are not too distant from each other and show similar characteristics (selected according to their relevance in the present context). In order to test the robustness of this aggregation econometrically, we will also present estimations for the sub-categories of the aggregated main regions. The main regions “Eastern Europe” is made up of Eastern Europe (in the narrow sense), Southeast Europe and Russia, and “Asia” comprises China, Asian Tigers and Southeast Asia/India.
6 Germany, Britain and France for EU/EFTA; Poland, Russia and the Czech Republic for East-ern Europe; Brazil, Mexico and Venezuela for Latin America; Singapore, China and Indonesia for Asia; and, finally, Canada and USA for North America.
main regions themselves but only for each region’s three most important coun-tries selected according to their share in the Swiss outward FDI capital stock.6
This procedure yields a representative picture of the characteristics of the five main regions as it also shows the heterogeneity in terms of the underlying char-acteristics within the same main region. The values of the relevant indicators for the selected countries representing each main region are shown in Table 1.
The attractiveness of a region as sales market is measured by the level and the growth rate of the purchasing power (level: measured by “GNI per capita, PPP” and “household final consumption per capita”; growth: measured by “5-year GDP per capita” and “household final consumption per capita growth rate”) capturing the present and future demand potential. It is highest in EU15/EFTA and North America and lowest in Asia (with the exception of Singapore whose purchasing power is more or less the same as that of the Western countries). Furthermore, we note that some countries of Eastern Europe and Asia could significantly reduce the gap over the last few years.
The innovative potential of a region is another factor attracting FDI (knowl-edge sourcing). In order to capture the countries’ innovative potential, we use three indicators reflecting a country’s share of the labor force with tertiary level education, a country’s research and development expenditures, and the number of a country’s researchers per million inhabitants, respectively. According to these indicators, the innovative potential is highest in EU15/EFTA and North America.
Moreover, the choice of host regions of FDI is determined by its distance. According to the gravity model of international trade and investment (see, e.g., Brainard, 1997) long distance between two countries reduces the attractiveness of FDI compared to exporting, since the costs of coordination and control of foreign affiliates are higher in case of distant locations. On the other hand high transport and communication costs (measured by the “bilateral distances between capital cities”) are an obstacle to serving these markets by exporting and are thus an incentive for FDI. The net effect of the two opposite forces, which may differ by type of FDI (see below), will be revealed by the empirical analysis. According to Table 1, distances between Switzerland and the most important countries of the region EU15/EFTA are shorter than those to the countries of Eastern Europe. In addition, North America is closer to Switzerland than Latin American and Asian countries.
Investment costs (measured by the “ease of doing business index”, the “corrup-tion percep“corrup-tions index” and the infla“corrup-tion of consumer prices) considerably differ among the selected countries of the five regions. They are much lower in West-ern countries than in all other regions, once again, with the exception of Singa-pore which, in this respect, is quite similar to EU/EFTA and North America. In contrast, investment costs are much higher in Brazil, Indonesia, Russia and Venezuela.
T
h
e C
h
ar
ac
te
ris
tic
s of F
D
I A
ct
iv
iti
es L
o
ca
te
d i
n Di
ffere
n
t H
o
st R
eg
io
n
s
26
7
Sw
iss J
ou
rn
al of E
conom
ic
s a
nd St
at
ist
ic
s, 2
01
5, V
ol
. 1
51 (
4
)
Table 1: Region-Level Determinants of FDI: Characteristics of the Regions
EU15/EFTA Eastern Europe Latin America
Indicator GER GBR FRA POL RUS CZE BRA MEX VEN
Intensity of FDI activities
Share of capital stock of Swiss FDI abroad 6.9 6.3 4.4 0.6 0.7 0.4 4.1 0.7 0.2
Purchasing power
GNI per capita, PPP (current international $) 35950 36240 33280 16710 15460 22890 10080 14340 12850
Household final consumption expenditure per capita (constant 2000 US$)
13926 19400 13761 3801 1877 3811 2904 4762 4096
Growth of purchasing power
5-year GDP per capita growth (% 2003–2008; constant 2000 US$) 9.5 8.5 5.9 30.1 42.8 26.3 19.1 12.2 50.4
Household final consumption expenditure per capita growth (annual %)
0.1 1.4 1.0 5.4 11.4 3.6 7.8 1.3 7.1
Wage costs
Gross hourly pay in a big city (current US$/hour) 23.0 18.0 18.0 5.6 6.9 6.5 5.6 2.1 5.2
Annual gross employment income per worker (current US$) 36444 34854 11378 13020 9801 6143
Innovative potential
Labor force with tertiary education (% of total) 24 32 29 22 53 14 9 17 –
Research and development expenditures (% of GDP) 2.6 1.8 2.1 0.6 1.1 1.6 1.0 0.5 –
A
r
va
n
it
is / Hol
le
n
st
ei
n / S
t
uc
k
i
Sw
iss J
ou
rn
al of E
conom
ic
s a
nd St
at
ist
ic
s, 2
01
5, V
ol
. 1
51 (
4
)
Indicator GER GBR FRA POL RUS CZE BRA MEX VEN
Transportation and communication costs
Bilateral distances between capital cities (CH vs. respective country in kilometers)
504 749 436 1140 2296 623 9534 9640 7973
Investment costs
Ease of doing business index (1=most business-friendly regulations) 27 6 31 72 118 66 127 55 178
Corruption Perceptions Index (1=highest (perceived) corruption) 7.9 7.7 6.9 4.6 2.1 5.2 3.5 3.6 1.9
Inflation of consumer prices (annual %) 2.6 4.0 2.8 4.3 14.1 6.4 5.7 5.1 31.4
Table 1 continued
Asia North America CH
Indicator SGP CHN IND CAN USA CH
Intensity of FDI activities
Share of capital stock of Swiss FDI abroad 1.0 0.8 0.7 4.0 18.5
Purchasing power
GNI per capita, PPP (current international $) 47970 6010 3600 38710 46790 39210
Household final consumption expenditure per capita (constant 2000 US$) 9725 727 622 15503 27378 21950
Growth of purchasing power
5-year GDP per capita growth (% 2003–2008; constant 2000 US$) 18.1 62.5 24.1 7.3 7.3 9.7
T
h
e C
h
ar
ac
te
ris
tic
s of F
D
I A
ct
iv
iti
es L
o
ca
te
d i
n Di
ffere
n
t H
o
st R
eg
io
n
s
26
9
Sw
iss J
ou
rn
al of E
conom
ic
s a
nd St
at
ist
ic
s, 2
01
5, V
ol
. 1
51 (
4
)
Asia North America CH
Indicator SGP CHN IND CAN USA CH
Wage costs
Gross hourly pay in a big city (current US$/hour) 7.1 3.9 1.6 17.1 26.1 30.3
Annual gross employment income per worker (current US$) 23972 4397 42028 35307
Innovative potential
Labor force with tertiary education (% of total) 24 – 7 46 61 30
Research and development expenditures (% of GDP) 2.6 1.5 0.0 2.0 2.7 2.9
Researchers in R&D (per million people) 6088 1071 205 4157 4663 3436
Transportation and communication costs
Bilateral distances between capital cities (CH vs. respective country in kilometers)
10399 8084 11223 6441 6272
Investment costs
Ease of doing business index (1=most business-friendly regulations) 1 86 129 8 4 19
Corruption Perceptions Index (1=highest (perceived) corruption) 9.2 3.6 2.6 8.7 7.3 9.0
Inflation of consumer prices (annual %) 6.5 5.9 10.1 2.4 3.8 2.4
3. Micro-Level Determinants of FDI and Host Region
Characteristics
The characterization of the different host regions now is used in order to for-mulate hypotheses on how the firm-level characteristics may vary for firms with FDI activities in the different host regions. In accordance with the few stud-ies dealing with the characteristics of FDI by host regions (Aw and Lee, 2008; Davidson, 1980; Makino et al., 2004; Shatz and Venables, 2000), we formu-late a model that contains variables for several characteristics of the parent com-pany in Switzerland and the relationship with its foreign affiliates. Overall the characterization of the FDI activities is based on three categories representing (a) the type of FDI (vertical, horizontal, distribution-oriented), (b) the relevance of FDI experience, and (c) the importance of the firm’s capacity to innovate. The results from model estimation (see Section 6) will be interpreted in the light of the hypotheses presented in this section.
Types of FDI
According to the literature, apart from knowledge sourcing, there are two main reasons why a firm may engage in FDI, namely: (a) to better serve a local market and (b) to get access to low-cost inputs in order to improve competitiveness on local and international markets (Shatz and Venables, 2000). Case (a) is called “horizontal FDI”, as firms typically more or less duplicate the same activities in additional plants to supply different locations. In contrast, case (b) referred to as “vertical FDI”, implies that the supply chain is fragmented and some parts of it are relocated abroad in order to minimize costs.
If only firms with foreign production facilities are considered, the distinction between horizontal and vertical FDI suffices to cover the entire range of strate-gies among which MNEs may choose. However, one observes that many MNEs deploy abroad exclusively distribution facilities. Therefore, in the general case, firms have to decide not only between vertical and horizontal production-oriented FDI, but also between “production-oriented” and “distribution-oriented” FDI (for this distinction see Hanson et al., 2001). We thus distinguish the following types of FDI: (a) distribution-oriented FDI, (b) vertical (production-oriented) FDI and (c) horizontal (production-oriented) FDI.
The Characteristics of FDI Activities Located in Different Host Regions 271
Swiss Journal of Economics and Statistics, 2015, Vol. 151 (4)
7 Cultural distance between domestic and foreign locations may have a similar effect: cost sav-ings in case of production-oriented FDI are higher than those that can be realized by distri-bution-oriented FDI.
8 The distance-related cost savings in case of production-oriented FDI relative to those of dis-tribution-oriented FDI are particularly high for FDI in knowledge-intensive industries (see Keller and Yeaple, 2009), whose share in Swiss exports and FDI is very high.
question whether the advantage of low labor costs outweighs the disadvantage of high investment costs. We expect that, on balance, production cost advantages dominate in case of the three aforementioned regions. Accordingly, we expect them to attract primarily vertical FDI.
Horizontal FDI are associated with higher fixed costs and might thus be most common in host countries with large markets. The same is true for distribution-oriented FDI. However, the incentive for a firm to engage in distribution-ori-ented rather than horizontal FDI is lower if trade barriers of the host country are high. Transportation costs are another relevant factor (see, e.g., Hattari and Rajan, 2009 or Mody et al., 2003). As they can be reduced by horizontal FDI, the distance between host and home country is expected to be positively cor-related with the cost savings resulting from horizontal FDI compared with the distance-related cost savings in case of distribution-oriented FDI (see Hanson et al., 2001 for a similar reasoning).7 EU15/EFTA and North America are the largest (potential) markets and thus particularly attractive for horizontal FDI. However, given the lower trade barriers and shorter distance in case of EU15/ EFTA, the likelihood of Swiss firms to be engaged in distribution-oriented FDI is expected to be higher in EU15/EFTA than in North America.8 The above dis-cussion on the three types of FDI implies:
H1: North America, in the first place, attracts horizontal FDI, whereas in case of EU15/EFTA distribution-oriented FDI is predominant. Vertical FDI are hosted primarily by Eastern Europe, Latin America and Asia.
FDI Experience
are not similar to the home country (see, e.g., Johanson and Vahlne, 1977; Johanson and Wiedersheim-Paul, 1975). Empirical evidence for the crucial role of foreign experience is found, for example, in Davidson (1980), and more recently in Gazaniol (2014). We thus formulate the following hypotheses:
H2a: The likelihood that a firm currently has FDI activities in a certain region is particularly high if it has long-standing FDI experience.
H2b: Early FDI experience increases the probability that a firm invests in regions whose characteristics are dissimilar to those of Switzerland (primarily East-ern Europe, Latin America, and Asia). Accordingly, the effect of FDI expe-rience on the likelihood of FDI is larger for such dissimilar regions, if we compare the experience effects across regions.
Capabilities for Innovation
In addition to demand- and cost-related factors, knowledge acquisition is a fur-ther important factor that drives FDI. Innovativeness is an important firm-spe-cific characteristic that determines, among other things, the firms’ propensity to invest in foreign locations (“ownership advantage”; see, e.g., Dunning, 2000). In addition, innovative firms especially from small countries are likely to seek abroad for additional or complementary know-how (see, among many others, Le Bas and Sierra, 2002), since its domestic knowledge base is mostly limited and/or highly specialized. Hence, we expect that the most advanced countries with high potential for innovation would be particularly attractive locations for “knowledge-seeking FDI” (see Blonigen, 2005; Kogut and Chang, 1991).
As a consequence, we postulate the following hypothesis:
H3a: The likelihood that a firm currently has FDI activities in a certain region is larger for firms with innovation activities at home than for those with-out such activities.
The low production costs of less developed countries primarily attract less innova-tive firms. Knowledge seeking in combination with innovation-based O-advan-tages should thus lead to a higher share of innovative firms with FDI activities in developed than in less developed host regions. The respective hypothesis is as follows:
The Characteristics of FDI Activities Located in Different Host Regions 273
Swiss Journal of Economics and Statistics, 2015, Vol. 151 (4)
4. Data
The firm data used in this investigation have been collected in the course of a postal survey on the “Internationalization of the Swiss Economy” carried out in spring 2010. The questionnaire has been addressed to a sample of about 4500 firms (with at least five employees) covering the business sector (i.e. including services) of the Swiss economy and is stratified by 29 industries and three indus-try-specific firm size classes (with full coverage of large companies). The survey yielded valid information for 1921 enterprises, implying a response rate of 42 %, what is satisfactory given the very demanding questionnaire. Due to selective reminding calls among firms that were underrepresented in a first round of data collection, the final structure of the responding firms in terms of size and industry affiliation is quite similar to that of the underlying sample. 545 firms are engaged in FDI (about 28 % of all valid responses). A non-response analysis indicated that this share is representative for the whole sample. Depending on the number of missing values of the explanatory variables that differs consider-ably across the estimated models (see below) 334 to 473 observations could be used to analyze econometrically the characteristics of the FDI firms.
On average the MNEs in our sample (i.e., the firms with FDI activities) have 814 employees, whereupon the distribution is strongly right-skewed. 51 % of the firms have between 50 and 250 employees and only 22 % employ more than 250 employees.
72 % of the firms belong to the manufacturing sector, 26 % to the service sector and only 2 % to the construction sector. In the service sector the sub-sector of modern (knowledge-intensive) services (e.g., banking and insurance, business services) has a larger share than the sub-sector of traditional services (e.g., trade, hotels and catering) (53 % vs. 47 %). In the manufacturing sector there are more high-tech than low-tech firms (66 % vs. 34 %).
9 The questionnaire is available in German, French and Italian on www.kof.ethz.ch/en/surveys/ structural-surveys/other-surveys/survey-internationalisation-swiss-economy-2010/.
10 In the longer run, the relocation of certain parts of the supply chain abroad may also improve the competitiveness of a firm, leading to an increase of jobs in Switzerland (indirect effect) (see Grossman and Rossi-Hansberg, 2008 for this argument). However, we presume that, on balance, the negative employment effect weighs more.
ventures) in countries other than Switzerland belong to the firms with “vertical FDI”. Finally, firms reporting only distribution activities abroad build the group of forms with “distribution-oriented” FDI. In addition, we collected informa-tion about innovative activities and some basic characteristics of the firm (e.g., sales, value added, employment, firm age, industry affiliation).9 For descriptive
information on the model variables based on the respective estimation samples see Table A.1 in the appendix. The correlation matrix is presented in Table A.2.
5. Empirical Test of Hypotheses
5.1 Operationalization of Hypotheses
As made clear in the beginning, the goal of this study is to analyze how the char-acteristics of firms differ at time of observation, depending on where they have located their FDI activities at this point in time. Hence, we are not interested in identifying determinants of starting FDI activities in a certain region, but simply compare the characteristics of firms that have FDI activities in a certain region with firms that have FDI activities in other regions.
Hypothesis 1 focuses on the differentiation between vertical (production-ori-ented) FDI, horizontal (production-ori(production-ori-ented) FDI and distribution-oriented FDI (see also Section 4). Hypothesis 1 is tested using three different types of indi-cators. A first variable measures the change of the parent firms’ employment in Switzerland in the upswing period 2003–2008. Since vertical FDI involves the relocation of parts of the supply chain, this type of FDI implies as a direct effect a reduction of the domestic employment of the parent company.10 Therefore, in
The Characteristics of FDI Activities Located in Different Host Regions 275
Swiss Journal of Economics and Statistics, 2015, Vol. 151 (4)
A second measure we use to represent the three types of FDI is based on the intensity of the two-way trade flows of goods/services between the parent com-pany and its foreign subsidiaries (intra-firm trade flows). As distribution-ori-ented FDI are associated with large outflows of products to the foreign sales market, we expect considerable net outflows to regions where this type of FDI is predominant. On the other hand, we should observe net inflows from regions that primarily are destinations of vertical FDI (intra-firm deliveries of primary and intermediate products to the parent company). In case of horizontal FDI, we expect neither substantial outflows nor inflows since production takes place locally. Accordingly, trade inflows from regions hosting horizontal FDI should be smaller than outflows to countries having received vertical FDI. Finally, we expect that outflows to host regions of horizontal FDI are smaller than outflows to locations having attracted predominantly distribution-oriented FDI.
The third measure focuses on production-oriented FDI. Based on the sub-sam-ple of firms engaged in this type of FDI, we analyze the probability of a firm locating its production facilities in a certain region. Data on the firms’ motives for establishing (or extending) production sites in foreign locations allow us to distinguish between “cost-related” and “market-related” motives. Examples of the latter are “market expansion”, “early market presence to gain a competitive advantage” or “following customers by establishing production facilities abroad”. Cost-oriented motives are, for example, “lower labor costs”, “more flexible labor market regulations”, “tax advantages” or “less strict environmental laws” in host regions as compared with Switzerland. We expect that horizontal FDI are driven by market-related motives, whereas cost-oriented motives dominate in regions hosting vertical FDI.
Hypothesis 2 emphasizes the impact of FDI experience. Our dataset contains information on the period of the first-time FDI activity and the age of firms. First-time presence is used as a direct measure of FDI experience, whereas firm age indirectly captures FDI experience as it is expected to correlate positively with industry and export experience.
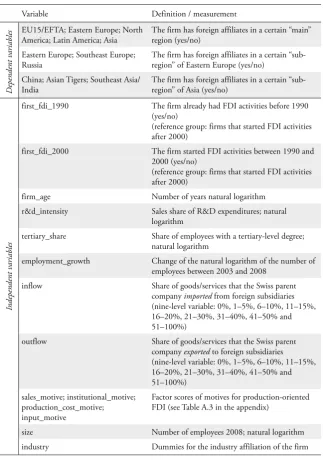
Table 2: Variable Definition and Measurement
Variable Definition / measurement
D
ependent v
ariables
EU15/EFTA; Eastern Europe; North America; Latin America; Asia
The firm has foreign affiliates in a certain “main” region (yes/no)
Eastern Europe; Southeast Europe; Russia
The firm has foreign affiliates in a certain “sub-region” of Eastern Europe (yes/no)
China; Asian Tigers; Southeast Asia/ India
The firm has foreign affiliates in a certain “sub-region” of Asia (yes/no)
Independent v
ariables
first_fdi_1990 The firm already had FDI activities before 1990 (yes/no)
(reference group: firms that started FDI activities after 2000)
first_fdi_2000 The firm started FDI activities between 1990 and 2000 (yes/no)
(reference group: firms that started FDI activities after 2000)
firm_age Number of years natural logarithm r&d_intensity Sales share of R&D expenditures; natural
logarithm
tertiary_share Share of employees with a tertiary-level degree; natural logarithm
employment_growth Change of the natural logarithm of the number of employees between 2003 and 2008
inflow Share of goods/services that the Swiss parent company imported from foreign subsidiaries (nine-level variable: 0%, 1–5%, 6–10%, 11–15%, 16–20%, 21–30%, 31–40%, 41–50% and 51–100%)
outflow Share of goods/services that the Swiss parent company exported to foreign subsidiaries
(nine-level variable: 0%, 1–5%, 6–10%, 11–15%, 16–20%, 21–30%, 31–40%, 41–50% and 51–100%)
sales_motive; institutional_motive; production_cost_motive; input_motive
Factor scores of motives for production-oriented FDI (see Table A.3 in the appendix)
The Characteristics of FDI Activities Located in Different Host Regions 277
Swiss Journal of Economics and Statistics, 2015, Vol. 151 (4)
11 The selection equation of the Heckman model is specified in the same way as the outcome equation, with the exception of the additional identifying variable that is not in the outcome equation. To identify the Heckman model, instrument variables are added to the selection equations. The instruments are industry averages of variables that measure the firms’ demand development (average of two 5-level ordinal variables that measure the firm’s expected and past demand development, respectively; in the estimates explaining FDI activities in the USA only information on the firms’ expected demand development is used). In order to construct the industry averages we can use the whole data set and are not restricted to firms with FDI activities. Hence the averages are constructed on the NACE 3-digit level, which allows us to additionally include the industry controls (aggregated 2-digit level) in our estimates. We assume that these industry variables pick-up the effect of unobserved industry-specific attrib-utes that contribute to the potential endogenous firm-specific variables (see, e.g., Cassiman
5.2 Econometric Framework
The dependent variable is a dummy variable that takes the value one for MNEs with subsidiaries in a certain region and value zero otherwise (for a detailed def-inition of all variables see Table 2; the descriptive statistics are shown in Table A.1 in the appendix). Due to the fact that many parent companies invest at the same time in several host regions, it is likely that the decisions on FDI locations are correlated. This was confirmed by LR-tests of the multivariate probit against independent univariate probits for all models we estimated. The residuals of the dependent variables of the different models were thus not independent of each other. To take account of such interdependencies we estimated a multivariate probit model for all nine host regions. As the model did not converge when we included all nine FDI host regions at ones, we chose a two-step approach. In a first step, we estimated a multivariate probit model for the five “main regions” as defined in Section 2.1 (EU/EFTA, North America, Latin America, Eastern Europe, and Asia). In a second step, we captured, where necessary, differences between sub-regions by estimating a multivariate probit model separately for the three sub-regions of the main regions “Eastern Europe” (“Eastern Europe” in the narrow sense, “Southeast Europe” and “Russia”) and “Asia” (“China”, “Asian Tigers” and “Southeast Asia/India”).
and Veugelers, 2002, p. 1174 for a similar justification of the use of industry variables as instruments). Accordingly, it can be assumed that these instruments are uncorrelated with the error term. Furthermore, all instruments are correlated with the dependent variable in the selec-tion equaselec-tion (FDI yes/no) but uncorrelated with the dependent variable in the outcome equa-tion (locaequa-tion choice). As informaequa-tion on specific FDI characteristics of the firms (e.g., on FDI experience or trade flows) is only available for firms with FDI activities, we could not include these variables in our selection model. The detailed estimation results are available on request. 12 The correlation between employment growth and the flow variables for intra-firm trade is about
0.15, between employment growth and the motive variables about 0.12. Thus, there is no issue of multicollinearity if both variables are used in the same model. However, the flow variables and the motive variables (particularly the inflow variable and the production cost motive able) are strongly correlated. To avoid this multicollinearity problem, the two groups of vari-ables are thus estimated in separate models.
for each region, there is no evidence for a selection bias, and we conclude that focusing on firms with FDI activities is an adequate procedure.
The analysis, as most studies in this field of research, is based on cross-sectional data (see Section 3). Therefore, the potential problem of endogeneity cannot be solved. As a consequence, one should be cautious in interpreting the results as causal relationships. Hence we refrain from making causal claims, but rather interpret the estimated coefficients as partial correlations. Furthermore, we focus on interpreting the relative size of the correlations across the different regions and refrain from interpreting the size of the single parameters. Hence, we also do not present the marginal effects of the estimates. Nevertheless the results show whether and to what extent the results are in line with the hypotheses postu-lated in Section 2.3.
5.3 Specification of Three Empirical Models
The Characteristics of FDI Activities Located in Different Host Regions 279
Swiss Journal of Economics and Statistics, 2015, Vol. 151 (4)
Model I includes two explanatory variables describing the parent firm’s FDI experience (first_fdi; firm_age), two types of innovation input (r&d_intensity, tertiary_share) and the change of domestic employment of the parent firm in the upswing period 2003–2008 (employment_growth). Furthermore, we control for firm size (size) and industry affiliation (industry). A formal expression of Model I for firm i is as follows:
FDI,ib0b1 first_fdii_1990b2 first_fdii_2000b3 firm_agei
b4 r&D_intensityib5 tertiary_sharei
b6 employment_growthib7 sizeiindustry_controlsei. (1)
In Model II, we investigated the effect of the intensity of the two-way trade flows between the parent company and its foreign subsidiaries on the selection of FDI host regions. To this end we used the variable inflow measuring the intensity of flows of goods/services from foreign subsidiaries to the parent company in Swit-zerland, whereas outflow represents the intensity of flows in the opposite direc-tion. Apart from that we inserted the variables contained in Model I. In formal terms is Model II as follows:
FDI,ib0b1 first_fdii_1990b2 first_fdii_2000b3 firm_agei
b4r&D_intensityib5tertiary_sharei
b6employment_growthib7sizeib8inflow b9 outflow
industry_controlsei. (2)
13 Average employment of the company group with FDI in the EU15/EFTA is 2948, in Eastern Europe 4274, in North America 4865, in Asia 4135 and in Latin America 7039.
FDI,i b0b1 first_fdii_1990b2 first_fdii_2000
b3 firm_ageib4r&D_intensityib5tertiary_sharei
b6employment_growthib7sizeib8sales_motive
b9institutional_motiveb10production_cost_motive
b11input_motiveindustry_controlsei. (3)
6. Estimation Results
6.1 Model I: Basic Model
Results for Model I are presented in Table 3. Columns (1) to (5) show the results for the five main regions. Columns (6) to (8) and (9) to (10), respectively, contain, based on the same model, the findings for the sub-regions of the two aggregated regions. In case of Model I, the estimation results for the sub-regions of Eastern Europe as well as those for Asia are more or less the same as for the correspond-ing aggregated regions. Therefore, in analyzcorrespond-ing the results of Model I, we focus on differences among the five main regions. As we simultaneously estimate the model for the five regions, Wald tests allow us to directly compare the coeffi-cients across the different regions.
6.1.1 Vertical versus Horizontal FDI
The Characteristics of FDI Activities Located in Different Host Regions 281
Swiss Journal of Economics and Statistics, 2015, Vol. 151 (4)
6.1.2 FDI Experience
In line with hypothesis H2a, the probability that a firm has FDI activities in a certain region is significantly higher (based on Wald tests) for firms that already had FDI activities before 1990 (first_fdi_1990) than for companies that have invested abroad only after 2000 (within region comparisons). Furthermore, this effect increases with the extent of FDI experience as, for each region, the coeffi-cient of first_fdi_1990 is significantly larger than that of first_fdi_2000.
In contrast, the findings referring to the differences across regions, taken as a whole are not consistent with hypothesis H2b. The coefficients of first_fdi_1990 and first_fdi_2000 estimated for EU15/EFTA, North America and Asia are sig-nificantly larger than those we found for Eastern Europe and Latin America (confirmed by Wald tests on the equality of coefficients across region-specific equations). Contrary to our hypothesis, less experienced firms have a higher prob-ability to invest in the more dissimilar regions Eastern Europe and Latin Amer-ica than in the more similar regions EU15/EFTA and North AmerAmer-ica. Accord-ingly, FDI experience seems to affect primarily the extent of coverage of FDI host regions (number of regions where a firm is present) rather than the choice of a specific FDI location itself.
The coefficients of firm age (firm_age), our second measure of FDI experience, are insignificant for all target regions. Industry and export experience that are associated with this variable do not seem to affect the choice of locations of FDI.
6.1.3 Capabilities for Innovation
In most regions, highly innovative parent firms (measured by r&d_intensity and tertiary_share) are more likely to invest than non-innovative firms, what is in line with hypothesis H3a. In less developed regions this is the case because of O-advantages of the parent firms; in North America, among other things, because of its attractiveness for knowledge-seeking FDI. In contrast to H3a, inno-vative parent firms do not invest more often in EU15/EFTA than other firms.
Hypothesis H3b is only partly confirmed by the estimates. As expected, the coefficients of the two innovation input variables (r&d_intensity, tertiary_share) are larger for North America than those for the less developed region Eastern Europe. However, contrary to our expectations, this is not the case for the regions Latin America and Asia and, again in contrast to H3b, the innovation potential of firms has a significantly smaller impact on the likelihood of FDI in EU15/ EFTA. Overall, the evidence for H3b is quite weak.
A
r
va
n
it
is / Hol
le
n
st
ei
n / S
t uc k i Sw iss J ou rn
al of E
conom ic s a nd St at ist ic s, 2 01 5, V ol . 1 51 ( 4 )
All regions Eastern Europe Asia
EU15/ EFTA Eastern Europe North America Latin America Asia Eastern Europe SE
Europe Russia China
Asian Tigers SE Asia/ India _cons 0.219 (0.669) –0.775 (0.497) –2.962*** (0.629) –2.695*** (0.636) –2.727*** (0.588) –0.995** (0.493) –1.053** (0.529) –2.717*** (0.620) –3.145*** (0.620) –2.600*** (0.617) –2.076*** (0.596) first_fdi_1990 1.066*** (0.226) 0.681*** (0.184) 1.174*** (0.231) 0.458** (0.211) 0.914*** (0.193) 0.649*** (0.187) 0.664*** (0.208) 0.961*** (0.242) 0.860*** (0.221) 1.049*** (0.238) 0.781*** (0.215) first_fdi_2000 0.569** (0.236) 0.153 (0.203) 0.907*** (0.251) 0.011 (0.242) 0.601*** (0.212) 0.233 (0.211) 0.110 (0.238) 0.293 (0.272) 0.713*** (0.242) 0.628** (0.259) 0.279 (0.241) firm_age –0.024 (0.117) –0.047 (0.087) –0.007 (0.094) –0.109 (0.095) –0.036 (0.089) –0.077 (0.087) –0.120 (0.090) –0.049 (0.095) –0.009 (0.092) –0.042 (0.091) –0.153* (0.093) r&d_intensity –0.018 (0.036) 0.089*** (0.028) 0.113*** (0.029) 0.060* (0.031) 0.047* (0.027) 0.078*** (0.028) 0.093*** (0.030) 0.069** (0.032) 0.048* (0.029) 0.054* (0.029) 0.046 (0.029) tertiary_share –0.007 (0.102) –0.108 (0.072) 0.220** (0.100) 0.332*** (0.103) 0.349*** (0.096) –0.068 (0.071) –0.059 (0.079) 0.121 (0.100) 0.259** (0.102) 0.225** (0.100) 0.164* (0.096) employment_growth 0.443** (0.213) –0.202 (0.172) 0.160 (0.181) 0.176 (0.182) –0.214 (0.177) –0.128 (0.178) –0.236 (0.184) –0.085 (0.192) –0.014 (0.177) –0.184 (0.171) –0.018 (0.170) size 0.130* (0.069) 0.172*** (0.045) 0.217*** (0.048) 0.203*** (0.050) 0.193*** (0.046) 0.179*** (0.046) 0.150*** (0.048) 0.234*** (0.050) 0.208*** (0.047) 0.137*** (0.047) 0.216*** (0.047)
industry yes yes yes yes yes yes yes yes yes yes yes
N 473 473 473
Wald chi2 256.16*** 103.05*** 137.86***
LR test of the multivariate probit
against independent univariate probits 281.58*** 255.14*** 270.59***
The Characteristics of FDI Activities Located in Different Host Regions 283
Swiss Journal of Economics and Statistics, 2015, Vol. 151 (4)
firms, differentiating by host regions of FDI. The results are presented in Table 4. The data shown in the first row of the table reveal that the share of R&D per-forming parent firms varies across FDI host regions more or less in the same way as the coefficients found for r&d_intensity in the model estimates (for example, North America high share and statistically significant coefficient, EU15/EFTA low share and insignificant coefficient). In case of EU15/EFTA, not less than 30 % of firms without own R&D are present with FDI in this region. This is probably due to its relative attractiveness for distribution-oriented FDI (see the estimates for Model II in subsection 6.2) as well as for reasons not explicitly accounted for in the model (e.g. historical ties, geographic and cultural proxim-ity, etc.). These effects seem to be much stronger than that of the high innova-tion potential of locainnova-tions in EU15/EFTA.
The second row shows, in line with H3b, that foreign affiliates in EU15/EFTA and North America have much more often local R&D activities than those pre-sent in Latin America and Eastern Europe.
China is the only country that does not fit the pattern observed for the less advanced regions as described in H3b. There are probably two explanations for this result. Firstly, most FDI in Chinese R&D centers are concentrated in Bei-jing and Shanghai that have a well-developed infrastructure, highly qualified human resources and some top-class universities (see Gassmann and Han, 2004). Hence the innovation environment of China as a whole is not repre-sentative for the economic core regions of this country (what to some extent is also true for India). Besides, the quite impressive R&D activity of local affili-ates may also reflect the policy of Chinese authorities pushing foreign firms to transfer their technology.
Accordingly, it seems that the unexpected results with respect to H3b are pri-marily driven by the low correlation between the firms’ propensity to perform R&D at home and to invest abroad in such activities (row 3 of Table 4). The respective correlation coefficient is lower than 0.2 for all regions, with the excep-tion of EU15/EFTA (0.36).
of FDI in Latin America and Eastern Europe (most accentuated in Southeast Europe and Russia) R&D activities remain primarily located in Switzerland.
Table 4: Descriptive Analysis of R&D Activities
All regions Eastern Europe Asia
EU15/ EFT
A
Eastern Eur
ope
N
or
th
America Latin America Asia Eastern Eur
ope
Southeast Eur
ope
R
ussia
China Asian Tigers Southeast Asia/I
ndia
Percentage share of firms with R&D activities in Switzerland by FDI location
70 80 87 83 80 80 81 86 82 81 81
Percentage share of firms with R&D activities in a certain region by FDI location
29 9 22 4 14 8 3 3 12 8 7
Correlation of R&D propensity at
home and abroad 0.36 0.16 0.17 –0.02 0.14 0.15 0.08 0.07 0.08 0.08 0.13
Number of observations 422 238 204 119 244 212 135 126 181 158 158
Source: Survey on the “Internationalization of the Swiss Economy” (see Section 4).
6.2 Model II: Intra-firm Trade Flows
Table 5 shows the results for Model II that extends Model I by including the trade flow variables (inflow, outflow) that reveal the role of different types of FDI in more detail. The intensity of trade flows from the foreign affiliates to their parent company in Switzerland (inflow) is significantly larger for firms with FDI in Eastern Europe or Asia (to a lesser extent also in Latin America) than for companies that invested in EU15/EFTA or North America. If we take account only of statistically significant differences of the coefficients of inflow, we get the following pattern:
(Eastern Europe Asia) Latin America (EU15/EFTA North America).
The Characteristics of FDI Activities Located in Different Host Regions 285
Swiss Journal of Economics and Statistics, 2015, Vol. 151 (4)
14 FDI activities in Latin America do not affect employment growth of the parent company in Switzerland.
EU15/EFTA (Eastern Europe North America) (Latin America Asia).
Thus, in accordance with hypothesis H1, we can observe that the firms in our sample with FDI activities in the region EU15/EFTA on average have small inflows and large outflows, which is evidence for distribution-oriented FDI. Trade inflows from North America are also small, but trade outflows are clearly not as large as those to EU15/EFTA. We may thus conclude that horizontal FDI is, as expected, more common in North America than in EU15/EFTA. Hypoth-esis H1 receives further support by the fact that FDI in Asia is of the vertical type, characterized by large trade inflows and small trade outflows. FDI in Eastern Europe and Latin America also seem to be of the vertical type (larger coefficient for trade inflows than outflows). However, this conclusion has to be qualified. Rather unexpected, trade outflows are relatively large in case of Eastern Europe. It seems that Eastern Europe, as a result of the strong economic growth achieved in recent years and in view of the short distance to Switzerland, has been discov-ered by Swiss firms not only as a favorable location for manufacturing (“vertical FDI”) but to some extent also as a promising market for their products (“distri-bution FDI”). The second qualification refers to Latin America as we observe that trade flows in both directions are smaller than those of Eastern Europe and – less accentuated – those of Asia. Thus, subsidiaries in Latin America seem to be less dependent from their parent companies than foreign affiliates in other regions with vertical FDI; this result is in line with what we found for the vari-able employment_growth.14
A
r
va
n
it
is / Hol
le
n
st
ei
n / S
t uc k i Sw iss J ou rn
al of E
conom ic s a nd St at ist ic s, 2 01 5, V ol . 1 51 ( 4 )
All regions Eastern Europe Asia EU15/ EFTA Eastern Europe North America Latin America Asia Eastern Europe SE Europe
Russia China Asian Tigers SE Asia/ India _cons –0.946 (1.024) –0.642 (0.744) –3.001*** (0.778) –2.969*** (0.820) –2.962*** (0.763) –1.396* (0.718) –0.201 (0.738) –3.010*** (0.819) –4.137*** (0.825) –2.616*** (0.795) –2.069*** (0.764) first_fdi_1990 1.006*** (0.284) 0.568** (0.225) 1.138*** (0.272) 0.517** (0.258) 1.153*** (0.240) 0.572** (0.228) 0.486** (0.247) 0.827*** (0.294) 1.184*** (0.281) 1.110*** (0.294) 0.962*** (0.272) first_fdi_2000 0.491* (0.291) 0.009 (0.248) 0.959*** (0.293) –0.059 (0.290) 0.747*** (0.260) 0.204 (0.253) –0.027 (0.279) 0.239 (0.328) 0.980*** (0.303) 0.649** (0.318) 0.493* (0.297) firm_age –0.025 (0.152) –0.086 (0.116) –0.104 (0.117) –0.064 (0.122) –0.064 (0.113) –0.070 (0.110) –0.166 (0.114) –0.038 (0.120) 0.034 (0.118) –0.082 (0.118) –0.200* (0.117) r&d_intensity –0.031 (0.046) 0.035 (0.036) 0.099*** (0.037) 0.058 (0.039) –0.003 (0.035) 0.028 (0.036) 0.075** (0.038) 0.021 (0.040) –0.008 (0.037) 0.007 (0.037) 0.032 (0.036) tertiary_share –0.030 (0.173) –0.252** (0.123) 0.114 (0.126) 0.336** (0.133) 0.335*** (0.123) –0.129 (0.118) –0.207* (0.123) 0.060 (0.132) 0.335*** (0.128) 0.086 (0.127) 0.145 (0.122) employment_growth 0.839*** (0.319) –0.059 (0.223) 0.332 (0.245) 0.468* (0.251) 0.006 (0.230) –0.004 (0.232) –0.148 (0.236) 0.025 (0.246) 0.145 (0.234) 0.090 (0.230) 0.008 (0.226) size 0.265*** (0.096) 0.147** (0.060) 0.253*** (0.063) 0.158** (0.065) 0.177*** (0.061) 0.166*** (0.060) 0.058 (0.062) 0.218*** (0.064) 0.184*** (0.062) 0.137** (0.063) 0.188*** (0.061) inflow –0.061 (0.051) 0.125*** (0.036) 0.015 (0.036) 0.060* (0.036) 0.084** (0.036) 0.101*** (0.034) 0.056* (0.034) 0.080** (0.036) 0.080** (0.037) 0.034 (0.035) 0.079** (0.034) outflow 0.185*** (0.057) 0.087*** (0.029) 0.076** (0.030) 0.011 (0.030) 0.003 (0.029) 0.085*** (0.028) 0.072*** (0.028) 0.072** (0.029) 0.044 (0.029) 0.073** (0.029) 0.002 (0.029)
industry yes yes yes yes yes yes yes yes yes yes yes
N 334 334 334
Wald chi2
235.03*** 102.24*** 124.48***
LR test of the multivariate probit against independent univariate probits
198.08*** 156.10*** 179.24***
The Characteristics of FDI Activities Located in Different Host Regions 287
Swiss Journal of Economics and Statistics, 2015, Vol. 151 (4)
6.3 Model III: Motives for Production-oriented FDI
Model III analyzes production-oriented FDI in more detail, in order to get some more insight into the variation across host regions by type of FDI (Table 6). In doing so, we focus on the distinction between regions with vertical FDI and regions with horizontal FDI. In line with hypothesis H1, cost motives (produc-tion_cost_motive) are of low relevance for production-oriented FDI in the EU15/ EFTA region and in North America. Production in North America is primarily driven by sales-oriented motives (sales_motive) and, rather surprisingly, the local institutional conditions. However, the latter result becomes plausible when we look more closely to the single motives covered by the (aggregate) variable insti-tutional_motive. The significant effect of this measure is exclusively due to the richer endowment with highly qualified employees in North America as com-pared with Switzerland.
Hypothesis H1 is further confirmed by the fact that cost motives are primarily relevant for production in Eastern Europe and Asia, which is additional evidence for vertical FDI in these regions. However, the results also show that a clear dis-tinction between horizontal and vertical FDI is not possible for these regions, as production is also motivated by local sales. While the local market in Asia is pri-marily served by local production (Model II: small trade outflows), the market in Eastern Europe is served by local production as well as distribution of prod-ucts exported from Switzerland (Model II: intermediate size of trade outflows). This is intuitively plausible as the average purchasing power is much lower in Asia. Hence, production costs are more important in case of Asia than of Eastern Europe; consequently, the sales of products primarily stem from local production. The large distance to Asia is another factor favoring sales out of local production.
In case of Asia, we get a clearer picture by analyzing the motives at a more dis-aggregated level. Similar to Model II, we find evidence for vertical FDI in case of Southeast Asia/India (production_cost_motive is dominant). Production in the tiger countries is primarily of the horizontal type (sales_motive is dominant). For China, we observe a mix of horizontal and vertical FDI. In view of the large size and the high growth (potential) of the Chinese market it is not surprising that market-oriented motives are highly important as well.
A
r
va
n
it
is / Hol
le
n
st
ei
n / S
t uc k i Sw iss J ou rn
al of E
conom ic s a nd St at ist ic s, 2 01 5, V ol . 1 51 ( 4 )
All regions Eastern Europe Asia
EU15/ EFTA Eastern Europe North America Latin America Asia Eastern Europe Southeast Europe
T h e C h ar ac te ris tic
s of F
D I A ct iv iti es L o ca te d i n Di ffere n t H o st R eg io n s 28 9 Sw iss J ou rn
al of E
conom ic s a nd St at ist ic s, 2 01 5, V ol . 1 51 ( 4 )
All regions Eastern Europe Asia
EU15/ EFTA Eastern Europe North America Latin America Asia Eastern Europe Southeast Europe
Russia China Asian Tigers SE Asia/ India input_motive –0.038 (0.079) –0.008 (0.072) 0.094 (0.078) 0.010 (0.086) –0.050 (0.069) 0.040 (0.074) 0.036 (0.086) –0.035 (0.114) 0.066 (0.075) –0.026 (0.081) –0.009 (0.078)
industry yes yes yes yes yes yes yes yes yes yes yes
N 371 371 371
Wald chi2 210.01*** 86.43*** 104.25***
LR test of the multivariate probit against independent univariate probits
117.50*** 74.85*** 92.32***
7. Conclusions
In this paper we aim at characterizing Swiss FDI located in different regions by drawing, at the same time, on firm-specific variables and region-specific char-acteristics. MNEs can decide to locate FDI in one or more of nine host regions which, in the first place, differ in terms of market-related, cost-related and knowl-edge related advantages. Three bundles of firm-level variables representing (a) the type of FDI (vertical, horizontal, distribution-oriented), (b) the relevance of FDI experience, and (c) the importance of the firm’s capacity to innovate (R&D intensity, human capital) were employed to characterize the FDI activities in dif-ferent locations. The paper draws on cross-section data stemming from a survey conducted in the year 2010. As firms may be present in several countries, model estimations are based on the multivariate probit procedure.
Overall, the models used to determine the relationship between the type of FDI and the choice of the host region yielded the expected results. In case of the economically less advanced target regions the results indicate that it is necessary to distinguish between sub-regions; in doing so we get results that are largely in accordance with our expectations. More specifically, we find, firstly, that North America and EU15/EFTA are more likely than other regions to host horizontal FDI, and, secondly, that EU15/EFTA is more attractive than North America for distribution-oriented FDI. Thirdly, in case of less advanced host regions, we find that Eastern Europe primarily receives vertical FDI, but the results also point to some relevance of distribution-oriented FDI; Eastern Europe is thus not only a location for (cheap) production, but FDI in this region are, to some extent, also a means to exploit the potential of this (strongly) growing market. Fourthly, Asia as a whole seems to attract primarily vertical FDI. However a disaggregation of this large area into three sub-regions leads to a more differentiated picture. Horizontal FDI are more common in case of the already highly advanced “tiger countries”, whereas Southeast Asia/India as a poorer region mostly receives ver-tical FDI, and for China, interestingly, we find a mix of verver-tical and horizon-tal FDI. It thus turns out that the fast-growing Chinese economy is not only a cheap location for manufacturing but also a significant host country of market-oriented FDI. In case of Latin America the results do not convey a clear picture. FDI experience, the second group of explanatory variables, primarily affects the level of the global expansion of Swiss MNEs rather than the selection of spe-cific locations.
The Characteristics of FDI Activities Located in Different Host Regions 291
Swiss Journal of Economics and Statistics, 2015, Vol. 151 (4)
EU15/EFTA region, probably reflecting the proximity of Switzerland and his-torical ties. However, the innovation potential of a host region, unexpectedly, is not a decisive factor for attracting FDI of innovative parent companies, expect in case of North America with its particularly large knowledge base.
A
r
va
n
it
is / Hol
le
n
st
ei
n / S
t
uc
k
i
Sw
iss J
ou
rn
al of E
conom
ic
s a
nd St
at
ist
ic
s, 2
01
5, V
ol
. 1
51 (
4
)
Model Model I Model II Model III
Number of observations 473 334 371
Mean Standard deviation
Min. Max. Mean Standard deviation
Mean Standard deviation
EU15/EFTA binary 0.89 0.31 0 1 0.88 0.33 0.82 0.38
Eastern Europe/Russia binary 0.50 0.50 0 1 0.54 0.50 0.36 0.48 North America binary 0.43 0.50 0 1 0.46 0.50 0.26 0.44 Latin America binary 0.25 0.43 0 1 0.27 0.45 0.12 0.32
Asia binary 0.52 0.50 0 1 0.55 0.50 0.41 0.49
first_fdi_1990 binary 0.61 0.49 0 1 0.61 0.49 0.62 0.49 first_fdi_2000 binary 0.25 0.43 0 1 0.24 0.43 0.23 0.42 firm_age continuous 68.40 46.76 3 353 71.26 47.26 68.26 46.12 r&d_intensity continuous 2.59 6.21 0 79.44 2.89 7.09 2.50 5.45 tertiary_share continuous 28.20 20.59 0 100 29.17 20.52 28.77 20.86 employment_growth continuous 10.22 367.53 –4544 1882 10.36 369.26 10.15 413.45 size continuous 839.99 4203.90 4 62412 883.45 4598.66 1024.88 4730.17
inflow ordinal 2.86 2.29
outflow ordinal 4.44 2.91
sales_motive continuous –0.04 1.02
institutional_motive continuous 0.01 1.03
production_cost_motive continuous 0.00 1.00
input_motive continuous 0.05 0.99
Notes: Information on firm_age, r&d_intensity firm_age, tertiary_share, employment_growth and size are presented in absolute numbers The factor analysis that is used to identify the four groups of motives (sales_motive, institutional_motive, production_cost_motive and input_ motive) contains all observations available. Due to missing values for other model variables, the number of observations that could be used in the regression of Model III is smaller (371 observations compared to 473 in the factor analysis). Therefore, the mean of the factor scores in the regression differs from zero.
en
d
T
h
e C
h
ar
ac
te
ris
tic
s of F
D
I A
ct
iv
iti
es L
o
ca
te
d i
n Di
ffere
n
t H
o
st R
eg
io
n
s
293
Sw
iss J
ou
rn
al of E
conom
ic
s a
nd St
at
ist
ic
s, 2
01
5, V
ol
. 1
51 (
4
)
Table A.2: Correlation Matrix (based on Model I; N 473)
EU15/ EFTA
Eastern Europe
North America
Latin America
Asia first_fdi_ 1990
first_fdi_ 2000
firm_age r&d_ intensity
tertiary_ share
employ-ment_ growth
Eastern Europe 0.036
North America 0.110 0.379
Latin America 0.123 0.440 0.440
Asia 0.004 0.433 0.485 0.493
first_fdi_1990 0.198 0.239 0.266 0.193 0.225
first_fdi_2000 –0.069 –0.165 –0.094 –0.129 –0.072 –0.719
firm_age 0.038 0.082 0.088 0.003 0.025 0.221 –0.202
r&d_intensity 0.020 0.228 0.354 0.208 0.252 0.184 –0.098 0.064
tertiary_share –0.004 –0.024 0.137 0.159 0.193 0.052 –0.012 –0.110 0.239
employment_growth 0.109 –0.019 0.048 0.074 –0.029 –0.031 0.003 –0.095 0.043 –0.013
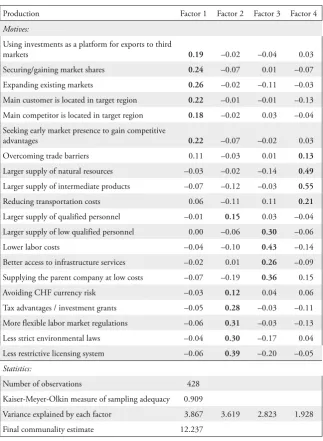
Table A.3: Principal Components Factor Analysis of Motives for Production-Oriented FDI (Rotated Factor Loadings; Factor Pattern Matrix)
Production Factor 1 Factor 2 Factor 3 Factor 4
Motives:
Using investments as a platform for exports to third
markets 0.19 –0.02 –0.04 0.03
Securing/gaining market shares 0.24 –0.07 0.01 –0.07
Expanding existing markets 0.26 –0.02 –0.11 –0.03
Main customer is located in target region 0.22 –0.01 –0.01 –0.13 Main competitor is located in target region 0.18 –0.02 0.03 –0.04 Seeking early market presence to gain competitive
advantages 0.22 –0.07 –0.02 0.03
Overcoming trade barriers 0.11 –0.03 0.01 0.13
Larger supply of natural resources –0.03 –0.02 –0.14 0.49
Larger supply of intermediate products –0.07 –0.12 –0.03 0.55
Reducing transportation costs 0.06 –0.11 0.11 0.21
Larger supply of qualified personnel –0.01 0.15 0.03 –0.04 Larger supply of low qualified personnel 0.00 –0.06 0.30 –0.06
Lower labor costs –0.04 –0.10 0.43 –0.14
Better access to infrastructure services –0.02 0.01 0.26 –0.09 Supplying the parent company at low costs –0.07 –0.19 0.36 0.15
Avoiding CHF currency risk –0.03 0.12 0.04 0.06
Tax advantages / investment grants –0.05 0.28 –0.03 –0.11 More flexible labor market regulations –0.06 0.31 –0.03 –0.13 Less strict environmental laws –0.04 0.30 –0.17 0.04 Less restrictive licensing system –0.06 0.39 –0.20 –0.05
Statistics:
Number of observations 428
Kaiser-Meyer-Olkin measure of sampling adequacy 0.909
Variance explained by each factor 3.867 3.619 2.823 1.928 Final communality estimate 12.237
The Characteristics of FDI Activities Located in Different Host Regions 295
Swiss Journal of Economics and Statistics, 2015, Vol. 151 (4)
References
Arvanitis, Spyros, Heinz Hollenstein, Marius Ley, and Tobias Stucki (2011), “Die Internationalisierung des Dienstleistungssektors und der Indus-trie der Schweizer Wirtschaft”, KOF Studien, 21, Zürich.
Aw, Bee Yan, and Yi Lee (2008), “Firm Heterogeneity and Location Choice of Taiwanese Multinationals”, Journal of International Economics 75(1), pp. 167–179.
Barrios, Salvador, Holger Görg, and Eric Strobl (2006), “Multinationals’ Location Choice, Agglomeration Economies and Public Incentives”, Interna-tional Regional Science Review 29(1), pp. 81–107.
Basile, Roberto, Davide Castellani, and Antonello Zanfei (2008), “Loca-tion Choice of Multina“Loca-tional Firms in Europe: The Role of EU Cohesion Policy”, Journal of International Economics 74(2), pp. 328–340.
Blonigen, Bruce A. (2005), “A Review of the Empirical Literature on FDI Determinants”, Atlantic Economic Journal 33(4), pp. 383–403.
Blonigen, Bruce A., and Miao Wang (2005), “Inappropriate Pooling of Wealthy and Poor Countries in Empirical FDI Studies”, in Does Foreign Direct Investment Promote Development? T. Moran, E. Graham and M. Blomstrom, eds., pp. 221–243. Washington, DC: Institute for International Economics. Brainard, S. Lael (1993), “An Empirical Assessment of the Factor Proportions
Explanation of Multi-National Sales”, NBER Working Papers 4583. Cam-bridge (MA): National Bureau of Economic Research, CamCam-bridge.
Brainard, S. Lael (1997), “An Empirical Assessment of the Proximity-Concen-tration Tradeoff between Multinational Sales and Trade”, American Economic Review 87(4), pp. 520–544.
Cantwell, John (2008), “Location and the Multinational Enterprise”, Journal of International Business Studies 40(1), pp. 35–41.
Cassiman, Bruno, and Reinhilde Veugelers (2002), “R&D Cooperation and Spillovers: Some Empirical Evidence from Belgium”, American Economic Review 92(4), pp. 1169–1184.
CEPII (2010), CEPII geographic data. http://www.cepii.fr/anglaisgraph/bdd/ distances.htm.
Chen, Maggie Xiaoyang, and Michael O. Moore (2010), “Location Deci-sions of Heterogeneous Multinational Firms”, Journal of International Eco-nomics 80, pp. 188–199.