ABSTRACT
INTRODUCTION North Carolina has a high rate of smoking, yet legislators cut the state’s budget for tobacco control in 2011 from $17 million to $1.2 million. To inform legislators and others about effects of this cut, this ecological study uses county-level data to predict mortality rate reduction by reducing smoking prevalence in North Carolina’s 100 counties.
METHODS County-level smoking data for 1996 were reported as percent of the county population who smoked. County level demographic data were taken from the 2010 US Census and the North Carolina Office of State Budget Management. Selected disease specific mortality rates for were reported per 100,000 county population. Linear regression analysis evaluated how a one-percent reduction in county smoking prevalence could reduce county mortality rates.
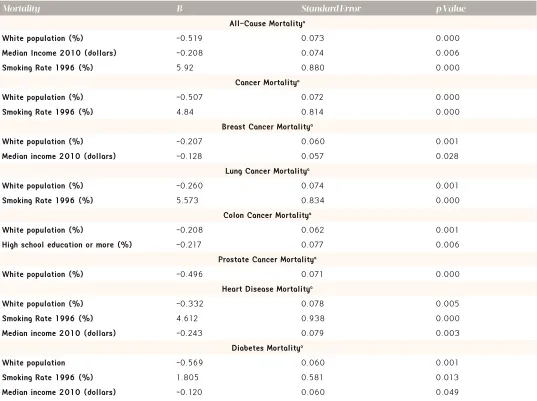
RESULTS The 1996 percent county-level smokers correlated with 2010 rates for mortality from all-causes, total cancer, lung cancer, heart disease and diabetes (regression coefficients = 5.92; 4.84; 5.57; 4.12 and 1.80, respectively). The regression coefficient (5.92) for 1996 county level smoking rates was greatest for all-cause mortality. This coefficient implies that for each one percent change in county smoking rates in 1996, there would be a corresponding change in county all-cause mortality of 5.92 deaths per 100,000 population.
CONCLUSIONS This study found correlations between 1996 county-level smoking rates and disease-specific 2010 mortality in North Carolina’s 100 counties. Informing legislators and other stakeholders about these findings might influence an increase in tobacco control funding statewide as well as in legislators’ home counties. Other states could follow this approach.
INTRODUCTION
Tobacco use is the leading cause of preventable death in the US1. About 480,000 deaths from use of this product occur annually, and include deaths from secondhand tobacco smoke. According to the Centers for Disease Control and Prevention, about one out of five deaths are due tobacco. In addition, tobacco use cuts life short: the life expectancy of smokers is about 10 years less than nonsmokers1. Between 2001 and 2012, smoking rates nationally have declined from 22.7% to 18.5%2. During this period, Utah and California witnessed declines in smoking from 13% to 11.2%; and 16.8% to 13.1%, respectively. In 2012, West Virginia and Kentucky had the highest rates of smoking at 28.4% and 28.6% respectively2.
Historically, North Carolina has been one of the highest tobacco producing states in the nation3. In addition, tobacco-related production in the state has cortobacco-related with smoking
Tobacco Program Budget Cuts: Could these Influence Future.
North Carolina County Mortality Rates?
John G. Spangler1
AFFILIATION
1 Wake Forest School of Medicine, Department of Family and Community Medicine, North Carolina, United States
KEY WORDS
Data interpretation, health policy, smoking, mortality, risk factors, cancer, diabetes mellitus, heart diseases, ecological study
CORRESPONDENCE TO
John Spangler, Wake Forest School of Medicine, Department of Family Medicine, Medical Center BLVD, 27157 Winston Salem, North Carolina, United States. Email: jspangle@ wakehealth.edu
Tob. Prev. Cessation 2016;2(November):74 http://www.dx.doi.org/10.18332/tpc/66486
rates4-6. In 2001, NC ranked 40th out of the 50 states in adult tobacco use at 26.0% (the higher percent prevalence the lower the rank, e.g., lower ranks are worse)2. As tobacco-related agriculture in the state declined, by 2012, the state’s smoking prevalence rank had improved to 32nd with the prevalence of adult smoking declining to 21.3%2. Despite this progress, NC state funding for tobacco control efforts was cut by the state legislature in 2011 from $17 million to $1.2 million annually7. Cutting state funding for tobacco control has meant fewer resources for county-level control efforts7.
county-level smoking rates as predictors of 2010 county-level disease-specific mortality. This arrangement ensured that county-level “exposure” to tobacco use preceded county-level mortality, since many of these diseases take at least several years to develop. The estimated relationship between the reductions in mortality coinciding with reduction in smoking prevalence might be useful to increase funding for tobacco control efforts in North Carolina, and might serve as a template for other states. Although this study used ecological data at the population level from a variety of sources, ecological study designs are useful in describing population-level effects that can be missed at the level of individuals11.
METHODS
Data
This ecological study correlated data at the county-level in North Carolina. Smoking data for 1996 were reported as percent of the county population who were smokers12. County level demographic data were taken for the 2010 US Census13 and the North Carolina Office of State Budget Management14. The data included median county age, income, population, percent of population with high school (or greater) education, and percent of the population that was white. Disease specific mortality rates were reported per 100,000 population by NC counties for all-cause mortality; total cancer mortality; mortality from breast, lung, colon and prostate cancer; and heart disease and diabetes mortality15. Since chronic disease takes at least several years to develop, and since exposure must precede disease development, using 1996 smoking rates is rational for predicting death rates fourteen years later.
Statistical Analysis
Data on demographics, smoking and mortality rates were analyzed descriptively. Next, multivariate linear regression was carried out to evaluate the contribution of 1996 smoking rates by county (independent variables) on the prevalence of 2010 county-level disease specific mortality rates (dependent variables). All models controlled for demographics, and significance was set at <0.05. IBM SPSS 21 statistical software was used for analyses.
RESULTS
County data for NC’s 100 counties are listed in Table 1. The median county population was 54,691 with a median of 77.3% white and 40.8 years of age. The median population of high school or greater education was nearly 80%, and the median income was just over $49,500 annually. Median
Table 1. Median demographic and mortality rates and 1996 smoking prevalence in North Carolina Counties (N=100).
Characteristic Value
Population 2010 54691
Percent White 2010 77.3
Median Age (years) 2010 40.8
Percent with High School Education or More 2010
79.2
Median Income (dollars) 2010 49500
Percent Population Smoking in 1996 24.0
All-Cause Mortality Ratea 856
Cancer Mortality Ratea 188
Breast Cancer Mortality Ratea 23.3
Lung Cancer Mortality Ratea 59.5
Colon Cancer Mortality Ratea 16.0
Prostate Cancer Mortality Ratea 24.8
Heart Disease Mortality Ratea 196
Diabetes Mortality Ratea 23.5
a2010 Mortality rates per 100,000 county population.
county smoking rate was 24.0%. In general, median county mortality rates exceeded national rates1, 2. Median county mortality rates also differed from reported rates for North Carolina as a whole1, 2 likely because this study measured mortality at the county and not the state level; and because this study employed median, and not average, rates.
DISCUSSION
This study has found strong correlations between county-level cigarette smoking rates in 1996 and specific causes of death at the county level in North Carolina’s 100 counties. As would be expected, the correlation between these variables was greatest for all-cause and lung cancer mortality.
These observed correlations help predict the level of tobacco-related mortality at the county level. For example, each one percent decrease (or increase) in smoking levels in 1996 would imply a decrease (or increase) of approximately 5 cancer or cardiovascular deaths per 100,000 population and nearly 3 diabetes deaths per 100,000 population at the “average” county-level. The relationship is not perfect, however. As general figures, estimates can be made that could impact legislators by applying these reductions to their home counties. Mecklenburg County (Charlotte, NC), for instance,
has a population of 731,42412. Applying the above rates for lung cancer to Mecklenburg County implies that approximately 88 deaths could have been avoided in 2010 by merely a 1% reduction in the 1996 smoking prevalence. The same would also be generally true for the other causes of death. It should be noted in this regard that this study did not examine all possible causes of death related to tobacco. A good example of diseases not included is death related chronic obstructive pulmonary disease. Adding the analysis of these types of mortality would increase the projected number of tobacco-related deaths at the county level. Thus, this analysis represents a minimum number of tobacco-specific mortality events. By the same token, these findings do not include cases of tobacco-related morbidity not resulting in death, such as non-fatal myocardial infarctions, diabetic complications, asthma attacks or exacerbations of chronic obstructive pulmonary disease. Table 2. Linear regression modeling of county-level 2010 selected causes of mortality, 2010 demographic characteristics and 1996 smoking prevalence of North Carolina Counties (N=100).
Mortality B Standard Error p Value
All-Cause Mortalitya
White population (%) -0.519 0.073 0.000
Median Income 2010 (dollars) -0.208 0.074 0.006
Smoking Rate 1996 (%) 5.92 0.880 0.000
Cancer Mortalitya
White population (%) -0.507 0.072 0.000
Smoking Rate 1996 (%) 4.84 0.814 0.000
Breast Cancer Mortalitya
White population (%) -0.207 0.060 0.001
Median income 2010 (dollars) -0.128 0.057 0.028
Lung Cancer Mortalitya
White population (%) -0.260 0.074 0.001
Smoking Rate 1996 (%) 5.573 0.834 0.000
Colon Cancer Mortalitya
White population (%) -0.208 0.062 0.001
High school education or more (%) -0.217 0.077 0.006
Prostate Cancer Mortalitya
White population (%) -0.496 0.071 0.000
Heart Disease Mortalitya
White population (%) -0.332 0.078 0.005
Smoking Rate 1996 (%) 4.612 0.938 0.000
Median income 2010 (dollars) -0.243 0.079 0.003
Diabetes Mortalitya
White population -0.569 0.060 0.001
Smoking Rate 1996 (%) 1.805 0.581 0.013
Median income 2010 (dollars) -0.120 0.060 0.049
Because such death rates and morbidity data are missing, this study underrepresents the harm conferred on the state by tobacco use.
Nevertheless, law makers might respond best to specific numbers relating to their home counties. The “median county death rates” derived from all 100 counties is a fairly abstract concept. Legislators might understand this concept better should it be applied to their specific county. The rates of 5.93 and 5.57, respectively, of all-cause and lung cancer deaths per 100,000 population attributable to smoking could be mathematically applied to a politician’s home county population. This would provide a very specific and meaningful number to grasp. Since legislators respond best to conditions affecting their constituents9, local application of death rates might stimulate action by these officials to increase funding for tobacco control at both the state and their home county levels. Unfortunately, facts by themselves will likely cause little legislative change; advocacy by stake holders is also essential. Richmond and Kotelchuck’s health policy model16, for example, emphasizes that both a specific knowledge base and social action plan are essential to change political will. Thus, in order to actually affect tobacco related mortality rates in North Carolina, data presented here are only one piece of the tripartite model (knowledge, action plan and political will) to bring about health policy change. Advocates must present these findings to key policy leaders, and make them relevant to their home counties17.
This analysis is subject to a number of limitations. For example, analyses controlling for clustering, as well as analyses carried out at a more local level such as census tracks, would allow for better estimates of local effects of tobacco use on local mortality. However, such data are not available for North Carolina. Also mitigating this concern is the fact that other researchers have used county-level data to make policy recommendations, particularly when such data are the best available18-25. A second limitation is the ecological nature of this analysis, since ecological data do not reach down to the individual person level11. Therefore, ecological results do not address person-place interactions25 such as the interplay between a person’s nicotine addiction level and local cessation resources. As an illustration, in the 1996 smoking prevalence data set this study employed12, counties with the lowest smoking rates have some of the highest levels of resources for tobacco cessation. Clearly, local resources to help with quitting tobacco use would allow some counties to reduce the prevalence of this behavior—and hence, tobacco-related mortality—better than other counties. For example, in 2006, Orange County (Chapel Hill, NC) had one of the lowest rates
of smoking (16%), but also had developed a highly proactive tobacco cessation outreach through the University of North Carolina, Chapel Hill. This county experienced a decline to 15.3% smoking prevalence by 2012, after benefiting from the presence of this resource.
It is important to note secular trends which also impact these findings. In North Carolina a profound change in tobacco policy occurred on January 1, 2010—the state implemented regulations mandating that all bars and restaurants become tobacco-free. This had a dramatic effect on conditions extremely sensitive to year-to-year exposure of the public to second hand smoke. For example, in the three years between 2006 and 2009 (before the implementation of this tobacco free policy), hospital admissions for asthma decreased from 124/100,000 population to 117/100,000 population respectively—a 5.6% decline. In the three years after this smoke free implementation (2010 to 2013), hospital admissions for asthma decreased from 110/100,000 to 92/100,000 population, respectively—a 16.4% decline. The magnitude of this decline in asthma hospitalization rates was likely unaffected by the budget cut for tobacco control in 2010 from $17 million to $1.2 million, since public exposure to tobacco smoke likely dropped very quickly. Adjusting for inflation, such hospitalization rates translate into a $9.2 million increase in costs for respiratory disease hospital care between 2006 and 2009; and a $2.1 million decrease in costs for respiratory hospital care between 2010 and 2013.
Smoke free environments in North Carolina likely also had effects on rates of tobacco use. For example, between 2003 and 2014, smoking rates in North Carolina declined from 22% to 19% redundant. There were no declines in South Carolina and Virginia (22% and 20% at both points)2. These states, which are contiguous to North Carolina, do not have restaurant or bar prohibitions against smoking, making it difficult to tease out the effects of the «North Carolina budget cuts» for tobacco programs; such study controlling for these factors would strengthen these findings. Further, budget cuts do not necessarily translate to increased mortality rates. Moreover, relationships that hold true at the population (county) level may not translate to the individual level.
to devote 25% annually of its share of the Master Settlement Agreement between states’ attorneys general and the tobacco industry to fund tobacco control in North Carolina. These Master Settlement Agreement dollars devoted to tobacco control were cut by the NC General Assembly in 2011 from $17 million annually to $1.2 million7. This dramatic and sudden reduction in funding occurred even though state-funded tobacco control efforts had lessened youth tobacco use to historically low rates27. Although smoking prevalence in NC between 2003 and 2014 declined from 22% to 19%, the rate of this decline might have accelerated if tobacco funding were restored to pre-2011 levels. This study’s analysis might help legislators in North Carolina to grasp mortality reductions from restored funding based on numbers relevant to their constituents. Furthermore, this approach could pave the way for other states and nations to adopt a similar analysis, providing their law makers with a call to action to decrease tobacco-related morbidity and mortality.
CONCLUSIONS
The 1996 percent county-level smoking rates correlated with 2010 rates for mortality from all-causes, total cancer, lung cancer, heart disease and diabetes in North Carolina’s 100 counties. Each one percent decrease in smoking levels in 1996 would imply about 6 fewer deaths per 100,000 population from any cause; nearly 6 fewer deaths from lung cancer; and a reduction in nearly 5 cancer or cardiovascular deaths per 100,000 population. There would additionally be approximately 2 fewer diabetes deaths per 100,000 population at the “average” county-level. While these correlations cannot provide information on causation, the fact that exposure (county smoking rates) preceded the outcome (mortality rates) does point to a strong connection between the two rates. Informing legislators and other stakeholders about these findings might influence an increase in tobacco control funding statewide as well as in legislators’ home counties. Other states could follow this approach.
CONTRIBUTOR STATEMENT
JS conceived the idea, collected the data, analyzed the data and wrote and approved the manuscript.
REFERENCES
1. Tobacco data and statistics. Atlanta (GA): Centers for Disease Control and Prevention; 2014. Avalilable from: http://www.cdc.gov/ tobacco/data_statistics/fact_sheets/health_effects/tobacco_related_ mortality/ (accessed May 2014)
2. County health rankings and roadmaps. Princeton (NJ): Robert Wood Johnson Foundation; 2014.Available from: http://www. rwjf.org/en/research-publications/research-features/rwjf-datahub/
national.html#q/scope/national/ind/59/dist/0/char/0/time/23/ viz/map/cmp/brkdwn (accessed May 2014)
3. Census of Agriculture—State Data: Table 45: Farms by North American Industry Classification System. Washington (DC): U. S. Department of Agriculture, National Agricultural Statistics Service; 2007.
4. Spangler JG, Bell RA, Knick S, Michielutte R, Dignan MB, Summerson JH. Church-related correlates of tobacco use among Lumbee Indians in North Carolina. Ethn Dis 1997; 8: 73-80. 5. Spangler JG, Bell RA, Dignan MB, Michielutte R. Prevalence and
predictors of tobacco use among Lumbee Indian women in Robeson County, North Carolina. J Community Health 22: 115-125. 6. Bell RA, Spangler JG, Quandt SA. Smokeless tobacco use among
adults in the Southeast. South Med J 2000; 93: 456-462.
7. Fitzsimon C. North Carolina’s backwards slide on tobacco prevention. Raleigh, NC: NC Policy Watch; 3/10/2015. Available from: http://
www.ncpolicywatch.com/2015/03/10/north-carolinas-backwards-slide-on-tobacco-prevention/ (accessed November 2016). 8. Kurtz KT. Legislatures and Citizens: Communications Between
Representatives and Their Constituents. Albany (NY): Produced for USAID G/DG by the National Conference of State Legislatures and the Research Foundation of the State University of New York; 1997. 9. Butler DM., Nickerson DW. Can Learning Constituency Opinion Affect How Legislators Vote? Results from a Field Experiment. Quart J Polit Sci 2011; 6: 55-83.
10. Little TH, Ogle DB. The Legislative Branch of State Government: People, Process and Politics. Santa Barbara (CA): ABC-CLIO, 2006. 11. Gordis L. Epidemiology. 2nd Edition. Philadelphia (PA): W.B.
Saunders, 2000; p. 185-187.
12. Dwyer-Lindgren L, Mokdad AH, Srebotnjak T, Flaxman AD,
Hansen GM, Murray CJ. Cigarette smoking prevalence in US counties: 1996-2012. Popul Health Metr 2014; 12(1):5.
13. State and County Quick Facts, North Carolina. Washington (DC): US Census Bureau; 2010. Available from: http://quickfacts.census. gov/qfd/states/37000.html. (accessed May 2014)
14. Population Figures by race and total by county. Raleigh (NC): North Carolina Office of State Budget and Management; 2010. Available from: http://www.osbm.state.nc.us/ncosbm/facts_and_figures/ socioeconomic_data/population_estimates/county_estimates.shtm. (accessed May 2014)
15. Statistics and Reports, County Level. Raleigh (NC): North Carolina State Center for Health Statistics; 2010. Available from: http://www. schs.state.nc.us/data/county.cfm (accessed May 2014)
16. Richmond JB, Kotelchuck M. Political influences: rethinking national health policy. In: Mcquire C, Foley R, Gorr A, Richards R, editors. Handbook of Health Professions Education. San Francisco (CA): Jossey Bass Publishers, 1983; p. 993
17. Atwood K, Colditz GA, Kawachi I. From public health science to prevention policy: placing science in its social and political contexts. AJPH 1997; 87: 1603-1603.
18. Tolbert CJ, Grummel JA. Revisiting the Racial Threat Hypothesis: White Voter Support for California’s Proposition 209. State Politics & Policy Quarterly 2003; 3: 183-202.
19. Citrin J, Reingold B, Walters E, Green D. The “Official English” movement and the symbolic politics of language in the United States. West Polit Q 1990; 43: 535-60.
20. Stein R, Post S, Rinden A. Reconciling Context and Contact Effects on Racial Attitudes. Polit Res Q 2000; 53: 285-303.
21. Tolbert C, Hero R. Race/Ethnicity and Direct Democracy: An Analysis of California’s Illegal Immigration Initiative. J Polit 1996; 58: 806-18.
22. Tolbert C Hero R. Facing Diversity: Racial/Ethnic Context and Social Policy Change. Polit Res Q 2001; 54: 571-604.
24. Roch CH, Rushton MJ. Social Context and Voting Over Taxes: Evidence from a Referendum in Alabama. Andrew Young School Research Paper No. 06-06; 2007. Available from: http://dx.doi. org/10.2139/ssrn.890715. (accessed May 2014)
25. Epperson MW, Wolff N, Morgan RD, Fisher WH, Frueh BC,
Huening J. Envisioning the next generation of behavioral health and criminal justice interventions. Int J Law Psychiatry 2014; Epub ahead of print.
26. Peto R, Boreham J, Lopez AD, Thun M, Heath C. Mortality from tobacco in developed countries: indirect estimation from national vital statistics. The Lancet. 1992 May 23;339(8804):1268-78. 27. 2009 North Carolina Youth Tobacco Survey. Raleigh (NC): North
Carolina Department of Health and Human Serivces, Tobacco Prevention and Control Branch; 2009. Available from: http://www. tobaccopreventionandcontrol.ncdhhs.gov/data/yts/index.htm. (accessed May 2014)
CONFLICT OF INTEREST
The authors have completed and submitted the ICMJE Form for Disclosure of Potential Conflicts of Interest and none were reported.
FUNDING
There was no source of funding for this research.
PROVENANCE AND PEER REVIEW