O
O
P
P
T
T
I
I
M
M
I
I
Z
Z
A
A
T
T
I
I
O
O
N
N
O
O
F
F
A
A
N
N
E
E
C
C
O
O
N
N
O
O
M
M
I
I
C
C
A
A
N
N
D
D
E
E
N
N
V
V
I
I
R
R
O
O
N
N
M
M
E
E
N
N
T
T
A
A
L
L
D
D
I
I
S
S
P
P
A
A
T
T
C
C
H
H
I
I
N
N
G
G
P
P
O
O
W
W
E
E
R
R
U
U
S
S
I
I
N
N
G
G
T
T
H
H
E
E
B
B
A
A
C
C
T
T
E
E
R
R
I
I
A
A
L
L
F
F
O
O
R
R
A
A
G
G
I
I
N
N
G
G
O
O
P
P
T
T
I
I
M
M
I
I
Z
Z
A
A
T
T
I
I
O
O
N
N
A
A
L
L
G
G
O
O
R
R
I
I
T
T
H
H
M
M
(
(
B
B
F
F
O
O
A
A
)
)
M
M
o
o
h
h
a
a
m
m
e
e
d
d
A
A
m
m
i
i
n
n
e
e
L
L
a
a
r
r
b
b
i
i
C
C
h
h
a
a
h
h
t
t
,
,
M
M
o
o
s
s
t
t
e
e
f
f
a
a
R
R
a
a
h
h
l
l
i
i
Département d’Electrotechnique, BP 1505, Oran El M‘naouer, Oran, Algérie
ABSTRACT: This paper proposes the application of a
method based on the Algorithm Bacterial Foraging Optimization ( BFOA) for the study of an environmental economic Dispatching (EED). We will optimize the non-linear function of the cost of fuel necessary for the production of electric power and function of the gas emissions toxic gas from the plants and determine the active powers to generate these functions are under some types equality and inequality constraints. Our approach is performed on a standard network IEEE 30bus. Numerical results indicate that the proposed algor ithm is in most cases more active than other meta-heuristique or deterministic methods.
KEYWORDS: Optimization, Economic and Environmental
Dispatching, Bacterial Foraging Optimization Algorithm (BFOA).
1.
INTRODUCTION [BRA11, A+092] ¶In addition, the amendments of the world Act of 1990 forced energy producers to change their operational design to reduce emissions into the atmosphere of gases greenhouse by thermal power plants that are toxic gases (NOx, SO2, CO2, CO). The proposed option has been added to the economic optimization another problem of optimization of emissions. Thus the problem ED can be treated as multi objective optimization. In recent years, this option has received a lot of attention since it requires only a small modification of the ED base to include emissions. Different techniques have been reported in the literature concerning the environmental economic dispatching (EED). In view of the difference of homogeneity of the two equations the equation of the cost of fuel is given to $/h and the equation of gas emissions is given in Kg/h.
Recently, and to overcome this optimization problem, some based on artificial intelligence methods have been applied. These methods generally do not require the convexity of the objective multi function and have a high probability to converge to the global minimum. Among these methods, we are interested in the bacterial foraging optimization algorithm (BFOA). This method was proposed by Passino for solving optimization problems.
2. MATHEMATICS FORMULATION OF THE PROBLEM
2.1 Economic Dispatching [Rah96, Wal86, BBR09]
Electric power producers determine experimentally curves giving the cost of production of each group with the power that he spouts. Associated with these curves function is a polynomial of degree «n». In practice, most often, it is presented as a second degree polynomial:
c
P
b
P
a
P
F
i Gi
i Gi
i Gi
i 2)
(
(1)
The Fi(PGi) function is known as a discrete form. We use interpolation methods to determine the coefficients ai, bi and ci which are specific to each unit of production.
The function of total cost of production of electrical energy minimization is a task that presents itself as follows:
ng
i
F
iP
GiF
Min
1
(
)
(2)Under the following constraints:
ng
i1
P
GiP
chP
L0
(3)P
P
P
Gimin Gi Gimax (4)
ng
i1
Q
GiQ
chQ
L 0 (5)Q
Q
Q
Gimin
Gi
Gimax (6)V
V
V
imin
i
imax (7)
ij
ijmaxThis problem with all these constraints is difficult to achieve for a large network with usually multiple nodes and interconnection lines, therefore it is necessary to simplify the problem.
We omitted the constraints (7) and (8), assuming that all nodes have roughly the same voltage module an d phase.
The constraints (5) and (6) can be neglected, given that reactive power does not have a significant influence on the cost function.
The expression of loss of transmission on the basis of generated power is given by:
ng
i ng
j Gi ij Gj
L
P
B
P
P
1 1 (9)2.2 Environmental Dispatching [Rah96, Gue04, BBR09]
The problem of environmental dispatching is to minimize the emission of gas from the power plants function. It can be described as follows:
ng
i
E
iP
GiE
Min
1
(
)
(10)
i Gi i Gi i Gii
P
P
P
E
( ) 2 (kg/h) (11)under the constraints given by equations (3) and (4). Ei(PGi) is the function of emissions and αi, βi and δi are characteristic emission factors attached to each production group.
Where:
Fi: Cost of production of the unit i function. Ei: Function of unity i emission rates ng: number of generators for production. PGi: Active power produced by the unit i. QGi: Reactive power produced by the unit i. PCh: Consumed total active power.
QCh: consumed total reactive power. PL: Total losses active transmission. QL: Total losses reactive transmission.
PGi min and PGi max: active power minimum and maximum of the generator i.
QGi min etQGi max: reactive power minimum and maximum of the generator i.
3. THE BACTERIA FORAGING
OPTIMIZATION ALGORITHM [SR10, D+09, D+08, T+06]
During foraging of the real bacteria, locomotion is achieved by a set of tensile flagella. Flagella help an E.coli bacterium to tumble or swim, which are two basic operations performed by a bacterium at thetime of foraging. When they rotate the flagella in the
clockwise direction, each flagellum pullson the cell. That results in the moving of flagella independently and finally the bacterium tumbles withlesser number of tumbling whereas in a harmful place it tumbles frequently to find a nutrient gradient.
Moving the flagella in the counterclockwise direction helps the bacterium to swim at a very fast rate.In the above-mentioned algorithm the bacteria undergoes chemotaxis, where they like to move towardsa nutrient gradient and avoid noxious environment. Generally the bacteria move for a longer distancein a friendly environment. Fig 1 depicts how clockwise and counter clockwise movement of abacterium take place in a nutrient solution.
Figure 1. Swim and tumble of a bacterium
When they get food in sufficient, they are increased in length and in presence of suitable temperature they break in the middle to from an exact replica of itself. This phenomenon inspired Passino to introduce an event of reproduction in BFOA.
Due to the occurrence of sudden environmental changes or attack, the chemotactic progress may be destroyed and a group of bacteria may move to some other places or some other may be introduced in the swarm of concern. This constitutes the event of elimination-dispersal in the real bacterial population, where all the bacteria in a region are killed or a group is dispersed into a new part of the environment. Let us define a chemotactic step to be a tumble followed by a tumble or a tumble followed by a run. Let j be the index for the chemotactic step. Let k be the index for the reproduction step. Let l be the index of the elimination-dispersal event. Also let
p: Dimension of the search space,
S: Total number of bacteria in the population, Nc: The number of chemotactic steps,
Ns: The swimming length.
Nre: The number of reproduction steps,
Ned: The number of elimination-dispersal events, Ped: Elimination-dispersal probability,
C(i): The size of the step taken in the random direction specified by the tumble.
Chemotaxis: This process simulates the movement of an E.coli cell through swimming and tumbling via flagella. Biologically an E.coli bacterium can move in two different ways. It can swim for a period of time in the same direction or it may tumble, and alternate between these two modes of operation for the entire lifetime. Suppose θi(j, k, l) represents i-th bacterium at jth chemotactic, k-th reproductive and l-th elimination-dispersal step. C(i) is the size of the step taken in the random direction specified by the tumble (run length unit). Then in computational chemotaxis the movement of the bacterium may be represented by:
)
(
).
(
/
)
(
).
(
)
,
,
(
)
,
,
1
(
j
k
l
ij
k
l
C
i
i
Ti
i
i
(12)Where ∆ indicates a vector in the random direction whose elements lie in [-1, 1].
Swarming: An interesting group behavior has been observed for several motile species of bacteria including E.coli and S. typhimurium, where intricate and stable spatio-temporal patterns (swarms) are formed in semisolid nutrient medium. A group of E.coli cells arrange themselves in a traveling ring by moving up the nutrient gradient when placed amidst a semisolid matrix with a single nutrient chemo-effecter. The cells when stimulated by a high level of succinate, release an attractant aspertate, which helps them to aggregate into groups and thus move as concentric patterns of swarms with high bacterial density. The cell-to-cell signaling in E. coli swarm may be represented by the following function:
s i p m i m m repellant repellant s i p m i m m attracant attracant s i i cc ccw
h
w
d
J
J
P jk l j k l1 1 2 1 1 2 1 ) ) ( exp( ) ) ( exp( ) ) , , ( , ( )) , , ( , (
(13)where Jcc(θ, P(j, k, l)) is the objective function value to be added to the actual objectivefunction (to be minimized) to present a time varying objective function, S is the total number ofbacteria, p is the number of variables to be optimized, which are present in each bacterium andθ=[θ1, θ2, …, θp]T is a point in the p-dimensional search domain.
Daatractant, wattractant, hrep ellant, wrepellant are different coefficients that should be chosen properly.
Reproduction: The least healthy bacteria eventually die while each of the healthier bacteria (those
yielding lower value of the objective function) asexually split into two bacteria, which are then placed in the same location. This keeps the swarm size constant.
Elimination and Dispersal: Gradual or sudden changes in the local environment where a bacterium population lives may occur due to various reasons e.g. a significant local rise of temperature may kill a group of bacteria that are currently in a region with a high concentration of nutrient gradients. Events can take place in such a fashion that all the bacteria in a region are killed or a group is dispersed into a new location. To simulate this phenomenon in BFOA some bacteria are liquidated at random with a very small probability while the new replacements are randomly initialized over the search space.
The BFOA Algorithm [KGG11]:
[Step 1] Initialize parameters p, S, Nc, Ns, Nre, Ned, Ped, C(i)(i=1,2…S),θi.
[Step 2] Elimination-dispersal loop: l=l+1 [Step 3] Reproduction loop: k=k+1 [Step 4] Chemotaxis loop: j=j+1
[a] For i=1,2…S take a chemotactic step for bacterium i as follows.
[b] Compute fitness function, J(i, j, k, l). )) , , ( ), , , ( ( ) , , , ( ) , , ,
(i j kl J i jkl j kl P j kl
J i
cc
J
(i.e. add on the cell-to cell attractant–repellant profile to simulate the swarming behavior) where, Jcc is defined in (13).
[c] Let Jlast=J(i, j, k, l) to save this value since we may find a better cost via a run.
[d] Tumble: generate a random vector ∆(i)Rp with each element ∆m(i),m=1,2,…,p, a random number on [-1, 1].
[e] Move: Let
)
(
).
(
/
)
(
).
(
)
,
,
(
)
,
,
1
(
j
k
l
ij
k
l
C
i
i
Ti
i
i
(14)This results in a step of size C(i) in the direction of the tumble for bacterium i.
[f] Compute J(i, j +1, k, l) and let
)) , , 1 ( ), , , 1 ( ( ) , , , ( ) , , 1 ,
(i j kl J i j kl j kl P j kl
J i
cc
J
[g] Swim
i) Let m=0 (counter for swim length).
ii) While m<Ns (if have not climbed down too long). • Let m=m+1.
• If J(i, j +1, k, l)<Jlast (if doing better), let Jlast=J(i, j +1, k, l) and let
)
(
).
(
/
)
(
).
(
)
,
,
(
)
,
,
1
(
j
k
l
ij
k
l
C
i
i
Ti
i
i
And use this θi
(i+1, j, k)to compute the new J(i, j +1, k, l) as we did in [f]
• Else, let m=Ns. This is the end of the while statement.
[h] Go to next bacterium (i+1) if i≠S(i.e., go to [b] to process the next bacterium).
[Step 5] If j<Nc, go to step 4. In this case continue chemotaxis since the life of the bacteria is not over. [Step 6] Reproduction:
[a] For the given k and l, and for each i =1,2,…,S , let
1
1 ( , , , ) Nc
j i
health J i j k l
J
(16)be the health of the bacterium i (a measure of how many nutrients it got over its lifetime and how successful it was at avoiding noxious substances). Sort bacteria and chemotactic parameters C(i) in order of ascending cost Jhealth (higher cost means lower health).
[b] The Sr bacteria with the highest Jhealth values die and the remaining Sr bacteria with the best values split (this process is performed by the copies that are made are placed at the same location as their parent). [Step 7] If k<Nre, go to step 3. In this case, we have not reached the number of specified reproduction steps, so we start the next generation of the chemotactic loop.
[Step 8] Elimination-dispersal: For i=1,2,…,S with probability Ped, eliminate and disperse each bacterium (this keeps the number of bacteria in the population constant). To do this, if a bacterium is eliminated, simply disperse another one to a random location on the optimization domain. If l<Ned, then go to step 2; otherwise end.
4. APPLICATIONS [SR10, D+09, D+08, T+06]
4.1 Network [A+09, MFD07, KG05]
The application for our B FOA algorithm was made on network IEEE 30 bus with 6 generators of electrical energy.
The total load of the network is 283,4 MW. Under constraints:ΣPGi-Pch-PL=0
5≤PG1≤150 (MW) 5≤PG2≤150 (MW) 5≤PG3≤150 (MW) 5≤PG4≤150 (MW) 5≤PG5≤150 (MW) 5≤PG6≤150 (MW)
Active loss was considered as a constant whose value is determined by the Newton-Raphson method. With data parameters of lines, there are active network losses equal to 2.6MW
The cost of each production function coefficients are represented in table 1:
Table 1. Coefficients of Poduction function
Coef G1 G2 G3 G4 G5 G6
C 10 10 20 10 20 10
B 200 150 180 100 180 150 A 100 120 40 60 40 100
Table 2. Coefficients of Emission function
Coef G1 G2 G3 G4 G5 G6
α 4,091 2,543 4,258 5,426 4,258 6,131 -β 5,554 6,047 5,094 3,550 5,094 5,555 γ 6,490 5,638 4,586 3,380 4,586 5,151
Our algorithm parameters have been adjusted as follows:
P=1, S=70, Nc=10, Ns=3, Nre=4, Ned=2, Ped=0.25, C(i)=0.2.
4.2 The application re sults
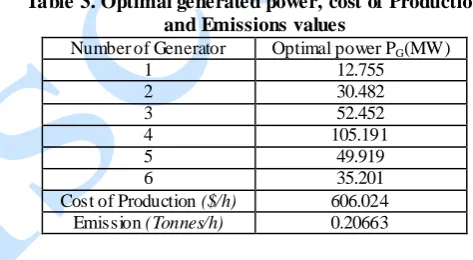
The optimal values of generated power, of the multifunction of the cost of fuel and emissions at the same time are given by table 3:
Table 3. Optimal generated power, cost of Production and Emissions values
Number of Generator Optimal power PG(MW)
1 12.755
2 30.482
3 52.452
4 105.191
5 49.919
6 35.201
Cost of Production ($/h) 606.024 Emission (Tonnes/h) 0.20663
The optimal values of generated power, of the function of the cost of fuel and the emission rate function are separately given by table 4:
Table 4. Optimal values of generated power, cost of Production and Emissions separately
Optimization of cost
Optimization of emission
PG1 (MW) 10.347 35.829
PG2 (MW) 30.709 43.842
PG3 (MW) 53.569 52.389
PG4 (MW) 102.021 49.720
PG5 (MW) 52.803 52.069
PG6 (MW) 36.551 52.151
Cost of Production ($/h) 605.902 633.147
Emission (Tonnes/h) 0,20607 0,18738
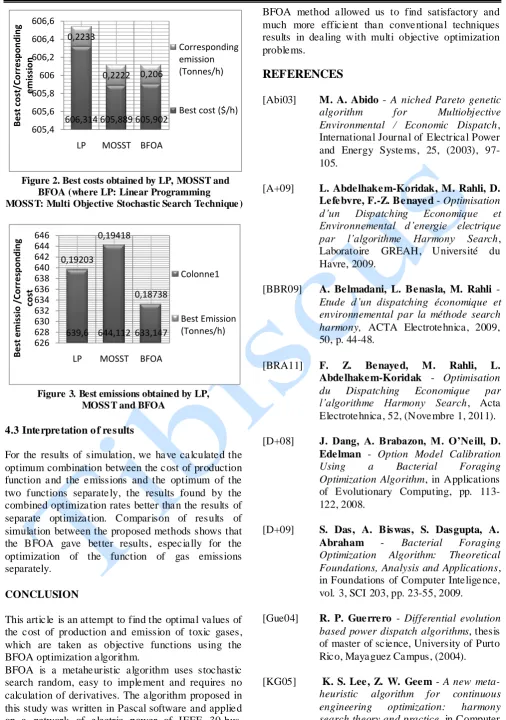
A few models to compare are presented in Table 5.
Table 5. Comparison between LP, MOSST and BFOA
Method LP MOSST BFOA
Best cost ($/h) 606,314 605,889 605.902 Corresponding emission
(Tonnes/h)
0,22330 0,22220 0,20607
Best Emission(Tonnes/h) 0,19203 0,19418 0,18738
606,314 605,889 605,902 0,2233
0,2222 0,206
605,4 605,6 605,8 606 606,2 606,4 606,6
LP MOSST BFOA
B
e
st
co
st/
Co
rr
e
sp
o
n
d
in
g
e
m
issi
o
n
Corresponding emission (Tonnes/h)
Best cost ($/h)
Figure 2. Best costs obtained by LP, MOSST and BFOA (where LP: Linear Programming MOSST: Multi Objective Stochastic Search Technique )
639,6 644,112 633,147 0,19203
0,19418
0,18738
626 628 630 632 634 636 638 640 642 644 646
LP MOSST BFOA
B
e
st
e
m
issi
o
/
Co
rr
e
sp
o
n
d
in
g
co
st
Colonne1
Best Emission (Tonnes/h)
Figure 3. Best emissions obtained by LP, MOSST and BFOA
4.3 Interpretation o f results
For the results of simulation, we have calculated the optimum combination between the cost of production function and the emissions and the optimum of the two functions separately, the results found by the combined optimization rates better than the results of separate optimization. Comparison of results of simulation between the proposed methods shows that the BFOA gave better results, especially for the optimization of the function of gas emissions separately.
CONCLUSION
This article is an attempt to find the optimal values of the cost of production and emission of toxic gases, which are taken as objective functions using the BFOA optimization algorithm.
BFOA is a metaheuristic algorithm uses stochastic search random, easy to implement and requires no calculation of derivatives. The algorithm proposed in this study was written in Pascal software and applied on a network of electric power of IEEE 30-bus.
BFOA method allowed us to find satisfactory and much more efficient than conventional techniques results in dealing with multi objective optimization problems.
REFERENCES
[Abi03] M. A. Abido - A niched Pareto genetic algorithm for Multiobjective Environmental / Economic Dispatch, International Journal of Electrical Power and Energy Systems, 25, (2003), 97- 105.
[A+09] L. Abdelhakem-Koridak, M. Rahli, D. Lefebvre, F.-Z. Benayed - Optimisation d’un Dispatching Economique et Environnemental d’energie electrique par l’algorithme Harmony Search, Laboratoire GREAH, Université du Havre, 2009.
[BBR09] A. Belmadani, L. Benasla, M. Rahli - Etude d’un dispatching économique et environnemental par la méthode search harmony, ACTA Electrotehnica, 2009, 50, p. 44-48.
[BRA11] F. Z. Benayed, M. Rahli, L. Abdelhakem-Koridak - Optimisation du Dispatching Economique par l’algorithme Harmony Search, Acta Electrotehnica, 52, (Novembre 1, 2011).
[D+08] J. Dang, A. Brabazon, M. O’Neill, D. Edelman - Option Model Calibration Using a Bacterial Foraging Optimization Algorithm, in Applications of Evolutionary Computing, pp. 113-122, 2008.
[D+09] S. Das, A. Biswas, S. Dasgupta, A. Abraham - Bacterial Foraging Optimization Algorithm: Theoretical Foundations, Analysis and Applications, in Foundations of Computer Inteligence, vol. 3, SCI 203, pp. 23-55, 2009.
[Gue04] R. P. Guerrero - Differential evolution based power dispatch algorithms, thesis of master of science, University of Purto Rico, Mayaguez Campus, (2004).
Methods in Applied Mechanics and Engineering, vol. 194, issues 36-38, pp. 3902-3933, 2005.
[KGG11] R. Kaur, A. Girdhar, S. Gupta - Color Image Quantization based on Bacteria Foraging Optimization, International Journal of Computer Applications, vol. 25, issue 7, pp. 33-42, July 2011.
[MFD07] M. Mahdavi, M. Fesanghary, E. Damangir - An improved harmony search algorithm for solving in Applied Mathematics and Computation, vol. 188, issue 2, pp. 1567-1579, 2007.
[Rah96] M. Rahli - Contribution à l’Etude de la Répartition Optimale des Puissances Actives dans un Réseau d’Energie Electrique, thèse de doctorat, USTO-MB, Oran, Algeria, (06 janvier 1996).
[SR10] M. Senthil Kumar, P. Renuga - Bacterial Foraging Algorithm based Enhancement of Voltage Profile and Minimization of Losses Using Thyristor Controlled Series Capacitor (TCSC), International Journa l of Computer Applications 7(2):21– 27, September 2010.
[T+06] M. Tripathy, S. Mishra, L. L. Lai, Q. P. Zhang - Transmission loss reduction based on FACTS and bacteria foraging algorithm, in Proceedings of the Parallel Problem Solving from Nature, PPSN 06, pp. 222–231, Reykjavik, Iceland, (September 2006).