Vol.9 (2019) No. 1
ISSN: 2088-5334
Indonesia Composite Index Prediction using Fuzzy Support Vector
Regression with Fisher Score Feature Selection
Zuherman Rustam
#1, Nurrimah
#2, Rahmat Hidayat
* #Department Mathematics, University of Indonesia, Depok 16424, Indonesia E-mail:#1[email protected]; #2[email protected]
*
Department Information Technology, Politeknik Negeri Padang, Padang 25163, Indonesia E-mail:[email protected]
Abstract— A precise forecast of stock price indexes may return profit for investors. According to CNNMoney, in the same month as
much as 93% of global investors have lost money for trading stock. It is influenced by the stock market itself which is complex, nonlinear, has great noise, and chaotic system. Stock has characteristics that the higher the targeted potential return, the higher possibility of losses. One of the stock price indexes is stock composite index. Exact predictions of stock composite index can be critical for creating powerful market exchanging strategies. There are a lot of research that has been done to assist investors in minimizing possible losses. One of them is by predicting stock composite index. In this paper, a modified supervised learning method used to solve regression problems, Fuzzy Support Vector Regression (FSVR) is focused. As the complexity of many factors influence the movement of stock price prediction, the prediction results of Support Vector Regression (SVR) can not always meet people with precision. Thus, this study implies Fuzzy Support Vector Regression (FSVR) stock prediction model, in which fuzzy membership with mapping function is employed to generate a precise price fluctuation of stock. To assure the use of features on model prediction , Fisher Score is used to find high quality and informative features that can enhance the accuracy. Indonesia Composite Index or Jakarta Composite Index (JKSE) is considered as input data and the result showed that Fisher Score can be applied as feature selection on Indonesia Composite Index prediction with the best model is eleven out of fifteen features with 80% of training data with 0.043529 error.
Keywords— fuzzy support vector regression; fuzzy membership function; fisher score; jakarta composite index; stock composite
index prediction.
I. INTRODUCTION
Viewed macro economically, investment is one way to meet the needs of life in the future. There are various instruments in investment; one of them is stock. The stock is a type of security that signifies ownership in a corporation. The purpose of doing stock trading is to achieve maximum profit because the stock is promising the high return of profit. However, as a high return of profit, the stock is also having a high potential return of risks. This due to the complexity of many factors that influences the stock price prediction. The stock market is seen as a testing task of financial time series forecasting process since the stock market is essentially powerful, nonlinear, entangled, nonparametric, and turbulent [1]. Even more, the stock market is influenced by numerous full scales monetary factors such as political events, firms' policies, general financial conditions, investors' expectations, institutional investors' choices, development of another stock market, and psychology of investors [1].
Predicting the movement of stock price indexes is critical for creating powerful market trading strategies. The stock price index is an indicator that reflects the situation on the stock market, that is bullish, bearish, and sideway. In this paper, Indonesia Composite Index is used for prediction as one of the stock composite index. JKSE has been one of the indicators for investors about the movement of price in the stock market. It describes performances of all joint stock that listed on Indonesia Stock Exchange (IDX). There are many tools to predict stock composite index; one of them use the application of machine learning. Machine learning is a multidisciplinary science that using algorithms to learn and solve real-world problems by building the best models based on data provided [2]. Machine learning techniques are also the basic algorithm and high-frequency trading routines that frequently used by financial time series process.
control in forecasting, so that the result close to the actual values which are called Fuzzy Support Vector Regression (FSVR) [3-5]. Along with this, to identify the most influential features for model prediction, Fisher Score is used. Fisher Score helps to improve the performance of the selected features on model prediction. Fuzzy membership function was structured to the model to anticipate and improve the accuracy and generalization of regression processing. On previous studies, Fuzzy Support Vector Regression (FSVR) has been successfully proved for displaying good performance in stock forecasting problems, it suited for any sample size with any noise distribution type and gave substantial improvements in forecasting performance [5]-[7].
A. Related Works
Much research on predicting stock prices has been conducted in recent years. Moghaddam and Esfandyari used an Artificial Neural Network (ANN) and showed that there is no significant explanatory difference between using four and nine prior working days as input parameters [8]. Lee, Ow, and Ling discovered that the Hidden Markov Model is a more accurate technique compared to ANN for predicting the direction of a stock’s price change [9]. Support Vector Regression itself had proven its outstanding performance for the financial problem, which is stock price index prediction [10]. The term technical analysis refers to methods and tools for evaluating past stock market movement to predict future stock price trends [11] and is often represented in graphical form. Finally, Hybrid Intelligent Systems [12] are being developed to select key variables, and the results show that they outperform other approaches [13].
B. Indonesia Composite Index
Indonesia composite index is one of the stock price indexes in Indonesia that reflects the composite performance of all stocks listed in Indonesia Stock Exchange (IDX). It provides investors a useful statistical measure of overall market performance over time. The movement of the stock composite index is a signal for investors whether they should sell, buy, or hold their stocks. The calculation of its value is also useful as a benchmark for a stock portfolio. A stock portfolio is a collection of investment assets in the form of shares, either owned by individuals or companies. It is important for shareholders to know how to do portfolio management to achieve investment objectives. One way to manage a portfolio is to minimize the risks. By looking at the stock composite index, investors can predict the possibilities that will occur in the stock market such as stock prices and profits to be gained.
C. Fisher Score
Fisher score is one of the most widely used supervised feature selection methods [14]. It is a filter-based feature selection method. It filters features according to some statistically tests before calculating the score of each feature and then selects the best features based on a ranking score from the highest to the lowest. It is often used in a preprocessing model to remove irrelevant and excessive features of problems. The objective of feature selection in the Fisher score is to find a subset of features where the
distances between data points of different classes are as large as possible, while the distances between data points in one class are as small as possible. In 2012, Gu, Li, and Han proposed the Fisher Score formula below as follows [14]:
=∑
∑ (1)
where and be the mean and standard deviation of the -th class, corresponding to the -th feature, while and be the mean and standard deviation of the whole dataset for the -th feature, and the size of the -th class respectively in the data space.
D. Fuzzy Membership Function
In 1965, Lotfi A. Zadeh introduced membership function on his first paper about fuzzy sets [15]. The membership function is a curve showing the mapping of data input points into intervals 0.1. Hence, the fuzzy membership function is a curve that shows the mapping of data points in a fuzzy set into a membership value or commonly called a membership degree whose value is in the intervals 0.1. Membership values are often assigned for fuzzy clustering [16]. Many researchers study the application methods of fuzzy clustering such as Fuzzy Kernel C-Means [17] and Fuzzy K-Medoids [18]. Many researchers have been used fuzzy in many different fields, such as for face recognition [19], linguistics [20], bioinformatics [21], and financial time series that is going to be discussed. Fuzzy has been demonstrated to give promising results in anticipating the stock value return inspected various expectation models based on multivariate classification techniques [1]. Fuzzy can enhance Support Vector Regression (SVR) in reducing the effects of outliers and noises on model prediction. Lin and Wang have proposed a model with a linear fuzzy membership function [4] with the mean of class with label +1 and the mean of class with label −1. The fuzzy membership of each sample is:
= 1 − | − | " + #1 − | − | " + #⁄⁄ where * = −1where * = 1 (2)
with # > 0 to avoid the case = 0 [5]. The radius of class
+1
and−1
are as follows:" = -./| − 0| 1ℎ3"3 * = 1 (3)
" = -./| − 0| 1ℎ3"3 * = −1 (4)
*
is class label where * ∈ ℤ. E. Support Vector Regression (SVR)Classification (SVC), and regression problems employ Support Vector Regression (SVR).
The basic principle of Support Vector Regression (SVR) is looking for a hyperplane function that maximizing the margin by using linear/nonlinear learning algorithm and kernel trick, also using 6-insensitive loss function is used instead of the traditional least-squares estimator because of its shortcomings in the presence of outliers and noises of data. The 6-insensitive loss function is used to solve nonlinear regression problems which is evaluating regression function used on the model and it showed the performance result in financial time series forecasting problems. The general form of the linear model used as a regression function in Support Vector Regression (SVR) can be using [23]:
* = 〈8, 〉 + ; (5)
where is the input vector, 8 is the weight parameter, and
;
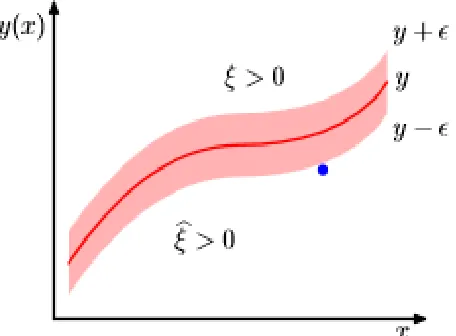
is a bias.Suppose that 0, < is training data pair where ∈ ℝ> as input vectors with d dimension and < ∈ ℝ is observation value or variable target with = 1,2, … , A. The one that make it different with classification problems is for regression problems, 6-insensitive loss function is developed as an estimator that insensitive with small changes in the model. The 6-insensitive loss function gives zero error if the absolute difference is less than 6 , with 6 > 0 . The solution for optimization problem is by using slack variable B ≥ 0 andBD ≥ 0. These slack variables are introduced as soft margin for target points that lie outside 6-tube to lie inside the 6-tube such that, for each data point, slack variables are given. As can be seen in Fig. 1, illustration that explained Support Vector Regression (SVR) with 6-insensitive loss function and the role of slack variables [23]:
Fig. 1 Support Vector Regression (SVR) with 6-insensitive loss function and slack variables
For points that lie in the region above the 6-tube, given penalty value B > 0 and BD = 0. For points that lie in the region below the 6-tube, given penalty value B = 0 and BD > 0 . For points that lie inside the 6 -tube, B = BD = 0, is the used data points for regression n model. Thus the optimization primal problem for Support Vector Regression (SVR) is [22]:
minH,IJK‖H‖K+ M ∑ NB + BD OP
QJ (6)
Subjected to
R< − 〈H,〈H, 0〉 + ; − < ≤ 6 + BD0〉 − ; ≤ 6 + B = 1,2, … , A
(7)
By solving the primal problem above using Lagrangian multiplier . and .T will be obtained the weight parameter and bias parameter for prediction model of Support Vector Regression (SVR) as in the form below [23]:
8 = ∑P .∗− .V∗W
QJ (8)
; = < − 6 − ∑ N.X∈[ X∗− .WOZN ,Y∗ XO (9)
where .∗ and .V∗W is solution of the optimization problem, S is the index set of support vectors, and ZN , XO is the kernel function that used to solve nonlinear problems in Support Vector Regression (SVR) so that nonlinear data can be separated linearly.
Thus, the prediction model for nonlinear problems in Support Vector Regression (SVR) is formulating as follows [23]:
\ = ∑ ]^∗− ]_∗W ` ,
^ a
^Qb + I (10)
Some parameters control regression performance, they are
trade-off M , the width of 6-tube, and the kernel function ZN , XO for nonlinear problems. Those parameters are called hyper parameter. M Parameter is used to control the
trade-off between minimizing the error on training data with
enhancing the model complexity. Indirectly, 6-tube also determines the amount of support vector. These parameters can be defined by using cross-validation method, the method for data validation.
TABLEI
SUPPORT VECTOR REGRESSION ALGORITHM
Input c = d , < , ∈ ℝ> ,< ∈ ℝ eQJ
Output 8 , ;, so the prediction value is obtained *
Steps 1. Input the data sets
d , < eQJ
2. Calculate the optimum solution .∗ and .WV∗ from the following Lagrange dual quadratic programming equation.
fg ., .T = −12 h h . − .i N.V X− .iOY P
XQJ P
QJ
ZN , XO − 6 h . + .iV P
QJ
+ h . − .i <V P
QJ
Subjected to
0 ≤ . ≤ M, 0 ≤ .i ≤ M, h . − .V iV P
QJ
= 0
3. Calculate the weight parameter:
8 = h .∗− . V∗
W
P
QJ
4. Calculate the bias parameter:
; = < − 6 − hN.X∗− .WOZN ,Y∗ XO X∈[
5. Substitute the weight and bias parameter to predicted model to * = 〈8, 〉 + ; so become
* = h .∗− . V∗
W Z ,
P
QJ
+ ;
II. MATERIAL AND METHODS
This study uses Fuzzy Support Vector Regression (FSVR) with a Fisher Score for feature selection in preprocessing data to predict changes in stock prices. Incorporating the Fisher score increases the effectiveness of the technical analysis of the features in the prediction model. The Fisher score reduces the dimensionality of data, improving the model’s fit and predictive accuracy. Technical analysis is applied to the input variables, and the mapping function transforms close price from raw input data into technical indicator values. Because the values and scales of the technical indicators are different, their values are normalized to improve model prediction.
A. Data Sets
In this paper, Indonesia Composite Index and usually called IDX Composite Index or Jakarta Composite Index (JKSE) is used. It is an index of all stocks in Indonesia that traded on Indonesia Stock Exchange (IDX) or often called in Bahasa Indonesia as Indeks Harga Saham Gabungan (IHSG). The data is close price of daily historical prices.
There are totally 973 data points of daily trading from March 3rd, 2014 to February 28th, 2018 that obtained from yahoo
finance.
B. Data Preprocessing
TABLEII
TECHNICAL INDICATORS AND ITS SPECIFIC FORMULA
Technical Indicators Formulas
Momentum (MOM) Mj− Mj k
Simple Moving Average (SMA)
∑jQJMj
Exponential Moving Average
(EMA) lmnj= o
Mj× q + Nrmn × 1 − q O, < =
Mj× q + Nlmnj J× 1 − q O, < >
Moving Average Convergence/Divergence
(MACD) lmnJK− lmnKs
Stochastic Oscillator (SO) %K
Mj− ftJu
HhJu− ftJu× 100
Stochastic Oscillator (SO) %D ∑ %ZQJ × 100
Rate of Change (ROC) Mj− Mj k
Mj k × 100
Relative Strength Index (RSI) 100 −
100 1 + xry
Williams %R zMj− zj k
j k− fj k
Mj is the close price of day t, n represents the number of trading days used, lmnj J is Exponential Moving Average (EMA) value yesterday < − 1 , q = 2 + 1⁄ is the smoothing or weight coefficient where is the -day time period of Exponential Moving Average (EMA) , ftJu and HhJu represents the lowest of low price and the highest of high price in last 14 days,
xr
y=
∑€~• •{|}~•
/
∑€~• •ƒ„}~• where …†j is increasing price change (in this case, close price) and ‡ˆj is decreasing price change (in this case, close price), zj k and fj k represents the highest and lowest price in last x days, respectively.
After the technical indicators are defined, normalization is needed to make the value of all features comparable. The normalization formula that used to normalized the technical indicators into intervals -1.1 is [11]:
/y < = k j ‰0Š ‹
‰Œ• ‹ ‰0Š ‹× 2 − 1 (11)
where /y < is technical indicator n on the <-th day that have been normalized, / < is technical indicator n on the < -th day, min n is the minimal value of technical indicator n , max n is the maximal value of technical indicator n . The multiplier “2” comes from the new maximal value of technical indicator n , which is 1 substracted to the new minimal value of technical indicator n , which is −1 . Also
the substracter “1” is comes from the new minimal value of technical indicator n , which is −1.
For finding best features for model prediction, this paper used Fisher Score. As already discussed before, in their paper, Gu, Li, and Han have studied application of some features selection on face recognition [14]. The accuracy of Fisher Score showed high result, above 90%. This case motivates to try it on stock prediction problems. The process to run is also very efficient and fast to compute. From the normalized data, it needs to add labels for each of daily close
price to simplify the feature selection process. The label is in
the form of a class that compared to the closing price of the previous day to classify the increases and the decreases in stock prices. Algorithm for Fisher Score [27]:
1) Import data as an input, where X = input data 2) Calculate the Fisher score for each feature in X 3) Rank the Fisher score values from highest to lowest 4) Evaluate each features of the number of features
one, two, up to fifteen
C. Fuzzy Support Vector Regression
the effects of data points are different, some data points are more important than others, and some are affected by noise and outliers and become less significant in the regression model. Therefore, the fuzzy membership values are applied at each data point to control the contribution of each data point to the output produced [5].
The fuzzy membership value can be considered as the level of contribution of the relevant data points to the mapping function in the prediction model and value 1 − can be considered as a less significant contribution. The smaller the fuzzy membership value, the smaller the contribution of data points on the model [5]. This mapping function in fuzzy membership functions is used to produce the right stock price fluctuations [6]. The main motivations for using FSVR are to reduce the effect of outliers, to minimize the error in predicting stock prices, and to find the best hyper plane that maximize margins. Since, Support Vector Regression (SVR) is focused on minimizing the generalization error rather than training error, fuzzy membership function takes place to do it.
Fuzzy membership function is applied to each training data points on input variables, so it gives more control on their contribution to model prediction. Its mapping function transforms the input variables to intervals 0.1, then from the results of the fuzzy membership calculation, new data will be formed from the result of multiplication between input variables and the results of the fuzzy membership calculation. The training data points that have small value of fuzzy membership will be defined as outliers. The fuzzy membership function that used in this paper is the modification result from fuzzy membership that Lin and Wang proposed [4]. The formula is :
= o 3 | • ‘| ’⁄ • “ 1ℎ3"3 * = 1
1 − 3 | ~ ‘| ’⁄ ~ “ 1ℎ3"3 * = −1 (12)
The table below is a simple algorithm for calculating fuzzy membership values [4].
TABLEIII
FUZZY MEMBERSHIP FUNCTION ALGORITHM
Input c = d , * , ∈ ℝ> , * ∈ ℤ eQJ
Output 0 ≤ ≤ 1, fuzzy membership value
Steps 1. Calculate the required parameters 2. Calculate the fuzzy membership value 3. Form a new input variable using the fuzzy
membership value
The class label used for calculating fuzzy membership value in this paper is y0∈ d−1,1e. This class label is calculated based on the average overall closing price of the stock. If the price on the i-day is higher than the average overall closing price, then it is said that the class label indicates the price on i-day increases and y0= 1. Conversely, if the price on i-day is smaller than the average overall closing price, then the price on day-i is said to decrease and is indicated by the class label y0 = −1.
After the fuzzy membership value of each data point on the feature is obtained, a new input variable will be formed which is the result of multiplication between fuzzy
membership values with each data point on the feature. This new input variable is then used as an input variable in predicting stock prices using Support Vector Regression (SVR).
Support Vector Regression (SVR) input data in the form of paired data 0, < with are input vectors formed from the results between fuzzy membership values and features. In stock price prediction using SVR, the label used is continuous because the prediction using SVR is regression and the label value < is the value of observation, that is, the stock price used as observation or prediction target. Furthermore, the results of the predictions obtained will be analyzed and evaluated.
Predicting stock prices is one of the problems of time series. However, by using SVR machine learning with supervised learning, this assumption can be ignored to solve the problem of this stock price prediction. This is because the stock price input data processed by the SVR is in the form of paired data 0, < , where is an input vector and < is the stock price observation value used, so that it can be seen that each data already has its own label and does not depend on the time variable.
Thus, the difference between the prediction method using FSVR and SVR lies in the input variable. Input variables used in FSVR are multiplication variables between features and fuzzy membership values, then predictions using SVR. While the input variable in the SVR is an input variable (feature) without fuzzy membership value.
Kernel function that used in this paper is Radial Basis Function (RBF) or Gaussian [23]:
ZN , XO = exp −–— − X—K (13)
where – is positive constant with – = − J
K > 0. Kernel is mapping function that transforms nonlinear data from input space to feature space with higher dimension in order to make the problems linearly separable. While, the parameter that used in this paper is – = 0.5.
D. Performa Evaluation
Performa evaluation of the proposed method is denoted by Normalized Mean Square Error (NMSE). Normalized Mean Square Error (NMSE) measures the deviation of actual and prediction values. The smaller value of Normalized Mean Square Error (NMSE), the closer of predicted value to the actual one. The formula [5] is:
Amrl =∑€• š• šT•
“ (14)
Subjected to,
#K=∑€• š• š›•
J (15)
III.RESULTS AND DISCUSSION
The experiment of the proposed method is used with MATLAB R2017b software. From the experiment that has been running, Fuzzy Support Vector Regression (FSVR) gave outperformed result for doing stock composite index prediction with Jakarta Composite Index (JKSE) as input data. The average value of Normalized Mean Square Error (NMSE) from all possible features and percentage of training data is 0.420585. That value is obtained from corresponding input types and data preprocessing methods that have already discussed above. Table 4 below shows the value of Normalized Mean Square Error (NMSE) of Fuzzy Support Vector Regression (FSVR) with and without Fisher Score:
TABLEIV
NMSE VALUE OF FUZZY SUPPORT VECTOR REGRESSION (FSVR) AND
FISHER SCORE
No. Methods NMSE Value
1 FSVR with Fisher Score 0.043529
2 FSVR without Feature Selection 0.100095
As can be seen from Table 4, stock price index prediction using Fuzzy Support Vector Regression (FSVR) with Fisher Score produce NMSE value of 0.043529. Meanwhile, stock price index prediction using Fuzzy Support Vector Regression (FSVR) without any feature selection produce NMSE value of 0.100095. Thus, it can be concluded that stock price index prediction using Fuzzy Support Vector Regression (FSVR) with Fisher Score produce smaller NMSE value than using Fuzzy Support Vector Regression (FSVR) without any feature selection, although the difference is not statistically significant. Both model was from fuzzy membership function with constant , five times running on Support Vector Regression (SVR) part, and using kernel function Radial Basis Function (RBF) with – = 0.5.
The best model that obtained using Fuzzy Support Vector Regression (FSVR) with Fisher Score and produce Normalized Mean Square Error (NMSE) value 0.043529 is model with eleven features out of fifteen features and 80% of training data. It shows that the ability of the best prediction model on Jakarta Composite Index (JKSE) data using Fuzzy Support Vector Regression (FSVR) with Fisher Score with kernel RBF – = 0.5 obtained in the model with eleven features and NMSE value 0.043529 to predict 20% of data by training 80% of the previous data.
From the result and analysis above, it can be seen that the number of features used has an effect on the NMSE produced. However, the amount of the features used do not guarantee that the resulting NMSE value will be smaller or larger.
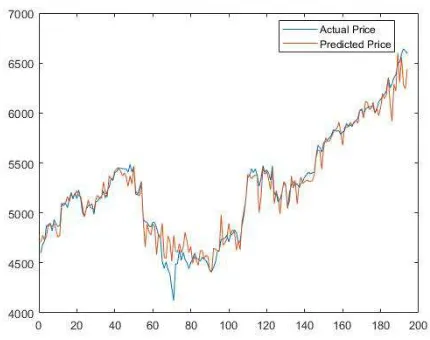
Viewed from the experiment, out of all experiments that have been tried from 1 to 15 features and percentage of training data from 10% to 90%, the best model is from eleven out of fifteen features with 80% of training data or 194 data points for testing and 779 data points for training. From authors’ point of view, this result might be affected by the type of fuzzy membership function, the type of data, or the amount of running times on program because there is random variables effect on Support Vector Regression method. Fig. 2 below shows graph illustration of the plot of the experimental result on best model:
Fig. 2. The plot of best model result between actual and predicted price
IV.CONCLUSIONS
From the experiment above, we conclude that predicting stock price index using Fuzzy Support Vector Regression (FSVR) with Fisher Score produce smaller NMSE value than predicting stock price index using Fuzzy Support Vector Regression (FSVR) without any feature selection. Fuzzy Support Vector Regression (FSVR) accurately predicts the Indonesia Composite Index. Adding the Fisher score on preprocessing data yields better model performance. Thus, predicting stock price index using Fuzzy Support Vector Regression (FSVR) with Fisher Score as feature selection gives results that are closer to the actual price with the tendency that the value of NMSE is closer to the value of 0 compared to predicting stock price index using Fuzzy Support Vector Regression (FSVR) without any feature selection.
The proposed stock composite index prediction model using Fuzzy Support Vector Regression (FSVR) with Fisher Score feature selection offers promising results for investors aiming to predict the movement of stock prices. It can also be used by managers of stock portfolios to minimize the risk of losses. It is easy to compute and more effective and efficient for investors to predict the following day price for their decision whether to hold, buy, or sell their stock.
ACKNOWLEDGMENT
This research was supported financially by the Indonesia Ministry of Research and Higher Education, with PDUPT 2018 research grant scheme ID number 389/UN2.R3.1/HKP05.00/2018.
REFERENCES
[1] S. Wang, G. Li, and Y. Bao, “A Novel Improved Fuzzy Support Vector Machine Based Stock Price Trend Forecast Model”, International Conference on Innovations in Economic Management and Social Science (IEMSS 2017), Jan 2nd, 2018.
[2] S.N. Dhage, and C.K. Raina, “A Review on Machine Learning Techniques”, International Journal on Recent and Innovation Trends in Computing and Communication, vol. 4, March 2016.
[3] S. Abe, and T. Inoue, “Fuzzy Support Vector Machines for Multiclass Problems”, European Symposium on Artificial Neural Networks, Belgium, pp. 113-118, 2002.
[4] C.F. Lin, and S.D. Wang, “Fuzzy Support Vector Machines”, IEEE. Trans. Neural Netw, 2002, 13, 464–471.
[5] Y.K. Bao, Z.T. Liu, L. Guo, and W. Wang, “Forecasting Stock Composite Index by Fuzzy Support Vector Machines Regression”, IEEE. Fourth International Conference on Machine Learning and Cybernetics, Guangzhou, 2005.
[6] X. Ma, “PCA-Fuzzy-SVR Stock Price Prediction”, Master Thesis, University of Amsterdam, August 25th, 2011.
[7] J.C. Hung, “Fuzzy Support Vector Regression Model for Forecasting Stock Market Volatility”, IOS Press, Journal of Intelligent & Fuzzy Systems 31, 1987–2000, 2016.
[8] A.H. Moghaddam, M.H. Moghaddam, and M. Esfandyari, “Stock Market Index Prediction Using Artificial Neural Network”, Universidad Esan. Journal of Economics, Finance and Administrative Science, vol. 21, pp. 89-93, December 2016.
[9] Y. Lee, L.T.C. Ow, and D.N.C. Ling, “Hidden Markov Models for Forex Trends Prediction”, IEEE. 2014.
[10] Z. Rustam, and K. Takbiradzani, “Application Support Vector Regression for Jakarta Composite Index Prediction with Laplacian Score Feature Selection”, Journal of Theoretical and Applied Information Technology, vol. 97, no 01, 2019.
[11] M. Kumar, and M. Thenmozhi, “Forecasting Stock Index Movement: A Comparison of Support Vector Machines and Random Forest”, Indian Institute of Capital Markets 9th Capital Markets Conference Paper, Navi Mumbai, 2006.
[12] A.V. Gavrilov, “Hybrid Intelligent Systems in Ubiquitous Computing”, In Designing Solutions-Based Ubiquitous and Pervasive Computing: News Issues and Trends (pp. 263–281), IDEA Publishing Inc, 2007.
[13] P.C. Chang, and C.H. Liu, “A TSK Type Fuzzy Rule Based System for Stock Price Prediction”, Expert Systems with Applications. 34(1). 135– 144, doi:10.1016/j.eswa.2006.08.020, 2008.
[14] Q. Gu, Z. Li, and J. Han, “Generalized fisher score for feature selection”, CoRR abs/1202.3725, 2012.
[15] L.A. Zadeh., “Fuzzy Sets”, Information and Control 8 (3), 338–353, 1965.
[16] M. Bowie, “Fuzzy Clustering, Feature Selection, and Membership Function Optimization”, 2004.
[17] Z. Rustam, and A.S. Talita, “Fuzzy Kernel C-Means Algorithm for Intrusion Detection Systems”, Journal of Theoretical and Applied Information Technology, vol. 81, 2015.
[18] Z. Rustam, and A.S. Talita, “Fuzzy Kernel K-Medoids Algorithm for Multiclass Multidimensional Data Classification”, Journal of Theoretical and Applied Information Technology, vol. 80, 2015. [19] K.M. Lim, Y.C. Sim, and K.W. Oh, “A Face Recognition System
Using Fuzzy Logic and Artificial Neural Network”, IEEE. [1992 Proceedings] IEEE International Conference on Fuzzy Systems, USA, 2002.
[20] V.H. Le, F. Liu, and D.K. Tran, “Fuzzy Linguistic Logic Programming and its Applications”, Theory and Practice of Logic Programming (TPLP), 2009.
[21] L. Han, X. Zeng, and H. Yan, “Fuzzy Clustering Analysis of Microarray Data”, Proc Inst Mech Eng H, October 2008.
[22] X. Wu, and V. Kumar, “The Top Ten Algorithms in Data Mining”, Taylor & Francis Group, LLC, pp. 37-51, 2009.
[23] C.M. Bishop, “Pattern Recognition and Machine Learning”, Springer, New York, pp. 325-344, 2006.
[24] K.P. Lin, and P.F. Pai, “A Fuzzy Support Vector Regression Models for Business Cycle Prediction”, Elsevier Ltd. Expert Systems with Applications 37, 5430–5435, 2010.
[25] Z. Rustam, D.F. Vibranti, and D. Widya, “Predicting The Direction of Indonesian Stock Price Movement using Support Vector Machines and Fuzzy Kernel C-Means”, Proceeding of 3rd International
Symposium on Current Progress in Mathematics and Sciences, Bali, 2017.
[26] Y. Kara, M.A. Boyacioglu, and Ö.K. Baykan, “Predicting Direction of Stock Price Index Movement using Artificial Neural Networks and Support Vector Machines: The Sample of Istanbul Stock Exchange”, Expert Syst. Appl. 38, 5311–5319, 2011.