ISSN 0975-928X
Research Article
Studies on variability, correlation and path analysis of traits contributing
to fruit yield and its components in okra (
Abelmoschus esculentus
L.
Moench)
Prakash Kerure1*, M. Pitchaimuthu2 and Akshata Hosamani3
1
ICAR-Krishi Vigyan Kendra, Babbur Farm, Hiriyur, Chitradurga Dist 577 598, Karnataka 2
Principal Scientist, Division of Vegetable Crops, ICAR-Indian Institute of Horticultural Research, Bengaluru, Karnataka 3
AAO, Dept. of Agriculture, GOK.
E-mail: [email protected]
(Received: 30 May 2016; Revised: 22 March 2017; Accepted: 25 March 2017)
Abstract
The present investigation was conducted to estimate genetic parameters such as genotypic coefficient of variation (GCV), phenotypic coefficient of variation (PCV), heritability and genetic advance (GA) along with correlations and path coefficients from data collected on 52 okra genotypes collected from the IIHR, Bengaluru, India. Analysis of variance indicated significant differences among the genotypes for different morphological characters. High GCV and PCV were observed for yield per plant, no. of fruits per plant, no. of seeds per fruit, where as moderate GCV and PCV was observed for average fruit weight. High heritability coupled with high GAM were observed for almost all the characters studied, except days to 50% flowering and days to 80 % maturity shows low heritability with low GAM. The yield per plant, plant height and number of seeds per fruit showed high genetic advance that helped in effective and reliable selection through these characters for crop improvement. Fruit yield per plant showed positive association with stem girth, number of branches per plant, plant height, first fruit producing node, fruit length, fruit diameter, average fruit weight, number of fruits per plant, number of seeds per fruit and 100 seed weight while, negative association with days to 50% flowering, number of locules per fruit and days to 80 % maturity. The number of fruits per plant had maximum direct effect on fruit yield per plant followed by average fruit weight. Number of branches per plant, plant height and first fruit producing node contributed to fruit yield per plant indirectly via stem girth, average fruit weight, and number of fruits per plant. Hence, number of fruits and average fruit weight are identified as key traits for developing high fruit yielding genotypes of okra for future breeding programme.
Key words
Fruit yield, GCV, PCV, okra, correlation, path analysis
Introduction
Okra (Abelmoschus esculentus (L.) Moench) an annual, often cross-pollinated crop belonging to the family Malvaceae, is an important crop of the tropics and subtropics of the world. The logical way to start any breeding programme is to assess the existing genetic variability which is the basis for any crop improvement programme. Hence, before taking up any breeding programme, a thorough knowledge regarding the nature and magnitude of genetic variability, heritability and association among the various characters including yield is very essential. The value of a germplasm collection depends not only on the number of accessions it contains, but also upon the diversity present in those accessions.
An improvement way to increase productivity in any crop plant is to first select desirable genotypes from among the existing variations and to use the superior types in the breeding programme. Correlation is an association of two variables. Since, all genes affecting phenotype of two variables may not be completely linked, correlation is seldom complete and must be tested for its significance to confirm whether observed correlation is real or by chance. The path analysis advised by Dewey and Lu, (1959) provides an
effective means of finding out direct and indirect causes of associations and permits a critical examination of given correlation and measure relative importance of each factor. Such information reveals the possibility of simultaneous improvement of various attributes and also helps in increasing the efficiency of selection of complex inherited traits. Therefore, the present investigation conducted to estimate genetic parameters along with correlations and path analysis for yield and its component traits in okra.
Materials and methods
The experimental materials for the present study consisted of 52 genotypes were collected from Indian Institute of Horticultural Research (IIHR), Hessaghatta, Bengaluru. The genotypes were evaluated through a field experiment conducted in randomized block design with three replications at Babbur farm, ICAR-Krishi Vigyan Kendra, Chitradurga District of Karnataka during late
ISSN 0975-928X
from each replication on thirteen parameters viz., plant height (cm), number of branches per plant, first fruit producing node, days to 50 % flowering, days to 80 % maturity, stem girth (mm), fruit length (cm), fruit width (mm), number of fruits per plant, average fruit weight (g), number of seeds per fruit, hundred seed weight (g) and total fruit yield per plant (g) computed in each genotype by adding the fruit weight of all the pickings and divided by number of plants. The mean values were subjected to statistical analysis (ANOVA) as suggested by Panse and Sukatme, 1967. Phenotypic and genotypic co-efficient of variation (Burton and De-Vane, 1953), heritability, genetic advance as per cent mean were calculated. Correlation coefficient was computed by using the formula of Johnson et al. (1955) and path coefficient by Dewey and Lu, (1959).
Results and discussion
The analysis of variance showed that, the variance due to treatments (genotypes) was significant (at P=0.05) for all the traits studied (Table 1), indicating thereby the presence of genetic variability in the experimental material. There was highly significance differences were recorded for all the characters studied.
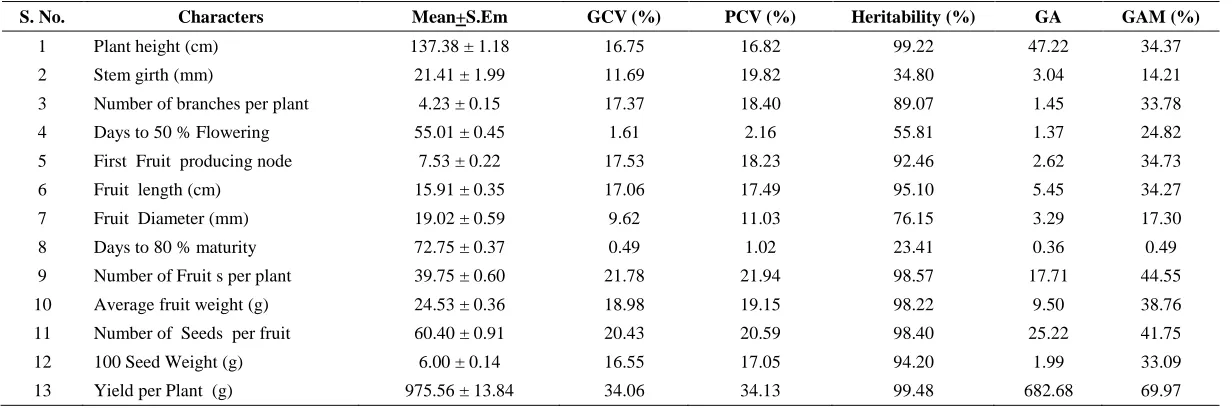
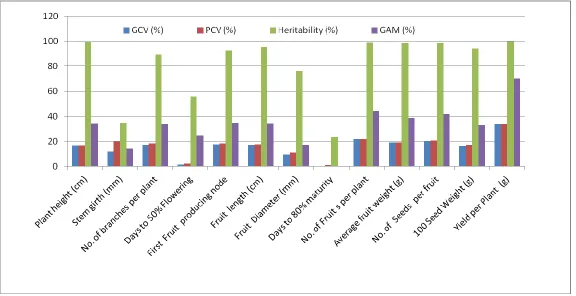
The estimates of mean, genotypic co-efficient of variance (GCV), phenotypic co-efficient of variance (PCV), heritability (h2), genetic advance (GA) and genetic advance over mean (GAM) for different characters are presented in table 2 and Fig.1. The phenotypic coefficient of variation ranged from 1.02 % for days to 80 % maturity to 34.13 % for total yield per plant (g). High GCV and PCV were also observed number of seeds per fruit and number of fruits per plant, where as moderate GCV and PCV was observed for average fruit weight and first fruit producing node. Balakrishnan and Balakrishnan, (1988) also reported the same.
In general the phenotypic values were higher than genotypic values, but differences were less for plant height, number of branches per plant, first fruit producing node, fruit length, number of fruits per plant, average fruit weight, number of seeds per fruit and yield per plant, suggesting that these characters were less influenced by the environmental factors and thus selection on phenotypic basis would holds good. These results are in agreement with earlier findings Mittal et al. (1996). The genotypic coefficient of variation alone is not sufficient to estimate the heritable variation present in a present population. But, heritability along with genetic advance provides a more reliable estimate for predicting the selection advance. The estimate of heritability was highest for total yield per plant (99.48%), while it was least for stem girth (34.80%). High magnitude of broad sense heritability was noticed for plant
height, first fruit producing node, fruit length, no. of fruits per plant, average fruit weight, no. of seeds per fruit, 100 seed weight. Jeyapendi and Balakrishnan, (1992), Mahajan and Sharma, (1979), Prakash and Pitchaimuthu, (2010) recorded maximum heritability for yield per plant. Whereas Gandhi et al. (2001) observed for higher heritability estimates for plant height.
Though, the heritability estimates provide the information on the magnitude of inheritance of quantitative characters, it does not indicate the magnitude of genetic gain obtained by selection of best individual from the best population. So, heritability along with genetic advance is more useful for selection than heritability alone. The study reveled that the characters yield per plant, plant height, no. of seeds per fruit and no. of fruits per plant had higher genetic advance as per cent of mean. Lower genetic advance was exhibited by the characters days to 80 % maturity, days to 50 % flowering, stem girth and fruit diameter. High heritability coupled with high GAM were observed for most all the characters studied, except days to 80% maturity and days to 50 % flowering which
showed high heritability with low GAM
confirming the preponderance of additive genes in controlling the expression of these characters and thus were found to be providing better opportunity for effective and reliable selection for these characters. These results agreed with the earlier workers Sarkar et al. (2004), Panda and Singh, (1997) and Prakash and Pitchaimuthu, (2010). Moderate heritability with moderate to low genetic advance as percent of mean was recorded for stem girth and fruit diameter. This might be attributed to the fact that the parental genotypes might have possessed both additive and/or non additive genes for these traits in different magnitudes and as a result of more pronounced expressions of non additive genes moderate heritability with low genetic advance was noticed. The findings were also collaborated with findings of Panda and Singh, (1997) and Gandhi et al. (2001).
ISSN 0975-928X
yield could be improved through selection based on either of these characters. These findings are in agreement with those of Mandal and Dana (1993), Gondane et al., (1995), Yadav, (1996) and Pooja et al. (2011). The negative correlation of fruit yield per plant was observed between days to 50 per cent flowering, number of locules per fruit and days to 80% maturity. Fruit weight had positive and strong significant association with fruit length, fruit diameter, first fruit producing node, stem girth and no. of branches per plant could be improved through selection based on either of these characters.
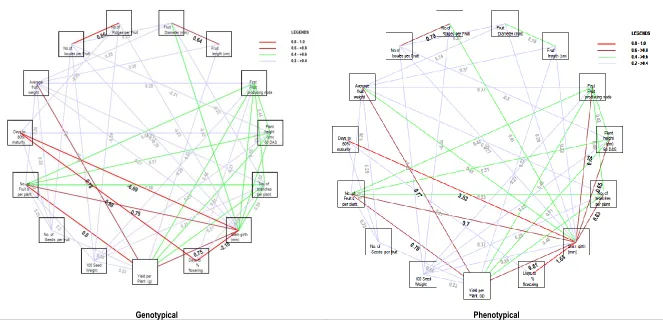
In path coefficient analysis, where the total genotypic association between fruit yield per plant and other characters revealed that maximum direct contribution was made by number of fruits per plant (0.6309) followed by average fruit weight (0.6165), days to 50% Flowering (0.0671) and fruit length (0.0573) (Fig. 3). The trend of results collaborated by Dhall et al. (2000) and Sood et al. (1993). The high positive indirect effect was found in case of stem girth, no. of branches per plant, plant height, first fruit producing node, fruit length, fruit diameter, average fruit weight, no. of fruits per plant. These have also been corroborated by Reddy et al. (1985) and there were most important characters for selection for these traits can also be relied upon for improving fruit yield of the crop.
References
Balakrishnan, S. and Balakrishnan, R. 1988. Studies on variability in Bhendi [Abelmoschus esculentus
(L.) Moench]. South Indian J. Hort., 36(6): 300-302.
Butron, G.W. and De-Vane, E.H. 1953. Estimating heritability in tall-fescue (Festuca circundiancae) from replicated clonal material.
Agron. J., 45: 478- 481
Dewey, D.R and Lu, K.H. 1959. A correlation with path coefficient analysis of yield components of crested wheat grass seed production. Agron. J.,
51: 515-518.
Dhall, R.K., Arora, S.K. and Mamata Rani. 2000. Correlation and path analysis in advanced generations of okra (Abelmoschus esculentus L. Moench). Indian J. Hort.,57(4): 342-347 Gandhi, H.T., Yadav, M.D. and Navale, P.A. 2001.
Studies on variability in okra (Abelmoschus esculentus (L.) Moench). J. Maharastra Agric. Univ. Res., 26(2): 146-148.
Gondane, S.V., Bhatia, G.L. and Pratap, P.S. 1995. Correlation studies of yield components in okra (Abelmoschus esculentus L. Moench). Haryana J. Hort. Sci., 24: 151-156.
Jeyapandi, A. and Balakrishnan, R. 1992. Genetic variability in okra. Indian J. Hort., 49(2): 197-199.
Johanson, H.W., Robinson, H.E. and Comstock, R.E. 1955. Estimation of genetic and environmental variability in soybean. Agron. J., 47: 314-318. Prakash, K. and Pitchaimuthu, M. 2010. Nature and
magnitude of genetic variability and diversity
studies in okra (Abelmoschus esculentus L. Moench). Elect. J. Pl. breed., 1(6): 1426-1430. Mahajan, Y.B. and Sharma, B.R. 1979. Parent-offspring
correlation and heritability of some characters in okra. Scientia Hort., 10: 135-139.
Mandal, M. and Dana, I. 1993. Genetic divergence in okra (Abelmoschus esculentus L. Moench).
Indian Agric., 37: 189-192.
Mittal, P., Prakash, S. and Singh, A.K. 1996. Variability studies in tomato (Lycopersicon esculentum
Mill.) under sub humid conditions of Himachal Pradesh. South Indian J. Hort., 44: 132-134. Panda, P.K. and Singh, K.P. 1997. Genetic variability,
heritability and genetic advance for pod yield and its component traits in okra hybrids. Madras Agri. J., 84: 136-138.
Panse, V.G. and Sukhatme, P.V. 1967. Statistical methods for agricultural workers, Indian Council of Agricultural Sciences, New Delhi.
Pooja Chaukhande, Chaukhande, P.B. and Dod, V.N. 2011. Correlation and path analysis studies in okra (Abelmoschus esculentus L. Moench). The Asian J. Hort., 6(1): 203-206.
Reddy, K.R., Singh, R.P. and Rai, A.K. 1985. Variability and association analysis in okra.
Madras Agric. J., 72: 478-480.
Sarkar, S., Hazra, P. and Chattopadhyay, A. 2004. Genetic variability, correlation and path analysis in okra [Abelmoschus esculentus (L.) Moench].
The Hort. J., 17: 59-66.
Sood, S., Arya, P.S. and Sharma, S.K. 1993. Correlation and path coefficient analysis in bhendi (Abelmoschus esculentus L. Moench). Him. J. Agric. Res., 19: 37-42.
ISSN 0975-928X
Table 1. Pooled analysis of variance fruit yield and yield its component characters in okra
Source of variance d.f.
Plant height (cm)
Stem girth (mm)
No. of branches per plant
Days to 50% Flowering
First Fruit producing
node
Fruit length (cm)
Fruit Diameter
(mm)
Average fruit weight
(g)
Days to 80% maturity
No. of Fruit s per plant
No. of Seeds per fruit
100 Seed Weight
(g)
Yield per Plant (g)
Replication 2 4.44 6.02 0.36 8.54 1.36 2.67 1.58 2.86 8.48 11.56 1.44 0.08 565.43
Treatment 51 1592.89* 30.54* 1.74* 2.99* 5.35* 22.47* 11.10* 65.45* 0.81* 226.02* 459.44* 3.02* 331768.57*
Error 102 4.17 11.74 0.07 0.62 0.14 0.38 1.05 0.39 0.42 1.09 2.48 0.06 574.63
* Significance at 5 per cent
Table 2. Estimates of mean, genotypic coefficient of variance (GCV), phenotypic coefficient of variance (PCV), heritability (h2), genetic advance (GA) and genetic advance over mean (GAM) for fruit yield and its component characters in okra
S. No. Characters Mean+S.Em GCV (%) PCV (%) Heritability (%) GA GAM (%)
1 Plant height (cm) 137.38 ± 1.18 16.75 16.82 99.22 47.22 34.37
2 Stem girth (mm) 21.41 ± 1.99 11.69 19.82 34.80 3.04 14.21
3 Number of branches per plant 4.23 ± 0.15 17.37 18.40 89.07 1.45 33.78
4 Days to 50 % Flowering 55.01 ± 0.45 1.61 2.16 55.81 1.37 24.82
5 First Fruit producing node 7.53 ± 0.22 17.53 18.23 92.46 2.62 34.73
6 Fruit length (cm) 15.91 ± 0.35 17.06 17.49 95.10 5.45 34.27
7 Fruit Diameter (mm) 19.02 ± 0.59 9.62 11.03 76.15 3.29 17.30
8 Days to 80 % maturity 72.75 ± 0.37 0.49 1.02 23.41 0.36 0.49
9 Number of Fruit s per plant 39.75 ± 0.60 21.78 21.94 98.57 17.71 44.55
10 Average fruit weight (g) 24.53 ± 0.36 18.98 19.15 98.22 9.50 38.76
11 Number of Seeds per fruit 60.40 ± 0.91 20.43 20.59 98.40 25.22 41.75
12 100 Seed Weight (g) 6.00 ± 0.14 16.55 17.05 94.20 1.99 33.09
ISSN 0975-928X
Table 3. Genotypic (G) and phenotypic (P) coefficient of correlation among fruit yield and its component characters in okra
Characters Days to 50% Flowerin g Stem girth (mm) No. of branche s per plant Plant height (cm)
First Fruit producing node Fruit length (cm) Fruit Diameter (mm) No. of ridges per fruit No of locules per fruit Average fruit weight (g) Days to 80% maturit y No. of Fruit s per plant No. of Seeds per fruit 100 Seed Weight (g)
Stem girth (mm) (P) 1.68** (G) -2.18 No. of branches
per plant
(P) -0.18* 0.62** (G) -0.27 0.58
Plant height (cm) (P) 0.11 0.65** 0.19*
(G) 0.15 0.53 0.19
First Fruit producing node
(P) -0.16* 0.62** 0.46** 0.41**
(G) -0.20 0.56 0.52 0.43
Fruit length (cm) (P) -0.12 0.21** 0.13 0.10 0.02
(G) -0.17 -0.18 0.13 0.09 0.02
Fruit Diameter (mm)
(P) -0.06 0.29** -0.14 0.14 -0.17* 0.54**
(G) 0.13 -0.42 -0.21 0.16 -0.18 0.64
No. of ridges per fruit
(P) -0.03 0.40** 0.05 -0.08 -0.07 -0.13 0.16*
(G) -0.03 -0.22 0.06 -0.09 -0.07 -0.15 0.18
No of locules per fruit
(P) -0.05 0.27** -0.01 -0.29** -0.17* -0.11 0.22** 0.79**
(G) -0.05 -0.39 -0.01 -0.31 -0.19 -0.11 0.23 0.85
Average fruit weight (g)
(P) -0.12 0.44** 0.24** 0.13 0.26** 0.36** 0.23** 0.04 -0.08
(G) -0.14 0.26 0.26 0.13 0.27 0.37 0.27 0.04 -0.08
Days to 80% maturity
(P) 0.30** 3.61** -0.04 -0.09 -0.05 0.00 -0.01 -0.09 -0.01 -0.01
(G) 0.97 -6.69 -0.06 -0.20 -0.09 -0.10 -0.11 -0.25 -0.14 -0.05
No. of Fruit s per plant
(P) 0.06 0.69** 0.52** 0.50** 0.42** -0.03 -0.00 0.14 0.05 0.26** -0.04
(G) 0.09 0.74 0.55 0.51 0.44 -0.03 -0.01 0.15 0.05 0.26 -0.10
No. of Seeds per fruit
(P) -0.02 0.36** 0.05 0.17* 0.09 0.10 0.07 -0.16* -0.19* 0.25** -0.20* 0.24**
(G) -0.05 0.16 0.06 0.18 0.09 0.11 0.09 -0.17 -0.20 0.25 -0.40 0.25
100 Seed Weight (g)
(P) 0.02 0.38** 0.29** 0.22** 0.27** 0.04 -0.05 -0.34** -0.33** 0.18* 0.04 0.19* -0.03
(G) 0.07 0.09 0.30 0.23 0.29 0.05 -0.08 -0.38 -0.38 0.18 0.06 0.20 -0.03
Yield per Plant (g)
(P) -0.02 0.60 0.48 0.40 0.43 0.21 0.13 0.11 -0.02 0.77 -0.04 0.79 0.34 0.22
(G) -0.03 0.75** 0.51** 0.41** 0.45** 0.22** 0.16** 0.12 -0.02 0.78** -0.10 0.80** 0.35** 0.23**
*, ** significant at 5 and 1 per cent level, respectively
ISSN 0975-928X
ISSN 0975-928X
Genotypical Phenotypical
ISSN 0975-928X