R E S E A R C H
Open Access
SeedsGraph: an efficient assembler for
next-generation sequencing data
Chunyu Wang
1*, Maozu Guo
1*, Xiaoyan Liu
1, Yang Liu
1, Quan Zou
2From
The 4th Translational Bioinformatics Conference and the 8th International Conference on Systems
Biology (TBC/ISB 2014)
Qingdao, China. 24-27 October 2014
Abstract
DNA sequencing technology has been rapidly evolving, and produces a large number of short reads with a fast rising tendency. This has led to a resurgence of research in whole genome shotgun assembly algorithms. We start the assembly algorithm by clustering the short reads in a cloud computing framework, and the clustering process groups fragments according to their original consensus long-sequence similarity. We condense each group of reads to a chain of seeds, which is a kind of substring with reads aligned, and then build a graph accordingly. Finally, we analyze the graph to find Euler paths, and assemble the reads related in the paths into contigs, and then lay out contigs with mate-pair information for scaffolds. The result shows that our algorithm is efficient and feasible for a large set of reads such as in next-generation sequencing technology.
Introduction
The introduction of the massively parallel next-generation sequencing (NGS) technologies has caused a great increase in the number of reads typically generated by experiments. At the same time, the shorter read length from NGS and the sheer demand for more scalable assemblers have been an important computational challenge, and the genome assembly continues to represent one of the most difficult and important algorithmic problems in bioinformatics. Software technology and algorithm implementation become critical factors when dealing with terabytes of data. Cloud computing as a brand new way of dealing with an extremely large dataset offers a good chance for bioin-formatics data processing. The ability and feasibility for underlying applications have been discussed [1,2].
We design a graph-based method for the NGS reads assembly problem and implement it as a software pack-age, SeedsGraph. In the Background section, the NGS reads assembly problem and the framework for cloud computing are discussed. The Algorithm section presents
the seeds definition and the related algorithms. The result of the experiments is presented in the Result sec-tion. Then, finally, there is a discussion about the assem-bly and results in Discussion and future work.
Background
Genetic information of living organisms is stored in a chain of DNA molecules. There are four possible small molecules (also called nucleotides or bases): adenine (A), cytosine (C), guanine (G) and thymine (T). With the four-letter alphabet {A, T, G, C} we can represent the entire genetic information in strings. DNA mole-cules are denoted as a long string from the alphabet, duplicated and broken into fragments randomly for sequencing, which is also called shotgun sequencing. The whole genome shotgun (WGS) de novoassembly problem is the reconstruction of the genetic sequence information from a set of reads sequenced from the fragments. The shotgun process takes reads from ran-dom positions along a target molecule [3]. The WGSde novo assembly refers to the reconstruction in its pure form, without consultation to previously resolved sequence. For NGS data, this is a specialized problem due to the short length of reads and the large volumes of NGS data.
* Correspondence: [email protected]; [email protected] 1School of Computer Science and Technology, Harbin Institute of
Technology, No.92 West Dazhi Street, Nangang District, Harbin 150001, China
Full list of author information is available at the end of the article
Sanger sequencing or conventional sequencing has been fine tuned to achieve read lengths of up to 1,000 base pair and per-base accuracies as high as 99.999%, but the amount of data produced is relatively small in each experiment and costs are great. However, NGS achieves much higher throughput with dramatically lower cost, because of the much higher degree of paral-lelism and much smaller reaction volumes. NGS has rapidly become prevalent since 2005 in research labora-tories among companies and institutes. More and more NGS data are therefore produced and accumulated, and the demand for tools and methods for processing these data are increasing. But NGS has several fundamental limitations, especially for the assembly problem. The read length is remarkably short compared with Sanger sequencing and the number is huge. For example, the HiSeq2000 sequencer (Illumina) produces billions of 100 base pair reads with a total length of up to 600 gigabase pairs [4]. The error rates are relatively higher, and have a different distribution among the NGS technologies. The WGS overcomes these limitations by oversampling the target genome with short reads from random posi-tions. Assembly software reconstructs the target sequences.
Current assembly methods
The classical approaches for WGS de novoassembly have three steps: overlap, layout and consensus (OLC). In the first overlap step, the assembler computes all suf-fix-prefix alignments between each pair of reads, and builds a corresponding overlap graph. In the second lay-out step, the reads are nailed to the proper position based on the graph. In the last consensus step, each position in the target sequence is determined by several related reads. The OLC approach was typical in the Sanger data assemblers and was optimized for large gen-omes. There are many typical OLC software programs, such as Newbler [5], Celera Assembler [6], Arachne [7] and so forth. Besides these, there are string graph-based assemblers such as SGA [8] and Readjoiner [9], which take advantage of the FM-index and are derived from the compressed Burrows-Wheeler transform. The bot-tleneck of OLC methods is the computation of pairwise suffix-prefix alignment for the overlap graph, and it is the most time-consuming and space-consuming task.
An alternative approach is widely applied to the NGS short reads based on the de Bruijn graph, a kind of k-mer graph whose attributes make it attractive for vast quantities of short reads. The de Bruijn graph does not require the computation for all pairs of reads, but enu-merates all k-mers for every read and joins them into a path. The graph itself does not store individual reads or their overlaps, and compresses redundant sequences. There are also many typical de Bruijn graph-based
software programs, such as Velvet [10], EULER-SR [11], Abyss [12], and so forth. However, reducing short reads into even shorter units compromises the ability of dis-ambiguation of short repeats. Another disadvantage is the loss of long-range continuity information in reads.
In this paper, we present a heuristic graph-based greedy algorithm for the assembly of NGS short reads. We utilize the MapReduce framework for computation of intensive short reads overlapping work, and then cluster them into groups. The clusters are compressed into chains of seeds, and then a seeds graph is built from chains by seed overlapping. Finally, contigs are threading from the seeds graph after optimization for repeats and sequencing errors. A main advantage of building graphs by chains is that each chain in a cluster represents a valid assembly of reads. We provide the SeedsGraph package, which using the open-source implementation of a distributed programming frame-work MapReduce [13] called Hadoop [14]. The result shows that SeedsGraph is efficient and feasible for NGS data. Furthermore, SeedsGraph can use remote comput-ing services over the Internet such as the Amazon Elas-tic Compute Cloud [15].
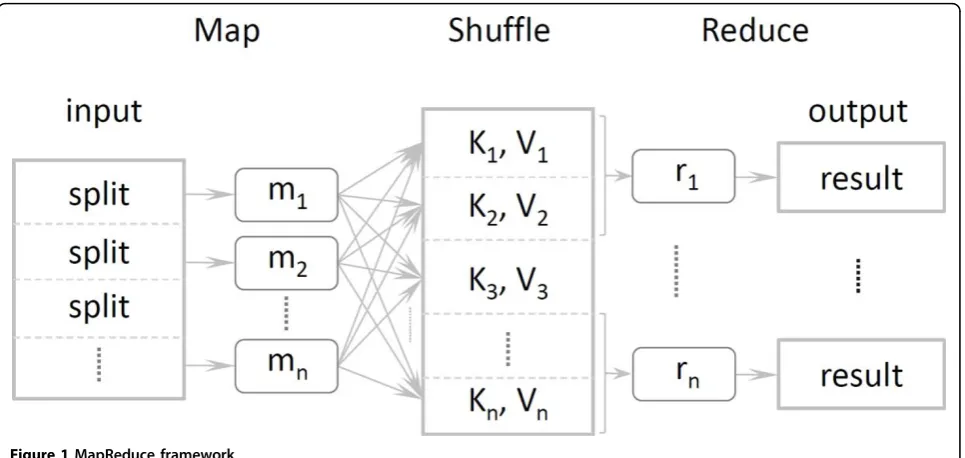
MapReduce and Hadoop
the map function in parallel on multiprocessors. Once the mappers are complete, the result tuples are shuffled by MapReduce and grouped by the keys. The result is a large distributed hash table indexed by the keys, and each key is related to a list of values. For the word count problem, every world has a list of 1s as values. The reduce function could then be any function with input of a single key and a corresponding list of values. So for the word count problem, the reduce function could just sum up all 1s into a final count result. In general, the reduce function should be commutative, since the order of the tuples is unstable and distributed across the network. The MapReduce framework ensures all tuples with the same key are transferred to same computer node and executed by the same reduce function. Each instance of the reduce function therefore executes only dependent tuple keys from the map function, and there can be as many reduce functions executing in parallel as the num-ber of keys.
In other distributed computing frameworks, the archi-tecture is more computing intensive rather than data that are stored in some specific data nodes. The com-puting nodes obtain necessary data from nodes through a high-bandwidth network. Computing nodes and data nodes are separated by network. However, MapReduce is designed for an extremely large dataset, far beyond the RAM size, even local disks, and it is not feasible for frequent network IO. Google designed a new specialized distributed Google File System (GFS) to efficiently sup-port MapReduce jobs [16]. In comparison with other distributed systems, every node in MapReduce is both for computing and for data storage. The MapReduce framework then actually moves the computing to the
data node on commodity computers; that is, the cluster. GFS is designed to provide very high-bandwidth data IO for MapReduce by replicating and partitioning files across many physical disks. When data are transferred into GFS, they are copied several times on nodes across the network, and when MapReduce starts a job, it will use local data first instead of fetching remote data.
Hadoop and the Hadoop Distributed File System (HDFS) are excellent open-source implementations of Google’s MapReduce and GFS respectively in Java and are sponsored by Amazon, Yahoo, Google, IBM, and so forth. Application developers in Hadoop need only write custom map and reduce functions in Java or any other language using Hadoop Streaming technology. The fra-mework will automatically execute them in parallel. Hadoop and HDFS are capable of managing clusters with thousands of nodes and petabytes of data. There are benchmarks showing that Hadoop is capable of a very large amount of efficient data processing.
Algorithm 1. MapReducek-mer Group Algorithm
Input:R, the set of all reads Output:K, the set ofk-mer Group 1:procedureMAP(seq, seq id)
2: for allk-mermkinseqdo//∀seq∈R
3: Emit a tuple (mk, OffsetInfo)
4: end for 5:end procedure
6:procedureREDUCE(mk, N)// N:OffsetInfoset
7: if1 <CountSeqs(N)≤tthen 8: Emit ak-mer group (mk,N) intoK
9: end if // t: the max number of reads sharing a k-mer
10:end procedure
Algorithm
In the consideration of a very large number of NGS reads, we cluster reads according to seeds, which is an approximate substring shared by reads with some extra information and will be defined properly in Definition 2. But raw reads clustering is also a space-consuming and time-consuming task, so we use the MapReduce frame-work on it. A read cluster is denoted by a chain of related seeds, which have all records about the reads in it. Then a seeds graph (Definition 4) is built based on the seeds’overlapping relationship and paired-end infor-mation, and the graph is used to direct the assembly.
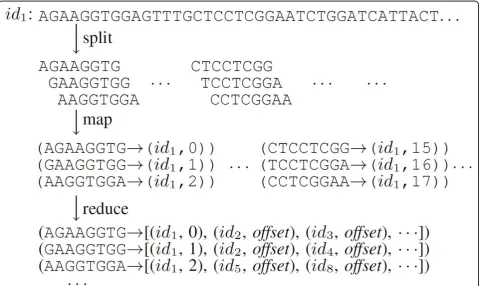
Generating thek-mer group
We employ the MapReduce framework for the genera-tion of k-mer groups used in read clustering, as detailed in Algorithm 1. The map function of MapReduce scans each part of the input sequence (that is, raw read) in R, which is the set of all reads, and emits key-value pairs in the form of (k-mer, OffsetInfo), where OffsetInfois a tuple of (seq id, offset in seq). The seq id is the sequence’s unique ID from the mapper’s input, and the offset in seq is the position of the k-mer inside the sequence. Through an iteration over the sequence, map-pers can collect all length-ksubstrings (k-mers) and off-sets (offset in seqs) (see Figure 2). The sequence is then converted into its reverse-complement form for all
reverse-complementk-mers. To distinguish from origi-nal k-mers, offset in seq of reverse complements is marked as a negative integer value. By a single run of a map function, we can obtain all k-mers and reverse-complement k-mers of a sequence. Since there is no relation between each two of reads in this step, the execution over all reads could be parallelized without any loss of accuracy. Once all mappers are completed, Hadoop would shuffle the key-value pairs, and group all values with same k-mer key into a long list, thek-mer Group, in the reduce function.
•Definition 1 (k-mer Group):A k-mer Group is a set of tuple (mk,N), where mkis ak-mer and Nis a
set of OffsetInfo, which means all sequences in N sharingmkin a specified position.
In genome data, there are many highly repeated areas, which are full of the same or similar sequences. If a k-mer is one inside these regions, its hugek-mer group is hazardous for assembly. We therefore limit the k-mer group size with a threshold t, and the reduce function will drop it automatically. The output of Algorithm 1 is a complete valid k-mer group set, denoted asK. The complexity of a map job fork-mer generating is inO (nm) time andO(4km) space, wherenis the number of reads andmis the length of a read.
Reads clustering
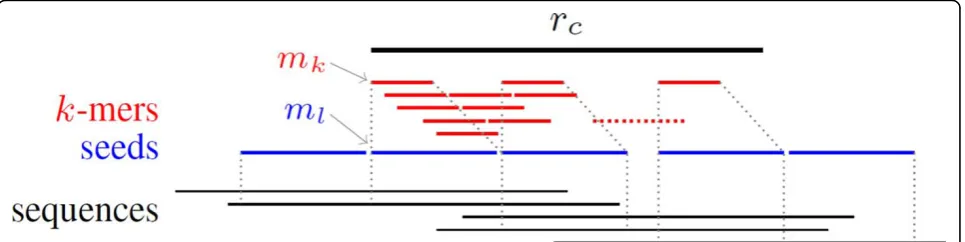
Reads clustering is the core part in this assembly package. We use clustering to eliminate the large amount of NGS reads, split reads into clusters, and denote the cluster as a series of short substrings; that is, seeds. The strategy about reads clustering detailed in Algorithm 2 is as fol-lows: take a sequence from reads randomly as a cluster center; find all sequences sharing ak-mer with the center; and validate each sequence by extendk-mer toseeds.
A cluster centerrcis randomly taken in line 3, and the
related sequences denoted by setTare gathered fromK by enumerating all k-mers ofrc in lines 5 to 8. Firstly,
we compare all reads related to allk-mers with rc. If a
read shares a block with rc with enough length, we
could just align the read with rc. The existence of
enough length could be concluded from the k-mer uniqueness discussed in [17]. Then, other reads are aligned torc by those sharingk-mer and positions.
In the next step, we extend ak-mer to an l-mer inrc,
as illustrated in Figure 3, where k <l holds, and filter out all sequences that there are more thane mismatch in l-mer compared with rc. A seed is created from the
l-mer and related sequences includingrc information.
The length oflrelies on the uniqueness of substrings of the genome, which was discussed comprehensively in [18] especially for large repetitive plant genomes. For any l where 4l exceeds twice the genome size, most l-mers should be unique [19]. We choose las a slightly smaller value for the uniqueness and error corrections.
• Definition 2 (seed):Aseedis a 4 tuple (id, ml, seq
list, next). Theid is a unique number for all seeds, the ml is al-mer which is shared by the sequences
list in seq listwhich is copied from thek-mer group. The nextis a field for the following seeds or none, and stores the next seed’sidand the distance which could be a negative value if overlapping with the fol-lowing one. If sequences have mismatch less thane, then mismatch positions is denoted in ml as ‘n’
instead of the original‘A’,‘T’,‘C’or‘G’.
For allk-mers inrc, one will check all sequences
shar-ing k-mer, but only nonoverlapping seeds will be
emitted, as detailed in lines 11 to 22. For alignment out-siderc, we use the same strategy emitting
nonoverlap-ping seeds from other sequences next to both ends of rc, as in lines 23 to 26. Because the output seeds are
ordered along the alignment in line 7, we join the seeds in achainby thenextfield.
•Definition 3 (seeds chain):A seeds chainor sim-plychainis a linked list of seeds which is a repre-sentation of a cluster centered on rc and the
alignment of related sequences.
Whereas the seeds in a chain cannot have any over-lapping in one cluster, the distance between each two consecutive seeds could be spaced, because of some nonexisting k-mers filtered out by the reduce function in Algorithm 1. When all seeds covering the alignment in line 7 are generated, we finish a candidate cluster -which is all sequences in the seeds. In the last step, if a sequence only shares a single seed with others, it is not suitable for this cluster. So we define a ration threshold h, which is the coverage of a sequence by the cluster chain, as in lines 27 to 32. If a sequence’s coverage is underh, it is removed from the cluster. Finally, the clus-ter cenclus-ter onrcis complete, and has been denoted by a
chain S that is saved into the result chain set Q. We updateRby removing the sequences of S, then iterate it overRuntil empty to finish the algorithm.
The clustering algorithm runs on Hadoop for HDFS only; the jobs are controlled by a separate job controller instead of MapReduce. Each cluster is gathered by one task in a node of the Hadoop environment, but random selection for the cluster center should be distinguished among different nodes. So we use a self-defined job con-troller to select the center sequence, then send it to a node in Hadoop for a clustering task, as in line 3. The task firstly gathers the temporary set T of necessary sequences fromRon HDFS, then saves it on HDFS in
line 9. The job controller monitors HDFS for T, and then selects another cluster center from R − T for another job. So the reads clustering algorithm runs par-allel in the Hadoop environment with the help of HDFS. For a given readrc, there are total (m−k)k-mers andnrc
related reads. The alignment of each read torcby sharing
thek-mer is inO(nrc) time, but thel-mer extension needs
O(l) andO(m) for the worst case. For the job of seeds con-struction and cover ration,O(nrc) is calculated. So the total
is inO(lnrc), and for the worst case isO(mnrc).
Seeds graph building
• Definition 4 (seeds graph): Aseeds graph G is a tuple (V,E), where Vis a vertex set andE is a edge set. The vertexes are identical with seeds generated by clustering algorithm. The edges are the union from edges in each of chain in Qand the suffix-pre-fix overlapping relation calculated from all pairs of seeds that do not belong in the same chain.
A seeds graph is essentially a l-mers overlapping graph, wherel-mers are from seeds generated by a clus-tering algorithm, but the two vertexes of overlapping edges are only from different clusters. The chain setQ is already in a seeds graph structure with vertexes and chain edges, and we only need to calculate all overlap-ping edges and updateQwith connected components. Short cluster contigs will therefore be joined together across tail seeds at both ends inside a cluster.
Thel-mers in all seeds have duplications with errors because of different clusters, so we firstly merge all seeds with the same pattern for less suffix-prefix over-lapping computation. If seeds are merged into a single seed successfully, we use the smallest seed ID as the new seed and update all error positions. This is done in Algorithm 3 lines 2 to 7. The seeds merge algorithm is trivial, but the error correction should be considered. One simply aligns reads according to the l-mer and merges reads into a single one, then recalculates the mismatch position among sequences inside thel-mer window. The merge process is also called a spectral alignment in other assemblers such as Euler [20].
In lines 8 to 13, we initialize the graphGby adding all vertexes and edges inQ. Then all overlapping edges are checked by computing the suffix-prefix alignment among all pairs of seeds in lines 14 to 18. The running time for calculation of seeds overlapping in Algorithm 3 isO(l2
). But we need to compare all pairs of seeds, so the total running time is O(n2sl2), wherensis the
num-ber of seeds.
Contigs and repeats
Using seeds instead of reads, the seeds graph construc-tion discards long-range continuity informaconstruc-tion in reads.
We repair this by threading the reads through the graph with the help of pair-end information. Actually the reads in a cluster center have already been done. Paired ends that span a repeat provide the evidence to join one chain that enters a repeat to another chain that exits the repeat (Figure 4a). A seeds graph may have several paths between nodes related to two ends of a mate pair. One path implies a putative contig, and only one of the paths implies a sequence whose length satisfies the pair-end constraint as in Figure 4b.
It is not possible to simplify all parts of the graph. So if a repeat is shorter than the cluster length or the mate-pair insert size, it is simplified as much as possible; and if not, it would be kept as original. In general, branching and convergence increases graph complexity, leading to tangles that are difficult to resolve. If a contig has been identified, all related reads will be removed from the graph. The remaining connected components would be smaller while the iterations run over the graph. Finally, contigs produced from analysis in the graph are in mate pairs for scaffolds such as in classic OLC assemblers.
Algorithm 2. Reads Clustering Algorithm
Input:RandK, the read set and thek-mer group set Output:Q, the set of chains for read clusters
1:procedureREADSCLUSTER(R, K)
2: whileR≠∅do
3: Take arc ∈Rrandomly by job control
4: T¬∅;C¬{rc}
5: for allk-mermkinrcdo
6: Merge sequences inmkgroup fromKinto T
7: AlignTtorcaccording to shared k-mers
8: end for
9: SaveT toHDFSfor next job 10: S¬∅;d¬none
11: for allk-mermkinrcdo
12: Extendmkto a longerl-mermlinrc
13: for allr∈T−Cdo
14: ifMismatch(r, ml)< ethen
15: C¬C∪{r}
16: end if
17: ifmlanddis notoverlappingthen
18: d¬Create a new seed from 19: S¬S∪{d}
20: end if
21: end for
22: end for
23: for allmlnext torc inr ∈C(r≠rc)do
24: d¬Create a new seed fromml
25: S¬S∪{d} 26: end for
27: for allsequencerinCdo 28: ifCoverRatio(r, S)< hthen
30: Removerfrom seeds in S
31: end if
32: end for 33: end while 34:end procedure
Result
The presented methods for constructing the seeds graph and the subsequent computation of contigs have been implemented in a sequence assembler named Seeds-Graph, which provides versions both on Hadoop clus-ters and on a single host.
For our benchmark, we use the single host version for comparisons. The experiments’ platform is a 64-bit Debian Linux computer with Intel Xeon E5-2620 CPU (15M cache, 2.00 GHz, six cores and 12 threads) and 64 GB RAM. We run SeedsGraph with maximum 24 threads at the same time if necessary. For SeedsGraph, the parametersK= 11 andL= 20 are used.
Algorithm 3. Seeds Graph Building Algorithm
Input:Q, the chain set for read clusters Output:G, the seeds graph
1:procedureSEEDSGRAPH(Q)
2:Sort all seeds lexicographically of each chain inQ 3:Merge seeds with the same pattern
4: for allchainaandbshare consecutive seedsdo 5: d¬Create a new chain fromaandb 6: Replacea,bwithdinQ
7: end for
8: V¬all seeds of each chain inQ;E¬∅ 9: for allchaincinQdo
10: for alleach two consecutive seedsu,vincdo 11: Add an edge (u,v) intoE
12: end for
13: end for
14: for allseedsu,vinVbut not in one chain do 15: ifOverlap(u,v)> qthen
16: Add an edge (u,v) intoE
17: end if
18: end for
19:Output G= (V,E) 20:end procedure
We chose WGS data from four deep-coverage sequen-cing projects, and took the dataset of Staphylococcus aureusandRhodobacter sphaeroidesfrom [17]. Data for S. aureusandR. sphaeroidescould be downloaded from the Sequence Read Archive at NCBI, accession numbers SRX007714 and SRX016063 [21]. The data are detailed in Table 1.
We selected another assembler, SGA [8], as a compar-ison. All methods for experiments refer to [17], but the parameters may be different from the same dataset. We run SeedsGraph on a single host instead of on a cluster for the comparisons. The resulting experimental data are detailed in Table 2.
The parameter settings are a dilemma about longer N50 and good coverage in SeedsGraph. Contig or scaf-fold N50 is a weighted median statistic such that 50% of the entire assembly is contained in contigs or scaffolds equal to or larger than this value. If we use a more stringent seeds setting, the resulting clustering will be smaller and the N50 will be shorter; and otherwise there will be lots of singleton clusters (only one read in it) that would be discarded.
Figure 4Methods to resolve graph complexity. (a) Split sharing in-path nodes by a mate-pair (b) Split sharing starting and ending nodes by a mate-pair
Table 1. Details of next-generation sequencing datasets used for experiments
Species Staphylococcus aureus
Rhodobacter sphaeroides
Size (Mb) 2.9 4.6
Read length 101 101
Insert size (base pairs)
180 180
Discussion and future work
In this paper we present methods and implementation techniques for a new clustering-based, graph-conducted assembler, named SeedsGraph, which is efficient and takes advantage of cloud computing for the large dataset of NGS data.
In the software package, we provide tools both for the Hadoop version and for the single host version assem-bler. Although the different graph-based assemblers aim at constructing the overlapping graph, they apply differ-ent heuristics to compute a layout from the graph; we also use the idea of the de Bruijn graph in the seeds graph. Our main development is about the new cluster-ing algorithm based on k-mer sharing in both the MapReduce framework and the single host platform. The necessary techniques we use are related in basic compu-ter theory about sequence processing, such as the longest common substring and so forth. The seeds graph is inspired from the de Bruijn graph in assembly short reads. We provide the software package online [22]. The Java source code for the Hadoop version and the python source code for the single host version are both available. Any comments and suggestions are welcome, and readers should feel free to contact the authors.
In the future, we will expand the performance and uti-lity spectrum of SeedsGraph on several levels. First, we will optimize the method by further improving its run-ning time and ability for larger genomes. Second, we will improve the seeds structure for better fuzzy string matching for better clustering results. Finally, additional input and output formats will be implemented in Seeds-Graph to provide support for a wide spectrum of upstream and downstream software tools and program-ming environments.
Abbreviations
GFS, Google File System; HDFS, Hadoop Distributed File System; NGS, next-generation sequencing; OLC, overlap, layout and consensus; WGS, whole genome shotgun.
Competing interests
The authors declare that they have no competing interests.
Authors’contributions
All authors had made substantial contributions to conception and design, or analysis and interpretation of data. CW detailed the algorithms and programs, and drafted the manuscript. MG and QZ contributed to project design and involved in drafting the manuscript. XL and YL assisted in the analysis and data acquisition. All authors approved the final manuscript.
Acknowledgements
Publication of this article has been funded by the following authors’funding supports. CW is supported by the Natural Science Foundation of China (61402132). MG is supported by the Natural Science Foundation of China (61271346), the Specialised Research Fund for the Doctoral Program of Higher Education of China (20112302110040) and the Fundamental Research Funds for the Central Universities (HIT.KISTP.201418). XL is supported by the Natural Science Foundation of China (61172098 and 91335112). QZ is supported by the Natural Science Foundation of China (61370010). This article has been published as part ofBMC Medical GenomicsVolume 8 Supplement 2, 2015: Selected articles from the 4th Translational
Bioinformatics Conference and the 8th International Conference on Systems Biology (TBC/ISB 2014). The full contents of the supplement are available online at http://www.biomedcentral.com/bmcmedgenomics/ supplements/8/S2.
Authors’details
1School of Computer Science and Technology, Harbin Institute of
Technology, No.92 West Dazhi Street, Nangang District, Harbin 150001, China.2Department of Computer Science, Xiamen University, No.422, Siming South Road, Xiamen 361005, China.
Published: 29 May 2015
References
1. Bateman A, Wood M:Cloud computing.Bioinformatics2009,25:1475-1475. 2. Stein LD, others:The case for cloud computing in genome informatics.
Genome Biol2010,11:207-14.
3. Sanger F, Coulson AR, Barrell BG, Smith AJ, Roe BA:Cloning in single-stranded bacteriophage as an aid to rapid DNA sequencing.J Mol Biol
1980,1432:161-78.
4. Illumina sequencing - performance and specifications for hiseq 2000.
[http://www.illumina.com.cn/support/sequencing/sequencinginstruments/ hiseq 2000.aspx], accessed 12 May 2014.
5. Margulies M, Egholm M, Altman WE, Attiya S, Bader JS, Bemben LA,et al:
Genome sequencing in microfabricated high-density picolitre reactors. Nature2005,437:376-80, doi:10.1038/nature03959.
6. Myers EW, Sutton GG, Delcher AL, Dew IM, Fasulo DP, Flanigan MJ,et al:A whole-genome assembly of drosophila.Science2000,287:2196-204, doi:10.1126/science.287.5461.2196.
7. Batzoglou S, Jaffe DB, Stanley K, J Butler, Gnerre S, Mauceli E,et al:
ARACHNE: a whole-genome shotgun assembler.Genome Res2002,
12:177-89, doi:10.1101/gr.208902.
8. Simpson JT, Durbin R:Efficient de novo assembly of large genomes using compressed data structures.Genome Res2012,22:549-56, doi:10.1101/ gr.126953.111.
9. Gonnella G, Kurtz S:Readjoiner: a fast and memory efficient string graph-based sequence assembler.BMC Bioinformatics2012,13:82-101, doi:10.1186/1471-2105-13-82.
10. Zerbino DR, Birney E:Velvet: algorithms for de novo short read assembly using de bruijn graphs.Genome Res2008,18:821-9, doi:10.1101/ gr.074492.107.
11. Chaisson MJ, Pevzner PA:Short read fragment assembly of bacterial genomes.Genome Res2008,18:324-30, doi:10.1101/gr.7088808. 12. Simpson JT, Wong K, Jackman SD, Schein JE, Jones SJ, Birol I:ABySS: a
parallel assembler for short read sequence data.Genome Res2009,
19:1117-23, doi:10.1101/gr.089532.108.
13. Dean J, Ghemawat S:MapReduce: Simplified Data Processing on Large Clusters.Commun ACM2008,51:107-113.
14. Apache Hadoop.[http://hadoop.apache.org], 13 May 2014.
15. Amazon Elastic Compute Cloud (Amazon EC2).[http://aws.amazon.com/ ec2/], 17 May 2014.
16. Ghemawat S, Gobioff H, Leung S-T:The Google file system.SIGOPS Oper Syst Rev2003,37:29-43.
Table 2. Assembly result of next-generation sequencing data forStaphylococcus aureusandRhodobacter sphaeroides
Dataset Staphylococcus aureus
Rhodobacter sphaeroides
SGA[8] SeedsGraph SGA[8] SeedsGraph
Number of contigs 274 754 3,067 7,033
N50 of contigs (kb) 24 43 27 42
Number of scaffolds 122 323 2096 4291
N50 of scaffolds (kb) 205 174 95 46
17. SL Salzberg, AM Phillippy, A Zimin, D Puiu, T Magoc, S Koren,et al:GAGE: a critical evaluation of genome assemblies and assembly algorithms. Genome Res2012,22:557-67, doi:10.1101/gr.131383.111.
18. Kurtz S, Narechania A, Stein JC, Ware D:A new method to compute k-mer frequencies and its application to annotate large repetitive plant genomes.BMC Genomics2008,9:517-35, doi:10.1186/1471-2164-9-517. 19. Miller JR, Koren S, Sutton G:Assembly algorithms for next-generation
sequencing data.Genomics2010,95:315-27, doi:10.1016/j. ygeno.2010.03.001.
20. Pevzner PA, Tang H, Waterman MS:An eulerian path approach to DNA fragment assembly.Proc Natl Acad Sci USA2001,98:9748-53, doi:10.1073/ pnas.171285098.
21. Leinonen R, Sugawara H, Shumway M:The Sequence Read Archive. Nucleic Acids Res2011,39(Database):D19-D21.
22. SeedsGraph assembler.[http://nclab.hit.edu.cn/~chunyu/seedsgraph], 30 Jun 2014.
doi:10.1186/1755-8794-8-S2-S13
Cite this article as:Wanget al.:SeedsGraph: an efficient assembler for next-generation sequencing data.BMC Medical Genomics20158(Suppl 2): S13.
Submit your next manuscript to BioMed Central and take full advantage of:
• Convenient online submission
• Thorough peer review
• No space constraints or color figure charges
• Immediate publication on acceptance
• Inclusion in PubMed, CAS, Scopus and Google Scholar
• Research which is freely available for redistribution