R E V I E W
Open Access
Utilization of the oncoscan microarray
assay in cancer diagnostics
Hou-Sung Jung
1,2, Joel A. Lefferts
1and Gregory J. Tsongalis
1,2*Abstract
Current strategies for cancer patient management include the use of genomic and proteomic test results to help guide therapeutic selection. The need for multi-target variant analysis is highlighted by the growing number of novel therapies to treat tumors with specific profiles and the increasing recognition that cancer is an extremely heterogeneous syndrome. Microarray analysis is a powerful genomic tool that provides genome-wide genetic information that is critical for guiding cancer treatments. Unlike constitutional applications of microarray analysis which are performed on whole blood samples, microarray analysis of solid tumors is challenging because tumor tissues are typically formalin fixed and paraffin embedded (FFPE). Genomic DNA extracted from FFPE tissues can also be fragmented into small pieces and yield much lower
concentrations of DNA. We validated and implemented the Affymetrix OncoScan® FFPE assay to enable genome-wide analysis from these types of samples. The Affymetrix OncoScan® assay utilizes molecular inversion probes that generate multiplexed array hybridization targets from as short as 40 base-pairs of sequence and as low as approximately 80 ng of genomic DNA. OncoScan microarray analysis provides genomic information that includes structural variations, copy number variations and SNPs in a timely and a cost-effective manner from FFPE tumor tissues.
Keywords:Cancer, Copy number variation, Somatic mutation, OncoScan, Molecular Inversion Probes (MIPs)
Background
Cancer is a polygenic and multifactorial genetic syndrome characterized by many different forms of molecular vari-ants including somatic mutations and copy number varia-tions (CNVs) [1]. Identification of CNVs and somatic mutations are critical for determining diagnosis, prognosis and therapeutic selection for any given patient.
Chromosomal microarray analysis (CMA) enables simultaneous detection of variations in cancers at a genome-wide level, compared to detection of a limited number of genes and gene variants by fluorescence in situ hybridization (FISH), realtime-PCR, and Sanger sequen-cing [2, 3]. CMA can be divided into two major categories [2]: first is a two-color experiment also referred to as array Comparative Genomic Hybridization (aCGH), in which patient and normal samples are differentially labeled and hybridized to probes on a single microarray, and second is a one-color experiment also known as single nucleotide polymorphism (SNP)-based microarray or SNP-array in
which instead of including a control sample as a reference in every run, reference intensity data has been built from a population of normal samples and used as a reference for the patient sample [4]. The two-color analysis generates results as a signal ratio, while most of the one-color assays provide absolute signal intensity information [2]. The aCGH consists of CNV probes, while SNP-arrays have mainly SNP probes. While the CNV probes provide only CNV information, SNP-arrays generate both SNP genotype and CNV information using the signal intensity to generate CNV information [5, 6]. The combined use of CNV and SNP probes is ideal for maximal coverage and high resolution in detection of these variants [5].
Genome-wide analysis for human cancers is technic-ally challenging due to several inherent variables with the sample type [7]. DNA extraction from solid tumor tissues in the clinical setting usually requires methods for nucleic acids to be extracted from formalin-fixed, paraffin-embedded (FFPE) samples. These sample types result in genomic DNA (gDNA) which is degraded into smaller fragments. In addition, the yield of extracted gDNA may be low due to the amount of starting material available, especially in biopsy specimens. A * Correspondence:[email protected]
1Department of Pathology and Laboratory Medicine, Geisel School of
Medicine at Dartmouth, Hanover, NH 03755, USA
2Dartmouth-Hitchcock Medical Center and Norris Cotton Cancer Center,
Lebanon, NH 03756, USA
confounding biological variable is the cellular heterogen-eity of tumor tissues where there is a presence of normal cells whose DNA could dilute out that of the tumor cells. A robust microarray assay should be applicable to low quantity and quality of gDNA and have analytical tools to discern information from cancer cells versus that of normal cells.
To overcome these obstacles, microarray protocols can be modified to accommodate FFPE tumor speci-mens [8]. Among them, the OncoScan® FFPE Assay Kit (Affymetrix, a Thermo Fisher Scientific company) is the first microarray designed specifically for use with degraded DNA as is found in FFPE tissue. The Oncos-can array utilizes SNP probes to provide copy number as well as allele frequency information [8–10]. Here we discuss utilization and implementation of the OncoScan microarray, including generation of targets from gDNA prepared from FFPE samples, microarray hybridization, data analysis, and quality control.
The OncoScan® FFPE assay
The OncoScan assay is an accepted cancer diagnostic microarray for detection of CNVs, loss of heterozygosity (LOH), and cancer-related somatic mutations [11]. The OncoScan array allows genomic analysis of almost all sam-ple types regardless of source and samsam-ple age [6, 12, 13]. Previously these types of samples were cumbersome with other genomic assays owing to poor quality and quantity of extracted gDNA. The OncoScan assay, however, incorpo-rates unique ways of target generation, array hybridization, and data analysis, which make the assay significantly less dependent on gDNA quality and quantity.
Quantification of gDNA sample
Following gDNA extraction from FFPE samples, a critical quality assurance metric is to accurately quantify concentrations of nucleic acid. Coming from FFPE tissue, these gDNA samples are likely to be fragmented into smaller pieces and possibly contaminated with other nucleotides and RNA. Because of this, DNA specific quantification methods using fluorescent dyes should be used instead of the more common absorbance spectro-photometric methods [14]. Quantitative PCR (qPCR) may be an even more accurate way to quantify FFPE-extracted gDNA despite taking longer time than the fluorescent dye method [14]. In our experience quantifi-cation of gDNA by qPCR showed better correlation with probe amplification rates than that of the dye methods.
Molecular inversion probe technology
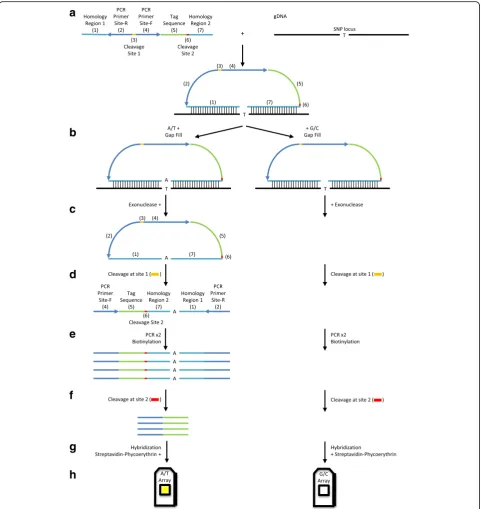
The OncoScan microarray has incorporated the Molecular Inversion Probe (MIP) technology to generate targets, which hybridize to probes on the OncoScan microarray. gDNA is hybridized for 16–18 h with CNV and somatic
mutation probe mixes (Fig. 1a). While 80 ng gDNA is rec-ommended by the manufacturer, our data suggests using quantities of FFPE-extracted gDNA as low as 30 ng will generate excellent data. Others have reported using much less than that amount of gDNA while still able to produce high-quality results [10].
Each MIP probe has two homology regions for hybridization to a gDNA target region with a gap in between them (Fig. 1a) [15]. Each homology region is 20 base-pairs long; hence, the probe set can hybridize frag-mented gDNA as short as 40 base-pairs [16]. This feature makes MIP less dependent on high-quality of gDNA compared to other genomic technologies that require relatively longer intact gDNA. Directions of the homology regions in the probe are designed to generate an incomplete circular form between the gDNA target and the probe.
Following the overnight hybridization, the incomplete circular probe and gDNA mixes are equally divided into two tubes (Fig. 1b) [16]. To each tube, a mix of A and T nucleotides or a mix of G and C nucleotides is added to fill the gap. Depending on the nucleotide in the gap, a group of probes will be present in the completed circular form, while other probes will remain as incomplete cir-cular forms. Exonucleases, which are specific for linear DNA, digest excess probes as well as incomplete circular forms of probes, and gDNA (Fig. 1c). Following the digestion step, there are two tubes per sample and each of the tubes harbors circular forms of probes, which have been gap-filled either with A/T or G/C.
Within the probe, there are two cleavage sites, and a set of PCR primer sites (Fig. 1a) [15]. A mix of cleavage enzymes recognizes one of the cleavage sites to generate a linear form of the probe from the circular form (Fig. 1d). A significant difference between the unpro-cessed and prounpro-cessed (gap-filled) probes is the direction of PCR priming sites (Fig. 1a and d). In the unprocessed probes, PCR priming sites face outward and away from each other; therefore, no PCR products are amplified. In contrast, PCR products are amplified from gap-filled and cleaved probes because these processes make the PCR priming sites face each other (Fig. 1e). This inversion of PCR priming sites makes MIP unique because it provides greater selectivity for amplification of desired targets. In addition, the primer sequences are designed for optimal amplification in terms of priming temperature and secondary structure without non-specific amplification from gDNA sequences.
artificial DNA fragment and assigned to a specific gDNA target according to a specific homology region in a probe. Thus, the tag sequences are unique to the assigned genomic DNA region. The tag sequences are the only part involved in the hybridization to targets on
minimal cross-hybridization in the array procedure to increase the efficiency of the assay (Fig. 1g). During PCR, biotin-labeled nucleotides are incorporated into the product (Fig. 1e). Following hybridization, the biotin is bound by phycoerythrin through serial staining of a streptavidin-phycoerythrin conjugate and an anti-streptavidin biotinylated antibody (Fig. 1g). Phycoeryth-rin fluorescence signal is recorded by the Affymetrix GeneChip®Scanner (Fig. 1h).
The OncoScan assay is designed to utilize two micro-arrays per sample [16]. In the gap filling step, mixtures
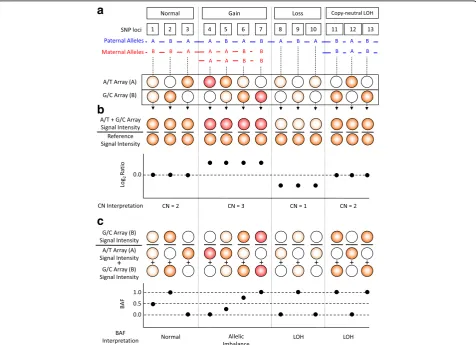
of probe and gDNA duplexes are divided into two reactions for A/T- and G/C-gap filling. These two reac-tion products are individually hybridized in two separate reactions but to the same microarray (Fig. 2a). Original OncoScan assays had been designed to use four individ-ual nucleotides in the gap filling and four microarrays to determine genotypes at all SNPs [6, 15]. With the loss of detecting A-to-T and G-to-C SNPs of CNV probes, the number of gap filling reactions and microarrays has been reduced to two. Now OncoScan assays detect A/T-to-G/C SNPs (A-to-G, A-to-C, T-to-G, and T-to-C), which
comprise 85% of human SNPs [16]. If there are hybridization signals from both arrays, it indicates that it is heterozygous for an SNP position (Fig. 2a). If there are hybridization signals only from one array and not from the other, it reflects that it is homozygous for the SNP position. To obtain allelic information, the OncoScan assay assigns the A/T array as the major allele and the G/C array as the minor allele.
The OncoScan assay utilizes 335,000 probes for CNVs and allele frequencies, and 541 probes for cancer som-atic mutations [10]. Scanning takes approximately 7 min per microarray or 14 min per sample. The entire testing process is completed within 48 h. Scanning generates DAT files, and the Affymetrix GeneChip Command Console software converts them to CEL files [11]. The DAT files are scanned array probe imaging files, and the CEL files are array fluorescence intensity files. The CEL files are then used for data analysis.
Data analysis
The OncoScan analysis procedure includes obtaining data stored in CEL files, signal normalization, deter-mination of CNVs, calculation of the B-allele fre-quency (BAF), detection of LOH, and identification of somatic mutations.
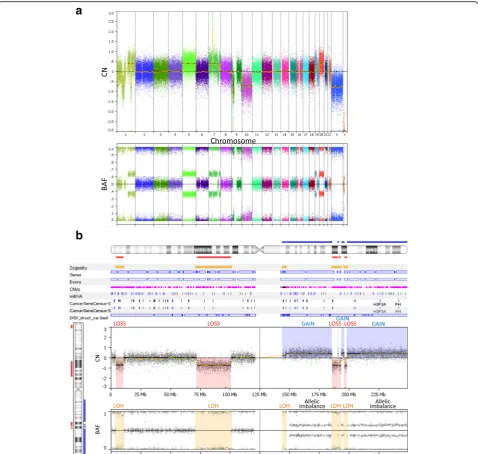
The OncoScan microarray is an SNP-array and its performance was optimized as a one-color microarray experiment [2, 16]. Using the SNP-array, only a single patient’s gDNA sample is processed and hybridized to the probe sets on the microarray. A reference signal data from a normal population is required, and the OncoScan uses a reference data set from 400 normal FFPE samples of various sources including different geographic locations, genders, age groups, and tissue types [17]. CNVs are computationally detected by dividing the normalized signal intensity of the sample by that of the reference data [4]. The computation is displayed as the base 2 logarithm of the quotient of the division (Fig. 2b and Fig. 3).
If gDNA were extracted from either pure cancer or pure normal cells, the data analysis would be more straightforward. However, in almost all tissue samples, normal cells are present adjacent to cancer cells, from which DNA may also be extracted; therefore CNV estimation is challenging. To overcome this issue, OncoScan has employed the Tumor Scan™ (TuScan™) algorithm. If a sample consists of pure cancer or normal cells, TuScan™ returns an output of“homogeneous”and it can be interpreted as either 100% cancer or 100% nor-mal cells based on the CNV results [11]. If cancer cells constitute the majority of the sample compared to nor-mal cells, e.g., if cancer cells are nearly homogeneous, the TuScan™ algorithm subtracts the normal cell data from the CNV estimation and calculates CNV only in
the tumor component as an integer number (e.g., CN = 2) with a burden of cancer as the percentage of aberration (%AC) [11, 18]. Because the integer number is only from cancer cells, CNVs between samples can be compared regardless of different amounts of normal cells. If samples are too heterogeneous, so that it is not feasible for the TuScan™algorithm to isolate cancer cell information from normal, %AC is reported as“NA”and the algorithm calcu-lates average CNV of all cells in the sample, and provides CNV as a value with two decimal digits of 0.33 increments (e.g., 2, 2.33, 2.66, etc.) [17, 19].
BAF is calculated by dividing the number of minor (B) alleles by the sum of major (A) and minor (B) alleles [20]. OncoScan generates allelic information. A/T is assigned to the major allele (A), and G/C is considered the minor allele (B) (Fig. 2c). Thus, if there are signals only at the probe in the A/T array, BAF at a probe position equals 0. If there are signals only at the probe in the G/C array, BAF is 1. BAF of 0.5 is obtained if there are signals in both A/T and G/C arrays at the probe position. For each probe position of normal cells, a BAF value is given as one of these three (Fig. 2c and Fig. 3).
When the values are displayed across an entire chromosome, they appear as three tracks (Fig. 3). Be-cause each allele is from one of two biological parents, the chances of AA, BB, and AB genotypes are equal. If patients acquire additional chromosomes or segments, the BAF would have more than three tracks; for example, four tracks would indicate allelic imbalance (Fig. 2c and Fig. 3b). If a patient loses a segment of chromosome, alleles are either A or B in the absence of AB so that the BAF is either 0 or 1; therefore, probes are distributed into two categories, which are displayed as two tracks. This phenomenon is called LOH (Fig. 2c and Fig. 3b). The two-track cases, however, are observed only if cancer cells are homogeneous. Otherwise LOH shows four tracks. It is possible that two chromosomes come from a single parent. In this case, it looks normal as the copy number is 2; however, the BAF shows LOH because these chromosome regions are identical. This is called copy-neutral LOH (Fig. 2c). Taken together, combined analysis of CNV and BAF provides more in-formation than CNV alone [20].
Quality control
OncoScan analysis has numerous quality control (QC) metrics, some of which were developed and are being used for previous versions of array platforms. Major QC metrics include the Median of the Absolute values of all Pairwise Differences between log2 ratios
genotyping data is reflected by ndSNPQC, which is calcu-lated by measuring distances between each genotype. High ndSNPQC values indicate better identification of each genotype and hence superior BAF results.
In addition several unique QC metrics for OncoS-can are introduced [19]. One of them is the Cel-PairCheck Status. OncoScan microarray analysis utilizes two chips per sample; therefore, each sample generates two data files (e.g., one CEL file from the A/T nucleotide-gap filling reaction and the other file from the G/C nucleotide-gap filling reaction). Cel-PariCheck examines whether these two data sets are generated from the identical sample using genotypes of Signature SNPs incorporated into the microarrays. If samples pass this QC test, there is no chance of mispairing; otherwise, mispairing among samples and/or data could have occurred. In addition, the metric also determines assignment of AT or GC channel results to its corresponding gap filling reac-tion, and shows error messages if channels are not properly assigned.
Clinical applications
OncoScan microarray analysis is deepening our understanding of genetic variations in cancer. Re-cently, in a renal carcinoma, OncoScan results showed novel detection of copy-neutral LOH that had been unavailable from previous diagnostic methods including aCGH [9]. In a breast cancer, CNV
detec-tion by OncoScan was tested as a recurrence
biomarker [21]. In glioma, it was demonstrated that OncoScan results could aide in detecting additional genome-wide alteration such as gene amplifications and rearrangements [3]. Our laboratory has validated the OncoScan microarray as an additional tool for the assessment of human cancers. The ability to detect CNVs and SNPs has resulted in replacement of FISH based assays for certain tumor types and targets.
Future directions
In an era of next generation sequencing (NGS) technol-ogy which is widely used to detect somatic variations such as SNPs and indels, most NGS assays focus on targeted gene panels. To date NGS technologies have had significant limitations with respect to CNV detec-tion compared to microarray technologies [8, 23, 24]. Advances in NGS chemistries and analytics tools could make NGS and microarray technologies very comple-mentary and increase the number of variants detected in human cancers [22, 24].
CNVs in most cases are interpreted as resulting in gene expression level changes; gene overexpression can be observed if the gene is located in a region of gain, while lower or no gene expression can be observed if the
gene is in a region of loss [25]. Gene expression profiling could identify involved genes within large gain regions; however, there could be discrepancies between the degree of structural variation and gene expression levels [1, 26, 27]. Gene expression profiling has discovered novel cancer genes whose induction mechanisms are independent of CNVs [27]. It may be that, for more accurate cancer assessment, combined analysis of the OncoScan results with whole exon expression profiling or targeted RNA quantification would be a more ideal approach.
Conclusions
OncoScan microarray analysis is a reliable assay to assess human cancers for genome-wide copy number changes. This assay circumvents previous obstacles by combining a unique target generation system with microarrays so that almost all types of solid cancer samples can be analyzed in less than 48 h. The analysis software is robust and user-friendly. Reso-lution and somatic mutation detection could be fur-ther enhanced by including additional CNV and somatic mutation probes. The ability to detect and accurately define regions of variation across the genome will continue to be an important aspect of precision medicine efforts.
Abbreviations
aCGH:array Comparative Genomic Hybridization; CMA: Chromosomal microarray analysis; CNVs: Copy number variations; FISH: Fluorescence in situ hybridization; gDNA: genomic DNA; SNP: Single nucleotide polymorphism
Acknowledgements
The authors wish to thank the staff of the Laboratory for Clinical Genomics and Advanced Technology (CGAT). The data presented in this manuscript was in part generated through CGAT in the Department of Pathology and Laboratory Medicine of the Geisel School of Medicine at Dartmouth, the Dartmouth Hitchcock Medical Center and the Norris Cotton Cancer Center.
Funding
Funding for this manuscript was provided by the Laboratory for Clinical Genomics and Advanced Technology (CGAT) in the Department of Pathology and Laboratory Medicine at the Dartmouth Hitchcock Medical Center, Lebanon, NH, USA.
Availability of data and materials
Not applicable.
Authors’contributions
HSJ has performed the Oncoscan microarray wet bench work and participated in the writing of this review. JAL performed the Oncoscan data analysis and edited this manuscript. GJT conceived this review, participated in the design and writing of this review and coordinated the resources to produce tis manuscript. All authors read and approved the final manuscript.
Competing interests
The authors declared that they have no competing interests.
Consent for publication
Not applicable.
Ethics approval and consent to participate
Received: 14 April 2016 Accepted: 16 December 2016
References
1. Ciriello G, Miller ML, Aksoy BA, Senbabaoglu Y, Schultz N, Sander C. Emerging landscape of oncogenic signatures across human cancers. Nat Genet. 2013;45:1127–33.
2. Gresham D, Dunham MJ, Botstein D. Comparing whole genomes using DNA microarrays. Nat Rev Genet. 2008;9:291–302.
3. Paxton CN, Rowe LR, South ST. Observation of the genomic landscape beyond 1p19q deletions and EGFR amplification in glioma. Mol Cytogenet. 2015;8:60.
4. Coughlin II CR, Scharer GH, Shaikh TH. Clinical impact of copy number variation analysis using high-resolution microarray technologies: advantages, limitations and concerns. Genome Med. 2012;4:80.
5. Carter NP. Methods and strategies for analyzing copy number variation using DNA microarrays. Nat Genet. 2007;39:S16–21.
6. Wang Y, Moorhead M, Karlin-Neumann G, Falkowski M, Chen C, et al. Allele quantification using molecular inversion probes (MIP). Nucleic Acids Res. 2005;33:e183.
7. Liang CW, Lee YS, Marino-Enriquez A, Tsui K, Huang SH. The utility and limitation of single nucleotide polymorphism analysis on whole genome amplified mesenchymal tumour DNA in formalin fixed tumour samples. Pathology. 2012;44:33–41.
8. Krijgsman O, Israeli D, Haan JC, van Essen HF, Smeets SJ, Eijk PP, et al. CGH arrays compared for DNA isolated from formalin-fixed, paraffin-embedded material. Genes Chromosomes Cancer. 2012;51:344–52.
9. Alexiev BA, Zou YS. Clear cell papillary renal cell carcinoma: A chromosomal microarray analysis for two cases using a novel Molecular Inversion Probe (MIP) technology. Pathol Res Pract. 2014;210:1049–53.
10. Wang Y, Cottman M, Schiffman JD. Molecular inversion probes: a novel microarray technology and its application in cancer research. Cancer Genet. 2012;205:341–55.
11. Foster JM, Oumie A, Togneri FS, Vasques FR, Hau D, Taylor M, et al. Cross-laboratory validation of the OncoScan®FFPE assay, a multiplex tool for whole genome tumour profiling. BMC Med Genomics. 2015;8:5. 12. Rowe LR, Thaker HM, Opitz JM, Schiffman JD, Haddadin ZM, Erickson LK,
et al. Molecular inversion probe array for the genetic evaluation of stillbirth using formalin-fixed, paraffin-embedded tissue. J Mol Diagn. 2013;15:466–72. 13. Wang Y, Carlton VE, Karlin-Neumann G, Sapolsky R, Zhang L, Moorhead M,
et al. High quality copy number and genotype data from FFPE samples using Molecular Inversion Probe (MIP) microarrays. BMC Med Genomics. 2009;2:8.
14. Nakayama Y, Yamaguchi H, Einaga N, Esumi M. Pitfalls of DNA quantification using DNA-binding fluorescent dyes and suggested solutions. PLoS One. 2016;doi: 10.1371/journal.pone.0150528.
15. Hardenbol P, Banér J, Jain M, Nilsson M, Namsaraev EA, Karlin-Neumann GA, et al. Multiplexed genotyping with sequence-tagged molecular inversion probes. Nat Biotechnol. 2003;21:673–8.
16. Wang Y, Moorhead M, Karlin-Neumann G, Wang NJ, Ireland J, Lin S, et al. Analysis of molecular inversion probe performance for allele copy number determination. Genome Biol. 2007;8:R246.
17. Schmidt J, Liu B, Ghent M, Bolstad B, Siddiqui F, D. Abdueva D, et al. A new method for high fidelity copy number analysis in solid tumor samples and its implementation in the OncoScan™FFPE assay kit. American Society of Human Genetics. 2014. http://www.ashg.org/2014meeting/abstracts/fulltext/ f140122485.htm. Accessed 1 March 2016.
18. Van Loo P, Nordgard SH, Lingjærde OC, Russnes HG, Rye IH, Sun W, et al. Allele-specific copy number analysis of tumors. Proc Natl Acad Sci USA. 2010;107:16910–5.
19. Affymetrix® UserGuide OncoScan™Console 1.3. P/N 703195 Rev. 4. 20. Alkan C, Coe BP, Eichler EE. Genome structural variation discovery and
genotyping. Nat Rev Genet. 2011;12:363–76.
21. Gorringe KL, Hunter SM, Pang JM, Opeskin K, Hill P, Rowley SM, et al. Copy number analysis of ductal carcinoma in situ with and without recurrence. Mod Pathol. 2015;28:1174–84.
22. Hardiman KM, Ulintz PJ, Kuick RD, Hovelson DH, Gates CM, Bhasi A, et al. Intra-tumor genetic heterogeneity in rectal cancer. Lab Invest. 2016;96:4–15. 23. Gray PN, Dunlop CL, Elliott AM. Not all next generation sequencing
diagnostics are created equal: Understanding the nuances of solid tumor assay design for somatic mutation detection. Cancers. 2015;7:1313–32.
24. Mukherjee S, Ma Z, Wheeler S, Sathanoori M, Coldren C, Prescott JL, et al. Chromosomal microarray provides enhanced targetable gene aberration detection when paired with next generation sequencing panel in profiling lung and colorectal tumors. Cancer Genet. 2016;doi:10.1016/j.cancergen. 2015.12.011.
25. Smeets SJ, Harjes U, van Wieringen WN, Sie D, Brakenhoff RH, Meijer GA, et al. To DNA or not to DNA? That is the question, when it comes to molecular subtyping for the clinic! Clin Cancer Res. 2011;17:4959–64. 26. Ali Hassan NZ, Mokhtar NM, Kok Sin T, Mohamed Rose I, Sagap I, Harun
R, et al. Integrated analysis of copy number variation and genome-wide expression profiling in colorectal cancer tissues. PLoS One.
2014;9:e92553.
27. Thomas LE, Winston J, Rad E, Mort M, Dodd KM, Tee AR, et al. Evaluation of copy number variation and gene expression in neurofibromatosis type-1-associated malignant peripheral nerve sheath tumors. Hum Genomics. 2015;9:3.
• We accept pre-submission inquiries
• Our selector tool helps you to find the most relevant journal • We provide round the clock customer support
• Convenient online submission • Thorough peer review
• Inclusion in PubMed and all major indexing services • Maximum visibility for your research
Submit your manuscript at www.biomedcentral.com/submit