A Practical Desalinization Model for Large Scale Application
S. Asadi kapourchal1*1; M. Homaee2 ; E. Pazira1
1: Department of soil science, Science and Research Branch, Islamic Azad University, Tehran, Iran
2: Department of soil science, Tarbiat Modares University, Tehran, Iran
Received: January, 14, 2011 Accepted: March, 15, 2011
ABSTRACT
Salinity of soil and water is the most important agricultural hazard in arid and semi-arid regions. In saline soils, yield production directly influences by soluble salts in the root zone as well as by shallow water table depth. The first step for reclamation of such soils is reducing salinity to optimum level by leaching. The objective of this study was to develop a practical model to estimate water requirement for reclamation of saline-sodic soils at large scale based on some obtainable soil physical characteristics. Consequently, a large area of 3,216 ha with S4A3 salinity/sodicity class (extreme salinity and sodicity) was selected to obtain the required data. Several mathematical models were applied to the collected data to verify their estimation capability. The results indicated that at large scale, the proposed logarithmic model can provide much better estimates for leaching process than the previously proposed models.
Keywords:Desalinization; Reclamation requirement; Saline-sodic soils; Salt leaching
INTRODUCTION
Large areas in arid and semi-arid regions are imposed to salinity or both salinity and sodicity. From water consuming point of view, the saline or saline-sodic soil needs more irrigation water to produce reasonable agricultural products. Unfortunately, enough water is not always available in such areas. Considering the poor quality and improper use of water for agriculture, salinity has caused gradual reduction in soil quality of these regions.
It is obvious that soil and water salinities are the main limiting factors affecting crop production in arid and semi-arid regions. This may lead to an extra yield reduction when coupled with water scarcity (Homaee & Schmidhaiter, 2008; Homaee et al., 2002). In arid and semi-arid areas of Iran, the main reason for salt accumulation in soils is water scarcity (Pazira & Homaee, 2010). Low annual precipitation in these regions is far less than what is needed to leach out the excess salts from soil profile. Consequently, most soils in these areas have the potential to tend to salinity or to both salinity and sodicity. However, salinization may also result from presence of high amount of salts contained in the parent materials from which the soils are formed (Pazira & Homaee, 2010). A reasonable crop production in these soils can only be obtained after desalinization practices. The most practical method for soil desalinization is salt leaching by application of water either with or without soil amendments. This can be achieved by applying enough water on soil surface to infiltrate into subsurface drains or to deeper soil layers (Pazira & Homaee, 2010).
Although numerous research have been conducted to investigate different aspects of soil salinity (Corwin et al., 2007; Ben-Gal et al., 2008; Cote et al., 2000; Konukcu et al., 2006; Homaee & Schmidhalter, 2008; Homaee et al., 2002 a. b. c. d), most of them are related to plant responses to salinity rather than desalinization process (Pazira & Homaee, 2010; Hendrikus Barnard et al., 2010).
Although the inevitable way of soil desalinization is salt leaching from the root zone, practically considerable amount of water is required to leach out excess salts from the root zone. If the natural soil drainage condition is not suitable, applying such amount of water will build up more salinity, unless a subsurface drainage system is established. To assess soil desalinization, one may conduct a set of experiments in laboratory by using some physical models, but the application of results obtained from such experiments in field scale is difficult. Consequently, conducting field desalinization experiments are still needed to fulfill the natural requirements (jurinak, 1981).
In saline soils, plant response to salinity directly influences by salt contents within the root zone as well as by water table depth. Soil desalinization not only depends on quantity of applied leaching water, but also strongly related to its quality as well as to internal soil drainage conditions. Even after initial/capital leaching and when the soil is under cultivation, some more extra water than the plant consumptive use is needed to leach out the remained salts in the soil, as well as the salts entered by irrigation practice.
Reclamation of saline-sodic soils may require some amendment materials such as gypsum, sulfuric acid, elemental sulfur or calcium compounds to replace sodium ions.
From mathematical point of view, the experimental leaching models can be categorized either as Hyperbolic (Leffelaar & Sharma, 1977; Hoffman, 1980; Pazira & Kawachi, 1981; Mohsenifar et al., 2006), Power form (Verma & Gupta, 1989; Pazira & Keshavarz, 1998) or Exponential functions (Dieleman, 1963; Rajabzadeh et al., 2009).
study were to investigate the accuracy and validity of the previously proposed models and to propose a new model for estimating water requirements for capital leaching to desalinize these soils.
MATERIAL AND METHODS
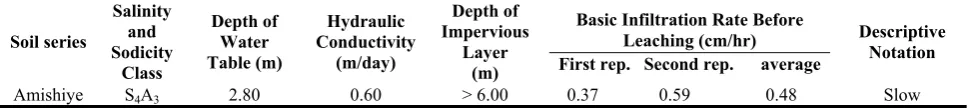
To collect the required data, intensive sets of large scale experiments were conducted in Amishiyeh soil series of Khuzestan plains, Iran. The study area is located in the south Khuzestan province which covers an area of 22,500 ha. This area is located between 48°, 20' and 48°, 38' East longitude, and 31°, 51’ and 31°, 55° North latitude. Average long term annual temperature and rainfall are 24.9°C and 252.1 mm, respectively. The soil temperature regime is Hypertermic and the soil moisture regime is Aridic (Torric). The soil order was categorized as Entisols, with the texture varied from Silty-Clay to Silty-Clay-Loam, having massive structure. According to soil survey and land classification studies, the salinity (S) and sodicity (A) of this area was classified as S4A3 (extreme salinity and sodicity). Over 96 percent of the study area has salinity and sodicity limitations. To conduct the experiments, a large saline-sodic area of 3,216 ha (14.35% of the total area) was selected by primary investigation of soil salinity maps. Some physical properties of experimental soil layers before applying any leaching water is presented in Tables 1 and 2.
Table1: Some major properties of experimental site
Soil series Salinity and Sodicity Class Depth of Water Table (m) Hydraulic Conductivity (m/day) Depth of Impervious Layer (m)
Basic Infiltration Rate Before Leaching (cm/hr) First rep. Second rep. average
Descriptive Notation
Amishiye S4A3 2.80 0.60 > 6.00 0.37 0.59 0.48 Slow
Table2: Some physical characteristics of the soil layers before leaching
Moisture deficit (cm) Permeability Total Porosity (%) Real density Bulk density Soil moisture (%)
Soil texture depth
(cm) Descriptive Layers Cumulative
Notation Rate (mm/hr) gr/cm3 FC M PWP 5.93 5.93 M.S 0.59 46.13 2.71 1.46 21.94 5.7 14.49 SiCL 0-25 9.29 3.36 V.S 0.87 40.75 2.7 1.6 21.3 12.9 14.96 SiCL 25-50 12.41 3.12 V.S 0.20 38.89 2.7 1.65 20.67 13.1 15.36 SiC 50-75 14.75 2.34 V.S 0.20 38.89 2.7 1.65 20.67 15 15.36 SiC 75-100 15.93 1.18 V.S 0.20 40.37 2.7 1.61 20.74 17.8 15.51 SiCL 100-125 16.91 0.97 V.S 0.40 40.15 2.69 1.61 24.32 21.9 15.48 SiC 125-150
M: initial soil water content
According to Table2, the soil profile is heavy to very heavy textured and the cumulative soil moisture deficit was between 5.93 cm in the first and 16.91 cm in the soil profile. Ranges of soil permeability were between 0.59 to 0.40 mm/hr and the total porosity varied from 46.13% in first layer to 40.15% in the last one.
Soil samples were taken from 0-25, 25-50, 50-75, 75-100, 100-125 and 125-150 cm soil depths, each in three replicates. These replicates reflect the samples that were taken before, during and after each leaching water application interval. The collected soil samples were then analyzed in the laboratory and their ECe, pH, CEC, ExNa+, CaSO
4, CaCO3, total Anions and total Cations were measured. The mean chemical properties of different soil layers for the first and second experimental replicates are respectively given in Tables 3 and 4. The equilibrated salinity was also measured after fourth leaching water interval application from 0-5 cm soil depths in three replicates.
Table3: Some chemical characteristics of different soil layers before and after applying leaching for first replicate
Sampling time
Soil
depth ECe pH T.N.V Gypsum C.E.C Ex.Na+ Mg2+ Ca2+ Na+ SAR ESP*
(cm) (dS/m) % Cmol+/kg meq/lit
Before leaching
0-25 66.50 7.9 45.3 0.38 13.0 4.85 148.0 64.0 757.0 73.53 37.31
25-50 35.90 8.1 48.2 0.35 15.4 1.05 72.5 65.5 380.0 45.75 6.82
50-75 32.00 8.2 47.0 0.37 10.8 1.35 71.5 64.0 343.7 41.76 12.50
75-100 34.40 8.1 46.0 0.39 9.1 1.50 105 72.5 354.8 37.66 16.48
100-125 27.20 8.1 47.2 0.17 11.9 0.75 68.5 63.0 303.8 37.47 6.30
125-150 30.20 8.1 48.5 0.19 12.8 2.30 68.0 66.0 282.0 34.45 17.97
After applying
100 cm leaching
0-25 4.80 8.1 47.0 0.17 14.0 0.78 11.0 26.0 10.7 2.49 5.57 25-50 4.80 8.2 48.0 0.04 15.4 2.08 13.0 22.0 13.4 3.20 13.51 50-75 5.20 8.2 45.0 1.12 11.0 0.90 12.0 25.0 31.0 7.21 8.18 75-100 7.40 8.3 44.0 1.12 8.94 2.10 15.0 24.0 58.4 13.22 23.49
100-125 15.20 8.2 47.0 1.22 12.0 1.20 24.0 34.0 124.0 23.03 10.00
125-150 19.10 8.2 47.0 1.22 13.14 1.20 33.0 25.0 168.0 31.20 9.13
Mean Before 37.70 8.08 47.03 0.31 12.17 1.97 After 9.42 8.2 46.33 0.82 12.41 1.38 18.0 26.0 67.58 13.39 88.92 65.83 403.55 45.1 16.23 11.65
Deference Decrease Increase - 0.12 - 0.51 0.24 - - - 28.28 - 0.7 - - 0.59 70.92 39.83 335.97 31.71 4.58 - - -
*(ESP=Ex.Na+×100/CEC)
Table4: Some chemical characteristics of different soil layers before and after applying leaching for second replicate
Sampling time
Soil
depth ECe pH T.N.V Gypsum C.E.C Ex.Na+ Mg2+ Ca2+ Na+ SAR ESP*
(cm) (dS/m) % Cmol+/kg meq/lit
Before leaching
0-25 66.50 7.9 45.3 0.38 13.0 4.85 148.0 64.0 757.0 73.53 37.31
25-50 35.90 8.1 48.2 0.35 15.4 1.05 72.5 65.5 380.0 45.75 6.82
50-75 32.00 8.2 47.0 0.37 10.8 1.35 71.5 64.0 343.7 41.76 12.50
75-100 34.40 8.1 46.0 0.39 9.1 1.50 105.0 72.5 354.8 37.66 16.48
100-125 27.21 8.1 47.2 0.17 11.9 0.75 68.5 63.0 303.8 37.47 6.30
125-150 30.20 8.1 48.5 0.19 12.8 2.30 68.0 66.0 282.0 34.45 17.97
After applying
100 cm leaching
0-25 5.50 8.0 47.0 0.57 14.0 0.46 20.5 28.0 11.3 2.29 3.29
25-50 5.50 8.2 48.0 0.13 17.4 0.84 21.0 22.0 16.2 3.49 4.83
50-75 6.50 8.2 46.0 0.04 12.9 1.26 22.0 18.0 55.0 12.30 9.77
75-100 13.30 8.3 44.0 1.03 10.3 3.50 19.0 22.0 123.0 27.17 33.98
100-125 40.8 8.2 45.0 1.29 9.8 2.1 75.0 53.0 371.0 46.44 21.43
125-150 35 8.1 46.0 0.40 12.7 2.2 67.0 52.0 294.0 38.11 17.32
Mean Before 37.7 After 17.77 8.17 46.00 0.58 8.08 47.03 0.31 12.17 1.97 12.85 1.73 88.92 65.8 403.55 45.1 16.23 37.42 32.5 145.08 21.63 15.10
deference Decrease 19.93 - Increase - 0.09 - 1.03 - 0.27 - 0.68 - 0.24 51.50 33.3 258.47 23.47 1.13 - - - - -
*(ESP=Ex.Na+×100/CEC)
gypsum content was varied between 0.38% and 0.17%. The lime content (T.N.V) varied between 45.3 and 48.5 % in the soil profile.
Using the data presented in Tables 2, 3 and 4, the desalinization values were obtained from
(1) (2)
where, Dlw is depth of applied water for leaching, Ds is depth of soil, ECi and ECf are Electrical Conductivity (dS/m) of saturated extract before and after leaching, respectively; and ECeq is Electrical Conductivity of soil water at equilibrium.
The value of ECeq is considered as ECe of the soil upper layer after leaching was stopped and Dlw/Ds is the ratio of net depth of leaching water (Dlw) to unit depth of soil (Ds). The quality of water used in this study is given in Table 5. This is classified as C4-S2 based on the Willcox diagram (Richards, 1954).
Table5: Chemical properties of the used water for soil desalinization
ECw T.D.S
pH Na
+ Ca2+ Mg2+ K+ Sum of
Cations Cl- SO42- HCO3- CO3
2-Sum of anions
SAR adjRNa
(dS/m) (mg/lit) (meq/lit) (meq/lit) (meq/lit)0.5
2.362 1512.0 8.2 15.0 2.0 10.0 - 27.0 13.0 11.0 3.0 - 27.0 6.10 6.19
Four mathematical models including Exponential, Power, Inverse and Logarithmic functions were fitted to the obtained experimental data using curve estimation technique. Then, regression coefficient, standard error at the significance level at 1% were obtained and the functions were compared based on these statistics. The best fitted model with the highest significancey was then selected. Similar procedure was conducted for the replication that received chemical amendment. The water needed for leaching to reduce soil salinity was determined, using the best fitted model. To evaluate model performance, analysis of residual errors, differences between measured and predicted values, were used (Homaee et al., 2002a; Zarei et al., 2010). These statistics were Maximum Error (ME), Root Mean Square Error (RMSE), Coefficient of Determination (CD), Modeling Efficiency (EF), and Coefficient of Residual Mass (CRM). The mathematical expressions of these statistics can be written as (Zarei
et al., 2010):
(3)
(4)
(5)
(6)
Where, Pi is the predicted values, Oi is the observed (measured) values, ō means of the observed data, and n is the number of samples.
The lower limit for ME, RMSE, and CD is zero. The maximum value for EF is one. Both EF and CRM can be negative. A large ME value represents the worst case performance of the model, while a large RMSE value shows how much the simulations overestimate or underestimate the measurements. The CD gives the ratio between the scatter of the simulated values and of the measurements. The EF value compares the simulated values to the averaged measured values. A negative EF value indicates that the averaged measured values give a better estimate than the simulated values. The CRM is a measure of the tendency of the model to overestimate or underestimate the measurements. A negative CRM shows a tendency to overestimation. If all simulated and measured data are the same, these statistics yield: ME = 0; RMSE = 0; CD = 1; EF = 0 and CRM = 0.
As the prerequisite of soil desalinization and land reclamation in large scale is
to equip the field with drainage systems (open or subsurface), for this reason based on available data obtained during the field studies, efforts were made to calculate the optimal depths and spacing of tile drains based on Glover-Dumm equation:
Where, K is Saturated Hydraulics Conductivity (0.6 m/day), Hp is depth of soil barrier (6.0 m), d is depth of tile drain installation (2.0 m), C is maximum permissible water table height (1.2 m), S is drainable porosity (0.077), T is irrigation interval (5 day) and Ri is recharge or deep percolation due to irrigation (0.025 m/irrigation for sugar cane as most consuming perennial crop). Using these data, the spacing of 50 m was obtained which seems to be practically and economically acceptable.
RESULTS AND DISCUSSION
Based on the data presented in Table 2, from application of 100 cm water that was given to soil for both leaching and total deficit moisture for the entire 150 cm soil depth, the amount of 16.91cm belonged to water deficit. Thus, the net depth of applied leaching water was about 83.1 cm.
In order to develop a desalinization model, the data presented in Tables 6, 7, 8 and 9 were employed by making use of equations 1 and 2. The obtained results and the derived empirical models are also represented in Tables 10 and 11 respectively.
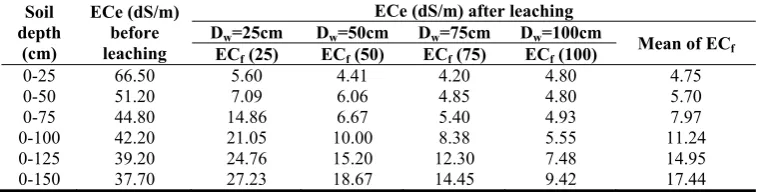
Table 6: Initial and final weighted mean ECe before and after leaching for first replicate
Soil depth
(cm)
ECe (dS/m) before leaching
ECe (dS/m) after leaching
Dw=25cm Dw=50cm Dw=75cm Dw=100cm Mean of EC f
ECf (25) ECf (50) ECf (75) ECf (100)
0-25 66.50 5.60 4.41 4.20 4.80 4.75
0-50 51.20 7.09 6.06 4.85 4.80 5.70
0-75 44.80 14.86 6.67 5.40 4.93 7.97
0-100 42.20 21.05 10.00 8.38 5.55 11.24
0-125 39.20 24.76 15.20 12.30 7.48 14.95
0-150 37.70 27.23 18.67 14.45 9.42 17.44
Table 7: Initial and final weighted mean ECe before and after leaching for second replicate
Soil depth
(cm)
ECe (dS/m) before leaching
ECe (dS/m) after leaching
Dw=25cm Dw=50cm Dw=75cm Dw=100cm Mean of
ECf
ECf (25) ECf (50) ECf (75) ECf (100)
0-25 66.50 4.80 6.00 5.00 5.50 5.33
0-50 51.20 6.75 6.50 5.20 5.50 5.99
0-75 44.80 11.17 7.23 5.80 5.83 7.51
0-100 42.20 18.13 11.23 8.00 7.70 11.26
0-125 39.20 - 15.44 13.80 14.32 14.52
0-150 37.70 - - 16.33 17.77 14.76
Based on data presented in table 4 - Data were not reliable
Table 8:The obtained desalinization values for the experimental soils for first replicate
Soil depth (cm) Net depth of leaching water applied and related ratios of applied water to unit depth of soil (X,Y)
0-25
Dlw (cm) 19.07 44.07 69.07 94.07
X=dlw/Ds 0.76 1.76 2.76 3.76
Y=ECf-ECeq/ECi-ECeq 0.01 - - -
0-50
Dlw (cm) 15.71 40.71 65.71 90.71
X=dlw/Ds 0.31 0.81 1.31 1.81
Y=ECf-ECeq/ECi-ECeq 0.04 0.02 - -
0-75 X=dlw/Ds 0.17 Dlw (cm) 12.59 37.59 0.50 62.59 0.83 87.59 1.17 Y=ECf-ECeq/ECi-ECeq 0.34 0.04 0.00 -
0-100
Dlw (cm) 10.25 35.25 60.25 85.25
X=dlw/Ds 0.10 0.35 0.60 0.85
Y=ECf-ECeq/ECi-ECeq 0.43 0.13 0.09 0.01
0-125 X=dlw/Ds 0.07 Dlw (cm) 9.07 34.07 0.27 59.07 0.47 84.07 0.67
Y=ECf-ECeq/ECi-ECeq 0.57 0.29 0.21 0.07
0-150
Dlw (cm) 8.09 33.09 58.09 83.09
X=dlw/Ds 0.05 0.22 0.39 0.55
Y=ECf-ECeq/ECi-ECeq 0.68 0.41 0.28 0.13 ECeq=5.23 dS/m
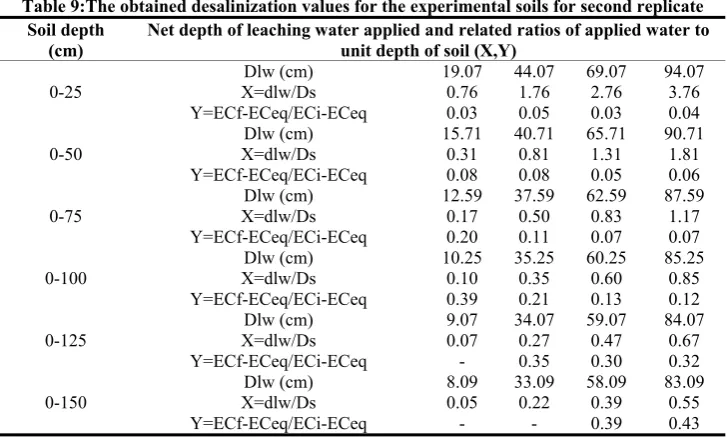
Table 9:The obtained desalinization values for the experimental soils for second replicate Soil depth
(cm) Net depth of leaching water applied and related ratios of applied water to unit depth of soil (X,Y)
0-25 X=dlw/Ds 0.76 Dlw (cm) 19.07 44.07 1.76 69.07 2.76 94.07 3.76
Y=ECf-ECeq/ECi-ECeq 0.03 0.05 0.03 0.04
0-50
Dlw (cm) 15.71 40.71 65.71 90.71
X=dlw/Ds 0.31 0.81 1.31 1.81
Y=ECf-ECeq/ECi-ECeq 0.08 0.08 0.05 0.06
0-75
Dlw (cm) 12.59 37.59 62.59 87.59
X=dlw/Ds 0.17 0.50 0.83 1.17
Y=ECf-ECeq/ECi-ECeq 0.20 0.11 0.07 0.07
0-100 X=dlw/Ds 0.10 Dlw (cm) 10.25 35.25 0.35 60.25 0.60 85.25 0.85
Y=ECf-ECeq/ECi-ECeq 0.39 0.21 0.13 0.12
0-125
Dlw (cm) 9.07 34.07 59.07 84.07
X=dlw/Ds 0.07 0.27 0.47 0.67
Y=ECf-ECeq/ECi-ECeq - 0.35 0.30 0.32
0-150 X=dlw/Ds 0.05 Dlw (cm) 8.09 33.09 0.22 58.09 0.39 83.09 0.55
Y=ECf-ECeq/ECi-ECeq - - 0.39 0.43
Table10: The calculated model parameters and related statistics for evaluating different desalinization models performance for first replicate
statistics parameters Related coefficients
Mathematical
expression A B R SE Sig F
0.001 0.084 0.917 -4.073 0.742 Y=a.eb.x 0.001 0.086 0.913 -0.755 0.074 Y=a.xb 0.001 0.079 0.925 -0.220 -0.035 Y=a+blnx 0.001 0.092 0.898 -0.034 0.050 Y=a+b/x
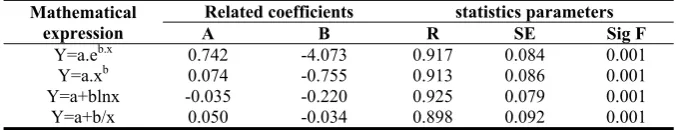
Table 11: The calculated model parameters and related statistics for evaluating different desalinization models performance for second replicate
statistics parameters Related coefficients
Mathematical
expression A B R SE Sig F
0.001 0.67 0.68 -0.67 0.22 Y=a.eb.x 0.001 0.60 0.65 -0.75 0.09 Y=a.xb 0.001 0.10 0.66 -0.10 0.12 Y=a+blnx 0.001 0.11 0.56 0.03 0.09 Y=a+b/x
For the first replicate, the Logarithmic model with maximum correlation coefficient (R) of 0.93 and minimum standard error (SE) of 0.079 was selected. This was significant at 1% of significancey level. The best fitted empirical model obtained to be:
(9) For the second replicate, the Logarithmic model was also provided the best results, having
maximum R value of 0.75 and minimum SE of 0.1 at 1% significantly level. The obtained relation can be written as:
(10) By substituting Eqs.1 and 2 into Eq.9, the latter can be written as:
(11)
By making use of Eq.11, the net water depth (Dlw) needed for reducing soil salinity after applying leaching water and final soil salinity can be determined by:
(12)
(13)
(14)
By substituting Eqs.1 and 2 into Eq.10, the latter can be re-written as:
(15) By using Eq.15, the net water depth (Dlw) needed for reducing soil salinity after applying
(16)
(17)
(18)
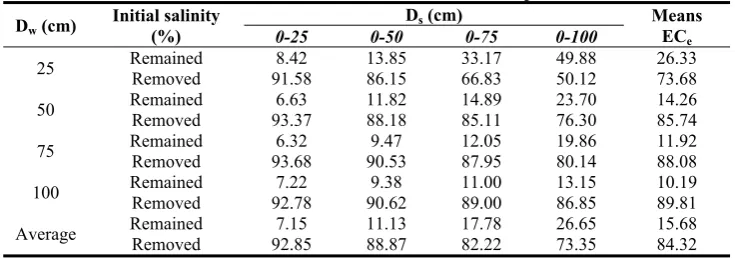
Based on the data given in Tables 6 and 7, the remaining initial salts as well as removed initial salts percentage can be calculated as presented in Tables 12 and 13.
The data given in Table 12 indicate that by applying 100 cm leaching water, 92.85, 88.87, 82.22 and 73.35 percents of the initial salts were leached out from corresponding depths, respectively. The used leaching water for these depths corresponds to 8.67, 4.9, 3.42 and 2.57 pore volumes, respectively.
Table 12: The relation between depth of applied leaching water and remaining initial salts and initial removed salts in soil for first replicate
Dw (cm) Initial salinity (%) Ds (cm) Means EC
e
0-25 0-50 0-75 0-100
25 Remained 8.42 Removed 91.58 86.15 66.83 50.12 73.68 13.85 33.17 49.88 26.33
50 Remained 6.63 Removed 93.37 88.18 85.11 76.30 85.74 11.82 14.89 23.70 14.26
75 Remained 6.32 9.47 Removed 93.68 90.53 87.95 80.14 88.08 12.05 19.86 11.92
100 Remained 7.22 9.38 Removed 92.78 90.62 89.00 86.85 89.81 11.00 13.15 10.19
Average Remained 7.15 Removed 92.85 88.87 82.22 73.35 84.32 11.13 17.78 26.65 15.68
The data given in Table 13 indicate that by applying 100 cm leaching water, 91.98, 88.30, 83.24 and 73.32 percents of the initial salts were leached out from the corresponding depths. The applied leaching water for these depths corresponds to 8.67, 4.9, 3.42 and 2.57 pore volumes, respectively.
Table 13: The relation between depth of applied leaching water and remaining initial salts and initial removed salts in soil for second replicate
Dw (cm) Initial salinity (%) 0-25 0-50 0-75 0-100 Ds (cm) Means ECe
25 Remained 7.22 13.18 24.93 42.96 22.07 Removed 92.78 86.82 75.07 57.04 77.93
50 Remained 9.02 12.70 16.14 26.61 16.12 Removed 90.98 87.30 83.86 73.39 83.88
75 Remained 7.52 10.16 12.95 18.96 12.39 Removed 92.48 89.84 87.05 81.04 87.61
100 Remained 8.27 10.74 13.01 18.25 12.57 Removed 91.73 89.26 86.99 81.75 87.43
Average Remained 8.01 11.69 16.76 26.69 15.79 Removed 91.98 88.30 83.24 73.32 84.21
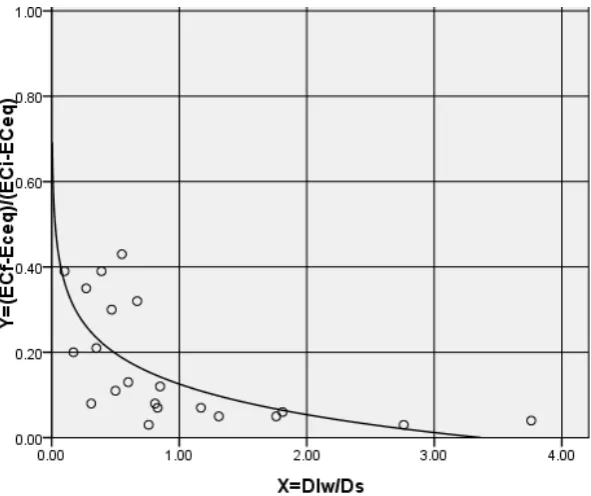
Fig. 1: Soil desalinization curve in the study area for the first replicate (leaching water without amendment)
Fig. 2: Soil desalinization curve in the study area for the second replicate (leaching water + sulfuric acid)
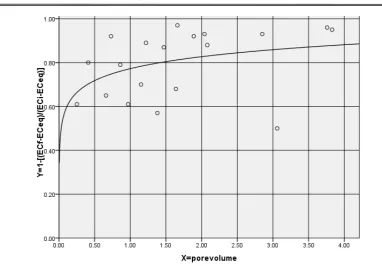
reached, were referred to as excess salts. Under the most ideal condition, this equilibrium will be 1.5 to 2.0 times of irrigation water salinity (in this study it was found to be 4.01 dS/m, that is the average of 5.23 and 2.79 dS/m which were obtained from replications 1and 2, respectively). Figures 3 and 4 shows the fraction of excess salts removed from both replications, expressed by Y= 1- ((ECf-ECeq)/(ECi-ECeq)) as a function of pore volumes.
It should be noted that in this case, the data that presents active salts removed were used (Hendrikus Branard et al., 2010). By subtracting ECeq from the actual and initial ECe values, leaching curves are obtained that are independent of the salinity of leaching water, existing drainage and evaporation conditions. Therefore the shape of leaching curves governed solely by soil characteristics.
Fig.4: Fraction of excess salts removed from replication 2
Since the salt leaching follows the miscible displacement approach, based on the Biggar and Nielsen (1961) idea, for each pore volume, 50% and for two pore volumes about 80% of the initial salts should be removed from the soil profile. However, Figure 3 and 4 indicate the about 78% and 84% of the initial salts are leached out for one pore volume water application for the first and second replicates, respectively. This observation indicates that the Biggar and Nielsen approach underestimates the real condition as it was reported by some other researchers as well. Leaching of remained salts need more times and special treatments such as proper crop rotation, correct soil water management via deep percolation by which the residual salts can also be removed gradually and total soluble salts finally will leach out from soil profile.
To evaluate the obtained desalinization data these data were compared to some other previously proposed empirical models to assess the predictability of capital leaching water requirements. The related results are presented in Table 14. For this comparison the initial, final and equilibrated soil salinities were considered to be 45.0, 8.0 and 3.54(1.5 times of leaching water salinity) dS/m, respectively, in the depth of 150 cm.
Table 14: Comparison of required desalinization water for different available models and the newly proposed model
model year
Required water for desalinization(m)
Weighted mean
needed water (m) Rank Soil depth incriment (Ds) (m)
0.25 0.50 0.75 1.00
Reeve 1957 0.41 0.83 1.22 1.63 1.50 9
Dielman 1963 0.50 1.00 1.50 2.00 1.67 10
Leffelaar &Sharma 1977 0.15 0.30 0.46 0.61 0.54 5
Hoffman 1980 0.18 0.37 0.55 0.74 0.69 8
Pazira & Kawachi 1981 0.17 0.34 0.51 0.67 0.66 6
Verma & Gupta 1989 0.19 0.39 0.58 0.78 0.67 7
Pazira & Keshavarez 1998 0.13 0.26 0.39 0.51 0.50 3
Mohsenifar 2006 0.02 0.11 0.26 0.47 0.41 2
Rajabzadeh & Pazira 2008 0.13 0.27 0.40 0.54 0.51 4
The results indicated that the models proposed by Mohsenifar (2006), Pazira & Keshawarz (1998), can provide second and third best perditions after the newly proposed model. Some other empirical models (e.g. Reeve, 1957; Dielman, 1962; Hoffman, 1980) did not provide a reasonable predictions. This can be related to different soil physical and chemical properties, and to desalinization experimental performances.
It should be mentioned that the soil desodification process (method of data generation, analysis, comparison and results) is rather the same as desalinization process and for this reason; it will not be presented in this article, but will be discussed in detail elsewhere.
CONCLUSION
The collected data from the extensive experiments indicates that by applying 100 cm leaching water, the soil salinity reduces to 88.87and 73.35 percents of initial salts in the first replicate. This was 88.30 and 73.32 percents of the initial salts for the second replicate at 0.5 and 1,0 m of soil profile, respectively. The soil water deep percolation itself can leach out about 84% of the initial salts when only 100 cm water applied. The results of correlation mathematical models indicate that Logarithmic model can well describe the collected experimental data at large scale. The newly proposed empirical model with minimum weighted mean of required leaching water (0.38), presents best performance from water saving point of view, compares to other models. Also from the data presented in tables 3 and 4, it is evidence that desalinization automatically takes care of desodification.Therefore, the important conclusion is that there is no need of any amendment of the form of Sulfuric Acid, etc., in the reclamation of the soils under consideration.
.
REFERENCES
1. Ben-Gal, A., Ityel, E., Dudley, L. (2008). Effect of irrigation water salinity on transpiration and on leaching requirements: A case study for bell peppers. Agricul. Water
Manage., 95:587-597.
2. Corwin, D. L., Rhoades, J. D., Šimůnek, J. (2007). Leaching requirement for soil salinity control: Steady-state versus transient models. Agricul. Water Manage., 90(3):165-180. 3. Cote, C. M., Bristow, K. L., Ross, P. J. (2000). Increasing the efficiency of solute
leaching: impacts of flow interruption with drainage of the ‘‘preferential flow paths’’.
Journal of Contaminant Hydrology., 43:.191–209.
4. Dieleman, P. J. (1963). Reclamation of salt -affected soils in Iraq. Veenman, Wageningen, 175 P.
5. Hendrikus Barnard. J ., van Rensburg, L. D ., Peter Bennie, A. T. ( 2010). Leaching irrigated saline sandy to sandy loam apedal soils with water of a constant salinity. Irrig Sci., 28:191–201.
6. Hoffman, G. J. (1980). Guidelines for reclamation of salt-affected soils. Proceedings of international american salinity and water management, technical conference. Juar. Mecxico. PP: 49-64.
7. Homaee, M ., Schmidhalter, U. (2008). Water integration by plants root under non-uniform soil salinity. Irrigation Science., 27:83-95.
8. Homaee, M., Feddes, R. A., Dirksen, C. (2002a). A macroscopic water extraction mode for nonuniform transient salinity and water stress. Soil Sci. Soc. Am. J., 66 (6): 1764- 1772. 9. Homaee, M., Feddes, R. A., Dirksen, C. (2002b). Simulation of root water uptake. I.
Nonuniform transient salinity stress using different macroscopic reduction functions. .
Agricultural Water Management., 57(2): 89-109.
10. Homaee, M., Feddes, R.A., Dirksen, C. (2002c). Simulation of root water uptake. II. Nonuniform transient water stress using different reduction functions. Agricultural Water
11. Homaee, M., Feddes, R. A., Dirksen, C. (2002d). Simulation of root water uptake. III. Nonuniform transient combined salinity and water stress. Agricultural Water
Management., 57(2): 127-144.
12. Jurinak, J. J. (1981). Salt-affected soils, Utah state university. Logan, Utah. Chapter V PP1-13.
13. Konukcu, F., Gowing, J. W., Rose, D. A. (2006). Dry drainage: A sustainable solution to water logging and salinity problems in irrigation areas. Agricultural. Water Manage., 83(1-2):1-12.
14. Leffelaar, P. A ., Sharma, P. (1977). Leaching of a highly saline-sodic soil. Journal of Hydrology., 32:203-218.
15. Loáiciga, H.A., Allison, H. (2007). Ponding analysis with green-and-ampt infiltration. J. Hydrol. Eng., 12: 109-112.
16. Mohsenifar, K., Pazira, E., Najafi, P. (2006). Evaluation leaching models in two area of Southeast Khuzestan province. Proceedings of the first regional of optimize utilization of water resources of Karoon and Zayandehrood Watershed, Shahrekord University, pp: 2026-2037 (Persian).
17. Nielsen, D. R., Biggar, J. W. (1961). Miscible displacement in soils. Soil Sci Soc Am Proc
25:1–5.
18. Pazira, E., Kawachi, T. (1981). Studies on appropriate depth of leaching water, Iran: A case study. Journal of Integrated Agricultural Water Use and Freshening Reservoirs.,
Kyoto University Japan., 6:39-49.
19. Pazira, E., Keshavarz, A ., Torii, K. (1998). Studies on appropriate depth of leaching water, International Workshop on the Use of Saline and Brackish-Water for Irrigation, Indonesia.
20. Pazira, E., Homaee, M. (2010). Salt leaching efficiency of subsurface drainage systems at presence of diffusing saline water table boundary: A case study in Khuzestan plains, Iran. Proceedings of the XVIIth World Congress of the International Commission of Agricultural Engineering (CIGR), Quebec City, Canada, pp 1-15. June. Canada.
21. Rajabzadeh, F., Pazira, E., Mahdian, M.H., Mahmoudi, S ., Heidarizadeh. M. (2009). Leaching Saline and Sodic soils along with rclamation-rotation program in the Mid-Part of Khuzestan , Iran. Journal of Applied Sciences., 9(22): 4020-4025.
22. Reeve, R. C. (1957). The relation of salinity to irrigation and drainage requirements. Third Congress of International Commission on Irrigation and Drainage, Transactions 5:10.175-10.187.
23. Verma, S. K., Gupta, R. K. (1989). Leaching of saline clay, soil under two models of water application. J. Indian Soc. Soil Sci., 37 (1) (on line).