in the population sciences published by the Max Planck Institute for Demographic Research Konrad-Zuse Str. 1, D-18057 Rostock · GERMANY www.demographic-research.org
DEMOGRAPHIC RESEARCH
VOLUME 21, ARTICLE 18, PAGES 535-568
PUBLISHED 20 OCTOBER 2009
http://www.demographic-research.org/Volumes/Vol21/18/ DOI: 10.4054/DemRes.2009.21.18
Descriptive Findings
Results and observations from the
reconstruction of continuous time series of
mortality by cause of death:
Case of West Germany, 1968-1997
Markéta Pechholdová
© 2009 Markéta Pechholdová.
This open-access work is published under the terms of the Creative Commons Attribution NonCommercial License 2.0 Germany, which permits use, reproduction & distribution in any medium for non-commercial purposes, provided the original author(s) and source are given credit.
1 Introduction 536
2 Cause-of-death data 537
2.1 Reporting and coding the causes of death 537
2.2 Collected data 539
3 Reconstruction of continuous time series 540
3.1 Correspondence tables 542
3.2 Elementary associations 543
3.3 Transition coefficients 547
3.4 Results 549
3.5 Age-specific treatment of time series 553
4 Beyond the classification changes 555
4.1 Unique case of the emergence of AIDS 555
4.2 Sudden changes in coding practices 558
4.3 Gradual change in coding practices 560
5 Unknown and ill-defined causes of death 561
5.1 The redistribution of ill-defined causes of death 562
6 Conclusion 564
7 Acknowledgments 565
Results and observations from the reconstruction of
continuous time series of mortality by cause of death:
Case of West Germany, 1968-1997
Markéta Pechholdová1
Abstract
Though many countries have been collecting cause-of-death information from death certificates for more than a century, these valuable data sources remain underexplored. This is certainly due in part to the frequent revisions of the International Classification of Diseases (ICD), which have caused breaks in data continuity. This paper describes the methodological background and the results of the transition between the eighth and theninth revision of ICD for the territory of former West Germany. Using practical examples, we examine the difficulties encountered and discuss the solutions applied.
1 Institut national d’études démographiques, 133, Boulevard Davout, 75980; Paris cedex 20, France.
1. Introduction
To analyse historical mortality trends, long-term time series of cause-of-death data are needed. Unfortunately, there are three obstacles to the use of these data: revisions of the disease classification, changes in cause-of-death coding, and, finally, varying proportions of deaths with unknown or poorly defined cause.
The International Classification of Diseases and Related Health Problems (ICD), the main tool for coding and tabulating data on causes of death, is periodically revised to reflect progress of medical knowledge. Consequently, with every new revision, the time series of mortality by cause of death are interrupted.
National statistical offices rarely produce a double classification (cross-tabulation of deaths by both the actual and the previous revision) that would make it possible to directly redistribute the deaths of the previous periods according to the new classification. Such an attempt was made for England and Wales, for example, with the transition between ICD8 and ICD9 (OPCS 1983).2 Nevertheless, the transition
coefficients derived from the English double classification could not be applied to other countries, because coding practices vary from country to country (Meslé and Vallin 1993).
A method to reclassify the causes of death ex post when double-coding information is missing was developed and later applied in many countries, including France (Vallin and Meslé 1988), Russia (Meslé et al. 1996), Ukraine (Meslé and Vallin 2003), and the Baltic countries. Long-term time series also exist for the Netherlands (Wolleswinkel-van Den Bosch, Van Poppel, and Mackenbach 1996).3
The purpose of this study is to describe the reconstruction of continuous time series of mortality by cause of death in West Germany for the period 1968-1997 covered by the 8th and the 9th ICD revision. The following section discusses
cause-of-death data collection and coding in West Germany. Section three then contains a detailed description of the reconstruction process itself, explaining the methodology used to deal with the breaks caused by the classification change and giving some practical examples. The last sections provide solutions for the two remaining difficulties in the cause-of-death time series – the changes in the coding practices not directly related to the classification change and the persistence of ill-defined causes of death.
2 In the United Kingdom a double codification of death certificates was performed on a 25 percent sample of
data available in 1978. Double classification of deaths by the ICD8 “A-list” and by ICD9 BTL (Basic Tabulation List) was published.
3 The method used in Netherlands is based on the ex-post double classification, but works with nested
The complete results of the presented project – the continuous time series for West Germany – have been published with extensive accompanying documentation, and are now downloadable via the web page of the Max Planck Institute for Demographic Research (MPIDR).4
2. Cause-of-death data
The history of data collection on causes of death in Germany can be traced back more than 100 years. As in many other countries (e.g. France, Russia), cause-of-death statistics were originally not available for the whole population. From 1877 onwards, the information was first collected in towns with more than 15,000 inhabitants. In 1905 a uniform and detailed cause-of-death registration system was introduced.5 Up to the
1930s, a specific classification was used in Germany (DESTATIS 2005). Since 1932, Germany has adopted ICD-based classifications.
After their separation, both East and West Germany continued using and revising the ICD. In 1968 the 8th revision of ICD was adopted in West Germany by the Federal
Statistical Office, replaced by ICD9 in 1979. In 1990, the West and East German statistics were merged into one common system, which continued using ICD9 until 1997. In 1998, Germany implemented the 10th revision of the ICD.
2.1 Reporting and coding the causes of death
The collection, processing and coding of causes of death in Germany is decentralized. The nation-wide consistency of the collected cause-of-death data is however assured by strict compliance with the World Health Organization (WHO) recommendations on reporting the chain of pathologies leading to death, and by the centralized training of the coders.
The statistical information about causes of death is compiled from death certificates filled out by certifying practitioners (medical data) and from the vital records (demographic data). The collection, coding and tabulation of cause-of-death data is the task of regional statistical offices. The death certificates also pass through the regional health offices (Gesundheitsamt), where the medical data are analysed for public health purposes (e.g., surveillance of epidemics), the death certificate is checked and, if necessary, corrected for completeness and plausibility of the diagnostic
information. The country data, which we are using in the present study, are summarized from the regional tables at the Federal Statistical Office.
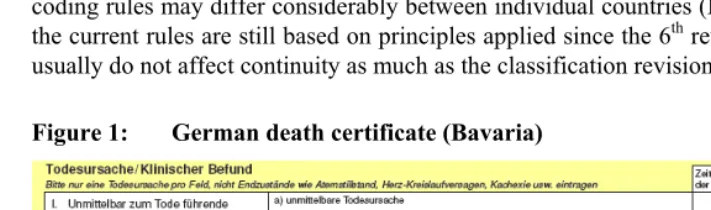
In accordance with international recommendations, the death certificates of all states (Länder) contain information about the immediate (direct) (a), the intervening (b, c) and the underlying (main, initial) (d) cause of death (Grundleiden), as well as a list of associated significant conditions (Epikrise) (Figure 1). The format of the death certificate is designed to facilitate selection of the underlying cause of death among other diseases; a properly completed cause-of-death section of the death certificate thus provides an etiologic explanation of the order, type, and association of events resulting in death. If the certificate is not filled in correctly, the so-called “coding rules” are applied.
The ICD coding rules have been evolving along with the revisions of the ICD. They have become increasingly precise and complex. The impact of the change in the coding rules may differ considerably between individual countries (Meslé 1995), but as the current rules are still based on principles applied since the 6th revision of ICD, they
usually do not affect continuity as much as the classification revisions.
Figure 1: German death certificate (Bavaria)
Source: Freistaat Bayern Todesbescheingung, Information für die Ärztin/den Arzt
Out of several diseases reported on the death certificate, only the underlying cause of death, defined by WHO as “the disease or injury that initiated the train of events leading directly to death, or the circumstances of the accident or violence that produced the fatal injury”, has been processed in West Germany until present.6
6 The underlying cause of death is the primary cause of death for tabulation, because it is best suited to public
2.2 Collected data
The data were extracted from two types of sources: for the 1968-1979 period, they were computerised from the printed statistics on causes of death, while since 1980 the data have been provided in electronic format. The collected data are inconsistent with respect to the age scale, the level of classification detail, the classification of causes of death, and possibly other barely traceable inconsistencies in the quality of cause-of-death registration.
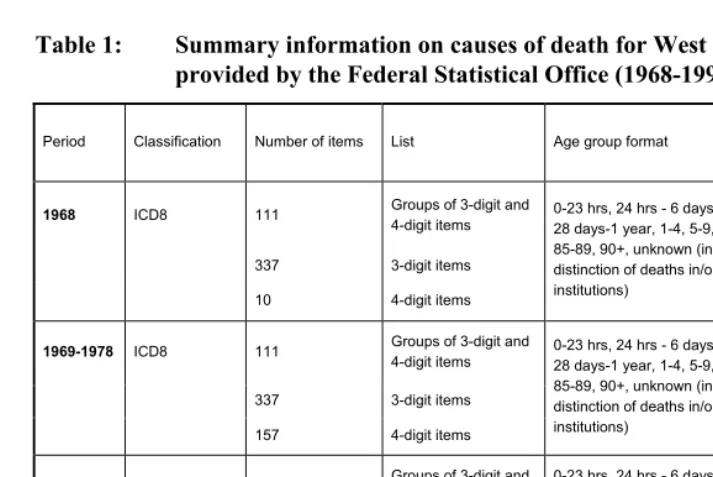
Table 1 provides a summary of the data collected by the MPIDR for the purpose of reconstructing continuous time series of mortality, by cause of death, in West Germany. The time period between 1968 and 1978 is covered by ICD8. The data on the causes of death are presented in the form of a short list comprising a mixture of single 3-digit items, selected 4-digit items, and groups of either 3-digit or 4-digit items, or both. There is a substantial difference between the tabulation detail in the first year and the following years of the ICD8, while the number of 4-digit codes increased from 10 in 1968 to 157 in 1969. In order to obtain the same level of detail for 1968 as for the other years, the deaths from the 1968 items without sufficient detail were redistributed according to the proportions observed in 1969 and 1970.
The 9th revision of the ICD was applied to West German cause-of-death statistics
Table 1: Summary information on causes of death for West Germany, as provided by the Federal Statistical Office (1968-1997)
Period Classification Number of items List Age group format Data type
1968 ICD8 111 Groups of 3-digit and
4-digit items
337 3-digit items
10 4-digit items
0-23 hrs, 24 hrs - 6 days, 7-27 days, 28 days-1 year, 1-4, 5-9, 10-14, …, 85-89, 90+, unknown (incl. distinction of deaths in/outside of institutions)
Printed data
1969-1978 ICD8 111 Groups of 3-digit and
4-digit items dtto
337 3-digit items
157 4-digit items
0-23 hrs, 24 hrs - 6 days, 7-27 days, 28 days-1 year, 1-4, 5-9, 10-14, …, 85-89, 90+, unknown (incl. distinction of deaths in/outside of
institutions)
1979 ICD9 104 Groups of 3-digit and
4-digit items dtto
299 3-digit items
130 4-digit items
0-23 hrs, 24 hrs - 6 days, 7-27 days, 28 days-1 year, 1-4, 5-9, 10-14, …, 85-89, 90+, unknown (incl. distinction of deaths in/outside of
institutions)
1980-1997 ICD 9 892 3-digit items 0, 1-4, 5-9, 10-14, …, 85-89, 90+,
unknown
Electronic data
Note: The “Number of items” column refers to natural causes of death (001-799) and to the E-classification (E800-E999). We do not work with the N-classification of external causes of death.
3. Reconstruction of continuous time series
West Germany, along with the majority of European countries, produced no double classification at the time of change from the 8th to the 9th ICD revision. This lack of
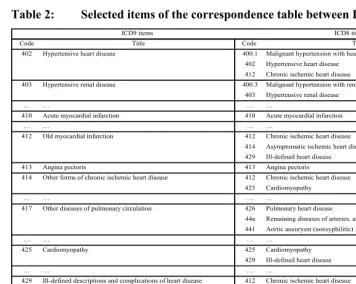
Table 2: Selected items of the correspondence table between ICD9 and ICD8
ICD9 items ICD8 items
Code Title Code Title
402 Hypertensive heart disease 400.1 Malignant hypertension with heart involvement 402 Hypertensive heart disease
412 Chronic ischemic heart disease
403 Hypertensive renal disease 400.3 Malignant hypertension with renal involvement 403 Hypertensive renal disease
… … … …
410 Acute myocardial infarction 410 Acute myocardial infarction
… … … …
412 Old myocardial infarction 412 Chronic ischemic heart disease 414 Asymptomatic ischemic heart disease 429 Ill-defined heart disease 413 Angina pectoris 413 Angina pectoris 414 Other forms of chronic ischemic heart disease 412 Chronic ischemic heart disease
425 Cardiomyopathy
… … … …
417 Other diseases of pulmonary circulation 426 Pulmonary heart disease
44a Remaining diseases of arteries, arterioles and capillaries 441 Aortic aneurysm (nonsyphilitic)
… … … …
425 Cardiomyopathy 425 Cardiomyopathy 429 Ill-defined heart disease
… … … …
429 Ill-defined descriptions and complications of heart disease 412 Chronic ischemic heart disease 429 Ill-defined heart disease
… … … …
442 Other aneurysm 44a Remaining diseases of arteries, arterioles and capillaries 443 Other peripheral vascular disease 44a Remaining diseases of arteries, arterioles and capillaries
… … … …
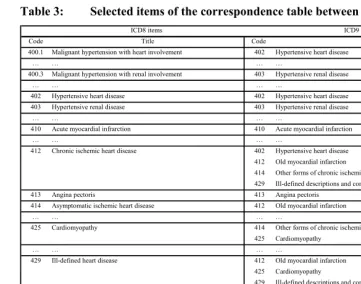
Table 3: Selected items of the correspondence table between ICD8 and ICD9
ICD8 items ICD9 items
Code Title Code Title
400.1 Malignant hypertension with heart involvement 402 Hypertensive heart disease
… … … …
400.3 Malignant hypertension with renal involvement 403 Hypertensive renal disease
… … … …
402 Hypertensive heart disease 402 Hypertensive heart disease 403 Hypertensive renal disease 403 Hypertensive renal disease
… … … …
410 Acute myocardial infrarction 410 Acute myocardial infarction
… … … …
412 Chronic ischemic heart disease 402 Hypertensive heart disease 412 Old myocardial infarction
414 Other forms of chronic ischemic heart disease 429 Ill-defined descriptions and complications of heart disease 413 Angina pectoris 413 Angina pectoris
414 Asymptomatic ischemic heart disease 412 Old myocardial infarction
… … … …
425 Cardiomyopathy 414 Other forms of chronic ischemic heart disease 425 Cardiomyopathy
… … … …
429 Ill-defined heart disease 412 Old myocardial infarction 425 Cardiomyopathy
429 Ill-defined descriptions and complications of heart disease
… … … …
44a Remaining diseases of arteries, arterioles and capillaries 417 Other diseases of pulmonary circulation 442 Other aneurysm
443 Other peripheral vascular disease 446 Polyarteritis nodosa and allied conditions 447 Other disorders of arteries and arterioles 448 Disease of capillaries
3.1 Correspondence tables
When the 9th ICD revision was adopted, WHO did not publish a document describing
the changes in the classification and suggesting the correspondences. Consequently, the correspondence tables have to be constructed by systematic comparison of the analytic tables and alphabetic indexes of the two respective classifications. The Statistical Office in West Germany created a hypothetical correspondence table adapted to the needs of the German tabulation system,7 which served as a basis for our work.8 However, many
of these correspondences later proved to be insufficient, requiring large modifications.
7 A machine-typed document entitled Umsteigeschlüssel für die Klassifikationen ICD 8. und 9. Revision,
Statistisches Bundesamt, VII D, Wiesbaden, the 6th December 1982.
8 At this point, we would like to thank Dr. Michael Bubenheim, who constructed the very first version of the
A correspondence table consists of two reciprocal tables – the first one assigns to each item of ICD9 all items of the ICD8 which have at least a part of the medical content in common. The second table then lists all mutual correspondences again, sorted by ICD8 items. Table 2 and Table 3 show a subset of the correspondence table between ICD8 and ICD9.
3.2 Elementary associations
The idea behind the so-called elementary associations is to create the smallest possible clusters of deaths by the same causes. Elementary associations combine information from the correspondence table (theoretical content) with the reported numbers of deaths in the transition years (empirical content). This approach guarantees both medical and statistical continuity.
There are several types of associations, depending on the complexity of the changes between the two successive ICD revisions. In the easiest case, one ICD9 item corresponds with only one ICD8 item, and vice versa, suggesting that no change in the definition took place between the two revisions. As the classification becomes more detailed with the next revision, many of the elementary associations split one ICD8 item into multiple ICD9 items. In rather rare cases, several ICD8 items join to form a single ICD9 item.9 Obviously, splitting and joining indicates that only the classification detail
has changed. In cases other than change of detail, the resulting associations are complex, linking several related ICD9 and ICD8 items.
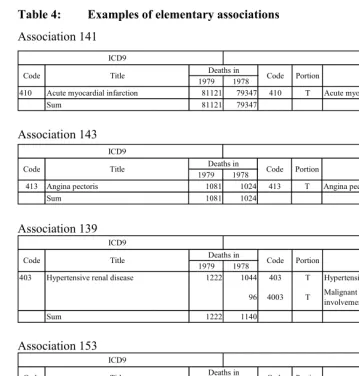
Table 4 shows all the elementary associations that come out of the ICD items listed in Table 2 and Table 3. Each association contains information to identify the cause of death in question (ICD9 code and title), the identification of the corresponding items (ICD8 code and title), the death counts before and after the transition year, and the portion of each ICD8 item which corresponds to its ICD9 counterpart. The portion is designated as T (total) or P (partial), with T meaning that the entire content of the ICD8 item will be associated with its ICD9 equivalent. If P is indicated, the ICD8 item will be split into several ICD9 items.
9 Such loss of classification detail on the 3-digit level was observed, for example, for a virtually eradicated
Table 4: Examples of elementary associations Association 141
ICD9 ICD8
1979 1978
410 Acute myocardial infarction 81121 79347 410 T Acute myocardial infarction
Sum 81121 79347
Portion Title
Code Title Deaths in Code
Association 143
ICD9 ICD8
1979 1978
413 Angina pectoris 1081 1024 413 T Angina pectoris
Sum 1081 1024
Portion Title
Code Title Deaths in Code
Association 139
ICD9 ICD8
1979 1978
403 Hypertensive renal disease 1222 1044 403 T Hypertensive renal disease
96 4003 T Malignant hypertension with renal involvement
Sum 1222 1140
Code Title Deaths in Code Portion Title
Association 153
ICD9 ICD8
1979 1978
442 Other aneurysm 97 1100 44a P Remaining diseases of arteries,
arterioles and capillaries (442, 443,
446-443 Other peripheral vascular disease 935 44a P
446 Polyarteritis nodosa and allied conditions 78 44a P
447 Other disorders of arteries and arterioles 60 44a P
448 Disease of capillaries 18 44a P
(417) (neglected) (44a) P
Sum 1188 1100
Portion Title
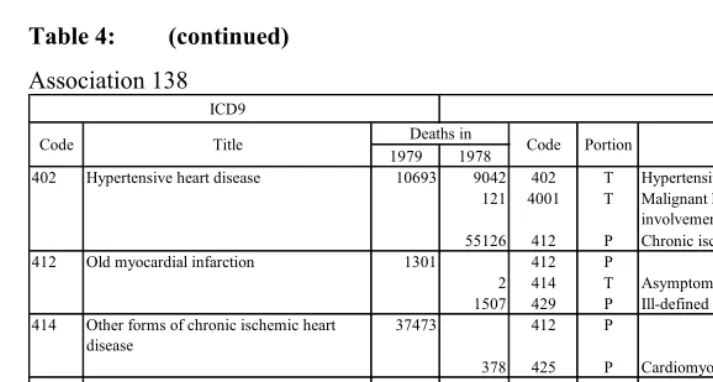
Table 4: (continued) Association 138
ICD9 ICD8
1979 1978
402 Hypertensive heart disease 10693 9042 402 T Hypertensive heart disease
121 4001 T Malignant hypertension with heart involvement
55126 412 P Chronic ischemic heart disease
412 Old myocardial infarction 1301 412 P
2 414 T Asymptomatic ischemic heart disease
1507 429 P Ill-defined heart disease
414 Other forms of chronic ischemic heart disease
37473 412 P
378 425 P Cardiomyopathy
429 Ill-defined descriptions and complications of heart disease
16861 412 P
429 P
425 Cardiomyopathy 1036 425 P
429 P
Sum 67364 66176
Code Title Deaths in Code Portion Title
Note: In the “Portion” column, T stands for total correspondence, P for partial correspondence.
To create an elementary association, the first step is to search both of the correspondence tables. We find, for example, a single ICD8 item corresponding to a single ICD9 item, as with ICD9 item 410, Acute myocardial infarction. The next step is to search the ICD8 to ICD9 correspondence table for other possible links of ICD8 item 410. If no such links are found, and if the association is statistically balanced, the elementary association of type 1:1 can be closed (see Table 4, Association 141 and Association 143).
ICD9 item 403, Hypertensive renal disease, links with two ICD8 items: 403, Hypertensive renal disease, and 4003, Malignant hypertension with renal involvement. ICD8 contained a 3-digit code for malignant hypertension (400), specifying the affected organ system on the 4th digit detail (heart, renal, cerebrovascular, etc.). In ICD9 this
concept of malignant hypertension was abandoned. There is no obvious equivalent of ICD8’s malignant hypertension in ICD9, instead it links mainly to the new ICD9 items for hypertensive (401-405) and cerebrovascular (430-438) diseases.
Checking against the correspondence table ICD8/ICD9 (Table 3), the ICD8 items in question both link with ICD9 403 only, completing an association of type 1:N (see Table 4, Association 139).
ICD9 equivalents. The Association 153 represents such a case, when the ICD8 group 44a (containing items 442, 443 and 446-448) is split into 5 individual ICD9 items 442, 443, and 446-448.
Some correspondences are negligible enough to be dropped. In Association 153, in contrast to the correspondence tables, the link of ICD9 item 417 with ICD8 item 44a was neglected. We could do so under three conditions: 1) the major part of ICD9 item 417 was linked with another ICD8 item, 2) the link is assumed to be very marginal, and 3) the association remains statistically balanced.
Association 138 (Table 4) is complex (N:N type). In accordance with the correspondence table, the death counts of ICD8 item 402, Hypertensive heart disease, only partially compensate for the ICD9 item with the same number and title. As in the case of Association 139, a part of an ICD9 hypertensive disease is formed by the malignant hypertension of ICD8 (4001 - malignant hypertension with heart involvement). Another item brought to the association by the hypertensive heart disease of ICD9 is ICD8 item 412 Chronic ischemic heart disease. According to the ICD8 to ICD9 correspondence table, ICD8 item 412 links with three other ICD9 items: 412, 414, and 429. The correspondences of ICD9 item 412 bring ICD8 items 414 and 429 into the same association. Out of these, ICD9 item 414 also corresponds to ICD8 item 425, linked with another ICD9 item - 425 Cardiomyopathy. Apart from changes in the classification logic (as seen in malignant hypertension of ICD8), complex associations are thus mainly a mixture of splitting and joining several cross-linked ICD items.
Before proceeding to the next steps, the statistical continuity of each elementary association is checked and confirmed. We looked up the sums of all associations through the years 1968 to 1997. If the variation in the transition year exceeded the amplitude of a normal fluctuation within one ICD revision (“normal” fluctuation being defined as 2 standard deviations), the correspondences were re-examined and corrected if necessary by adding or suspending some links.
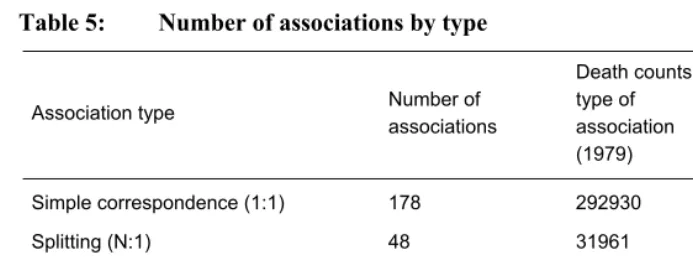
Table 5: Number of associations by type
Association type Number of associations
Death counts by type of
association (1979)
Proportions (%)
Simple correspondence (1:1) 178 292930 41,2
Splitting (N:1) 48 31961 4,5
Joining (1:N) 11 12682 1,8
Complex exchange (N:N) 67 373829 52,5
Total 304 711402 100
3.3 Transition coefficients
In simple associations (1:1) 100% of the old item corresponds to the new item. Also, if several ICD9 items join to form a single ICD8 item, then 100% of each ICD9 item joins to obtain the respective ICD8 item, which is a simple sum of all the ICD9 items in question. Conversely, if ICD9 is redistributed to the ICD8 structure, the ICD8 item is divided proportionally among the ICD9 items in 1979.
If one ICD9 item splits into several ICD8 items, the hypothetical distribution of deaths in 1978 according to ICD9 is obtained by applying the proportions of ICD8 items in 1978 to the death counts from the ICD9 item in 1979. Conversely, to obtain the ICD9 distribution in 1978 and backwards, we simply summarize 100% of each ICD8 item entering the association.
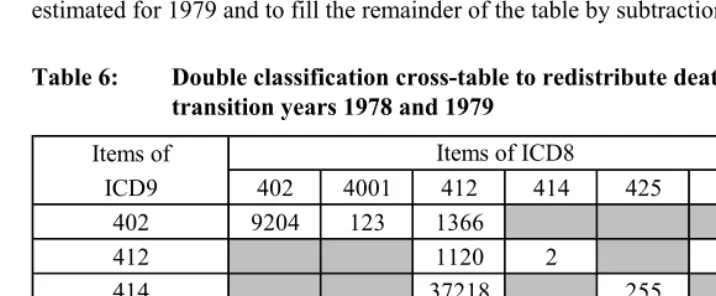
The following description refers to one of the 67 cases in which we dealt with complex exchanges between the items. Using Association 138 as an example, we will demonstrate how to estimate the percentages of death count exchange between the respective items. To do so, we first construct a double classification cross-table (Table 6).
subtract the known death counts from the death counts observed in 1979 (10,693 – 9,204 – 123 = 1,366). In some associations, only one cross-classification is possible. The selected example represents a case in which several redistribution variants are possible, as we cannot directly estimate the cross-classification of ICD8 items 412, 425, and 429. Here, we decided to first redistribute the deaths from the ICD9 items 414 and 429 proportionally to the hypothetical death counts of the corresponding ICD8 items estimated for 1979 and to fill the remainder of the table by subtraction.
Table 6: Double classification cross-table to redistribute deaths in the transition years 1978 and 1979
Items of Deaths in
ICD9 402 4001 412 414 425 429 1979
402 9204 123 1366 10693
412 1120 2 179 1301
414 37218 255 37473
425 130 906 1036
429 16412 449 16861
1979 (estimate) 9204 123 56116 2 385 1534 67364
1978 (real) 9042 121 55126 2 378 1507 66176
Items of ICD8
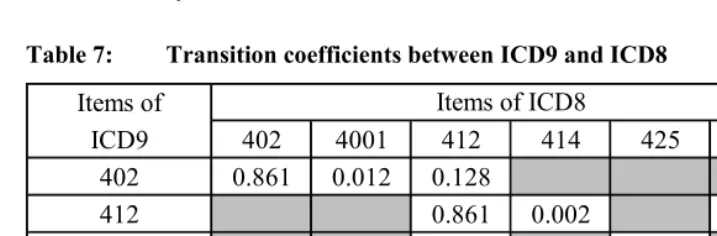
The table of transition coefficients (Table 7) is then directly derived from the completed cross table (Table 6). At this point, we can choose to redistribute the content of the ICD8 items to ICD9 or vice versa. If one classification is considerably less detailed than the other (as in our case 480 ICD8 items versus 892 ICD9 items), it is useful to first reclassify the deaths according to the “shorter” classification, the rationale being to obtain the double-classification by totaling rather than by dividing individual ICD items. Therefore, distinguishing neither age group nor sex, we first reclassified the deaths from the three post-transition years (1979-1981) into the terms of ICD8. Based on this “double coding”, we then calculated the coefficients of transition from ICD8 to ICD9 by age group and sex. These coefficients were then applied to calculate the time series between 1968 and 1978, under the assumption of time-constant cause-of-death distribution within the elementary associations. Keeping the coefficients constant may create systematic biases in the associations where the relative proportions of items change over time (as would be the case of association 153 after the year 1978).10 We
10 It is noteworthy that such weakness is also common to the reconstruction method based on the
have no means to measure the magnitude of such bias, but we minimize it by working with sufficiently detailed data.
Table 7: Transition coefficients between ICD9 and ICD8
Items of
ICD9 402 4001 412 414 425 429
402 0.861 0.012 0.128 1.000
412 0.861 0.002 0.138 1.000
414 0.993 0.007 1.000
425 0.125 0.875 1.000
429 0.973 0.027 1.000
Items of ICD8
Sum
3.4 Results
The following figures show the items of selected elementary associations before and after applying the transition coefficients.
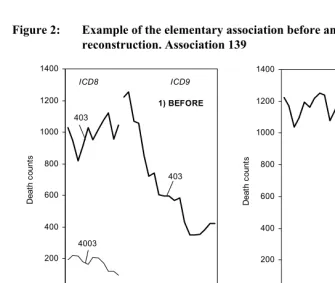
In Figure 2, the series for ICD9 item 403, Hypertensive renal diseases, is created by a simple sum of ICD8 items 403 and 4003, while most of the content comes from ICD8 item 403. Even though the curve is not perfectly smooth, the break at the time of the classification change does not exceed the fluctuations observed in ICD8.
Figure 2: Example of the elementary association before and after the reconstruction. Association 139
1) BEFORE
0 200 400 600 800 1000 1200 1400
1968 1973 1978 1983 1988 1993
D
eat
h c
oun
ts
ICD8 ICD9
4003 403
403
2) AFTER
0 200 400 600 800 1000 1200 1400
1968 1973 1978 1983 1988 1993
D
eat
h c
ount
s 403
ICD9
ICD8 items (1968-1978) ICD9 items (1979-1997) 403 Hypertensive renal disease 403 Hypertensive renal disease
Figure 3: Example of the elementary association before and after the reconstruction. Association 153
1) BEFORE 0 200 400 600 800 1000 1200 1400
1968 1973 1978 1983 1988 1993
D eat h c oun ts ICD8 ICD9 442 44a 443 446 447 448 2) AFTER 0 200 400 600 800 1000 1200 1400
1968 1973 1978 1983 1988 1993
D ea th c ount s 443 446 447 448 442 ICD9
ICD8 items (1968-1978) ICD9 items (1979-1997) 44a Remaining diseases of arteries, arterioles,
and capillaries 442 443 446 447 448 Other aneurysm
Other peripheral vascular disease Polyarteritis nodosa and allied conditions Other disorders of arteries and arterioles Disease of capillaries
Figure 4: Example of the elementary association before and after the reconstruction. Association 138
1) BEFORE 0 10000 20000 30000 40000 50000 60000 70000 80000
1968 1973 1978 1983 1988 1993
D ea th c oun ts 425 414 429 402 425 412 412 402 429 ICD8 ICD9 2) AFTER 0 10000 20000 30000 40000 50000 60000 70000 80000
1968 1973 1978 1983 1988 1993
D eat h c oun ts 429 402 425 412 ICD9 414
ICD8 items (1968-1978) ICD9 items (1979-1997) 402 4001 412 414 425 429
Hypertensive heart disease
Malignant hypertension with heart involvement Chronic ischemic heart disease
Asymptomatic ischemic heart disease Cardiomyopathy
Ill-defined heart disease
402 412 414
425 429
Hypertensive heart disease Old myocardial infarction Other forms of chronic ischemic heart disease
Cardiomyopathy
3.5 Age-specific treatment of time series
By default, we assume that exchanges take place with the same proportion across all age groups. In rare cases, however, specific age groups need to be treated separately. To identify and correct such breaks, the time series were examined by 5-year age groups.
Figure 5: Elementary association: before reconstruction (1), without age-specific correction (2) and after age-age-specific correction (3). Association 239
a) For all ages
1) ALL AGES: BEFORE
0 100 200 300 400 500 600 700
1968 1973 1978 1983 1988 1993
D eat h c ount s 759 759 758 ICD8 ICD9 75c 254 254
2) ALL AGES: WITHOUT AGE-SPECIFICCORRECTION 0 100 200 300 400 500 600 700
1968 1973 1978 1983 1988 1993
D eat h c ount s ICD9 254 758 759
3) ALL AGES: AFTER CORRECTION 0 100 200 300 400 500 600 700
1968 1973 1978 1983 1988 1993
D eat h c ount s ICD9 758 759 254
b) For age 0
2) AGE 0: WITHOUT AGE-SPECIFIC CORRECTION 0 100 200 300 400 500 600 700
1968 1973 1978 1983 1988 1993
D eat h c ou nt s ICD9 254 758 759
3) AGE 0: AFTER CORRECTION 0 100 200 300 400 500 600 700
1968 1973 1978 1983 1988 1993
Deat h c ount s ICD9 254 758 759
1) AGE 0: BEFORE
0 100 200 300 400 500 600 700
1968 1973 1978 1983 1988 1993
Figure 5: (Continued) c) For ages above 0
1) AGES ABOVE 0: BEFORE
0 100 200 300 400 500 600 700
1968 1973 1978 1983 1988 1993
Dea th c ount s 759 759 758
75c 254 254
ICD8 ICD9
3) AGES ABOVE 0: AFTER CORRECTION 0 100 200 300 400 500 600 700
1968 1973 1978 1983 1988 1993
Deat h c ou nt s ICD9 254 759 758 2) AGES ABOVE 0: WITHOUT
AGE-SPECIFIC CORRECTION 0 100 200 300 400 500 600 700
1968 1973 1978 1983 1988 1993
Dea th c ount s ICD9 254 759 758
ICD8 items (1968-1978) ICD9 items (1979-1997) 254
75c 759
Diseases of thymus gland
Other and unspecified congenital anomalies Congenital syndromes affecting multiple systems
254 758 759
Diseases of thymus gland Chromosomal anomalies Other and unspecified congenital anomalies
Figure 5 represents one of the cases in which different transitions apply for different age groups. According to the correspondence tables released by the Federal Statistical Office, there should be a 100% correspondence between the diseases of thymus gland in ICD8 and ICD9 (ICD8/ICD9 item 254). However, it is evident from first graph in row a) that in ICD8 many more deaths were classified under diseases of thymus gland than in ICD9. The age-specific inspection revealed that these excess deaths without continuation in ICD9 occurred only in infants (first graph in row b). For higher age groups the correspondence between the diseases of thymus gland in ICD8 and ICD9 was satisfying (first graph in row c). The continuation of the infant deaths from diseases of thymus gland under ICD8 was found in other and unspecified congenital anomalies of ICD9 (item 759).
254 will be transformed into ICD9 item 254. This procedure ensures smooth trends across all age groups.
4. Beyond the classification changes
The discontinuities introduced by the classification change are not the only difficulties involved in the study of cause-of-death patterns. Within one ICD revision, sudden or gradual changes in coding practices can appear. The sudden changes can be identified and corrected by exchanging a portion of deaths between the items in question during the last stage of the time-series reconstruction. The gradual changes, on the other hand, are neither easily identifiable nor correctable within the scope of the applied method.
4.1 Unique case of the emergence of AIDS
AIDS is the first example selected to demonstrate how the series were treated during the final corrections. The first deaths from AIDS emerged worldwide in the early 1980s and in the next few years the infection became a serious health threat. There was no category for AIDS in the original version of ICD9, but as the need for AIDS mortality surveillance was acute, WHO accepted - for the first time in the history of ICD - to modify the current classification before the release of the new revision. It did so in 1986 when releasing an addendum to the 9th revision (WHO 1986). Three new 3-digit items
were assigned to distinguish different forms of AIDS, namely item 042, Human immunodeficiency virus [HIV] disease, item 043, AIDS-related complex (ARC), and item 044, Other HIV infection. However, not all countries adopted this addendum when it was published. In West Germany, the new items entered the tabulation from 1989, following the recommendations of the Centres for Disease Control (CDC 1987).
Figure 6: Death counts from AIDS by 5-year age groups, both sexes, 1968-1997 Year A ge gr ou p 0 1 5 10 15 20 25 30 35 40 45 50 55 60 65 70 75 80 85 90
1968 1969 1970 1971 1972 1973 1974 1975 1976 1977 1978 1979 1980 1981 1982 1983 1984 1985 1986 1987 1988 1989 1990 1991 1992 1993 1994 1995 1996 1997
0 50 100 150 200 250 300 350 400 450
Figure 7: Death counts from Other and unspecified infectious and parasitic diseases by 5-year age groups, both sexes, 1968-1997
Year A ge gr oup 0 1 5 10 15 20 25 30 35 40 45 50 55 60 65 70 75 80 85 90
1968 1969 1970 1971 1972 1973 1974 1975 1976 1977 1978 1979 1980 1981 1982 1983 1984 1985 1986 1987 1988 1989 1990 1991 1992 1993 1994 1995 1996 1997
Figure 6 and Figure 7 show how we identified deaths from AIDS in West Germany using age-specific visual inspection. While the ICD9 item 279 showed virtually no increase in death counts (not shown here), the gradual emergence of middle-age deaths in ICD9 item 136 Other and unspecified infectious and parasitic diseases between 1984 and 1988 (Figure 7) matches exactly the age structure of AIDS mortality. Unlike other countries, West Germany thus classified AIDS, from the beginning, in the chapter of infectious diseases.
We extrapolated the AIDS series backwards by redistributing the excess deaths from ICD9 item 136 by 5-year age groups. The resulting pattern provides a more accurate image of the actual AIDS mortality in West Germany, as well as the corrected trend for ICD9 item 136 Other and unspecified infectious and parasitic diseases (Figure 8).11
Figure 8: Number of deaths related to HIV infection before and after ex-post correction 1) BEFORE 0 200 400 600 800 1000 1200 1400 1600 1800
1979 1984 1989 1994
D eat h c ount s 042 044 043 136 2) AFTER 0 200 400 600 800 1000 1200 1400 1600 1800
1979 1984 1989 1994
D eat h c ount s 136 042 044 043 ICD9 items:
042 Human immunodeficiency virus [HIV] disease 043 AIDS-related complex (ARC)
044 Other HIV infection
136 Other infectious and parasitic diseases
11 Most of the excess content of the ICD9 item n° 136 was assigned to item n° 042. The corrections were
4.2 Sudden changes in coding practices
Apart from AIDS-related exchanges, other 16 ICD9 items were corrected. We will focus on two exchanges in more detail.
In West Germany, many breaks subject to such ex-post corrections occurred in the years close to the classification change, suggesting that there were initial discordances related to the adoption of the new revision and its coding rules.
Figure 9: Number of deaths from ICD9 item 485 Bronchopneumonia, organism unspecified and ICD9 item 486 Pneumonia, organism unspecified, before and after the ex-post correction
1) BEFORE
0 2000 4000 6000 8000 10000 12000 14000 16000 18000
1968 1973 1978 1983 1988 1993
D
eat
h c
oun
ts
485 Bronchopneumonia, organism unspecified
486 Pneumonia, organism unspecified
2) AFTER
0 2000 4000 6000 8000 10000 12000 14000 16000 18000
1968 1973 1978 1983 1988 1993
D
eat
h c
ount
s
485 Bronchopneumonia, organism unspecified
Figure 10: Number of deaths from ICD9 item 427 Cardiac disrhythmias and ICD9 item 421 Old myocardial infarction, before and after the ex-post correction
1) BEFORE
0 2000 4000 6000 8000 10000
1968 1973 1978 1983 1988 1993
D
eat
h c
ount
s
427 Cardiac dysrhythmias
412 Old myocardial infarction
2) AFTER
0 2000 4000 6000 8000 10000
1968 1973 1978 1983 1988 1993
D
ea
th c
oun
ts
412 Old myocardial infarction 427 Cardiac dysrhythmias
Figure 9 shows a situation related to the adoption of the 8th ICD revision in 1968.
For the first two years of ICD8, the reconstructed ICD9 item 486, Pneumonia, organism unspecified, contained no deaths. In 1970, the death counts suddenly rose from 0 to 11,987, while the number of deaths classified under ICD9 item 485, Broncho-pneumonia, organism unspecified, dropped from 17,591 in 1969 to 6,957 in 1970, perfectly coinciding with an increase in pneumonia of unspecified etiological agents. We corrected this break by exchanging the deaths between these categories across all age groups.
A similar kind of exchange, but for the first year of ICD9, was required for ICD9 item 427, Cardiac disrhythmias and ICD9 item 412, Old myocardial infarction, transferring the deaths for age 35 and above (Figure 10). In this case, the correction was made only to the first year of ICD9.12
12 A summary table of all corrections applied ex-post to the German series is given in a working paper
4.3 Gradual change in coding practices
In the case of certain diseases, the observed mortality trend does not truly reflect the evolution of the disease itself, i.e. we cannot distinguish whether the rise or fall is the result of a real change in the disease incidence or rather a consequence of better knowledge of the etiology and the clinical course of the disease. A well known case is ICD9 item 331.0, Alzheimer’s disease, which was practically unknown prior to the 1980s but quickly became a frequent cause of death among the elderly in France (Vallin and Meslé 1996).
Figure 11: Number of deaths from ICD9 item Other cerebral degenerations (incl. Alzheimer’s disease), both sexes combined
0
1000
2000
3000
4000
Deaths
1970 1980 1990 2000
year
5. Unknown and ill-defined causes of death
For various reasons, a share of deaths have no specific diagnosis. The ICD provides specific categories for these cases in Chapter XVI entitled “Symptoms, signs, abnormal results of laboratory or other investigative procedures, and ill-defined conditions regarding which no diagnosis classifiable elsewhere is recorded”.13 In terms of
interpretation, the percentage of ill-defined causes provides a proxy measure of the data quality and points up specific diagnostic or coding-related problems.14
In Chapter XVI, three items are statistically most important: item 797, Senility, item 798, Sudden death from unknown cause, and item 799, Other ill-defined and unknown causes of morbidity and mortality. The death counts from these categories are shown in Figure 12, along with remaining ill-defined diseases.
There was a remarkable drop in deaths with senility as the (only) underlying cause in the 1970s, while since the 1980s the death counts have stabilized. This finding thus excludes senility as a possible source for the increasing number of deaths from Alzheimer’s disease, which started to increase only after the stabilization of senility death counts in the 1980s.
Sudden death from unknown cause is typical of an exceptional differential between age 0 and the rest of the age scale. For age groups above 0, the proportion of deaths from this cause rarely exceeds 1%, while at age 0, sudden unexplained deaths (referred to as SIDS – sudden infant death syndrome, or cot death15) represent the
second leading single cause of death in infants (26% for males and 23% for females compared to overall infant mortality). Sudden deaths at age 0 also form a decisive part of the whole item 798. Moreover, unlike for the rest of Chapter XVI, sudden infant death represents a specific condition whose etiology and prevention are the subject of intensive research.
13 Moreover, within each ICD chapter there is a category for ill-defined conditions within the given group of
diseases.
14 Between 1968-1997 the proportion of ill-defined causes (ICD9 items 780-799) in West Germany dropped
from 3.0% to 2.8% for males and from 4.2 to 2.9% for females.
15 “Cot death” is a term commonly used to describe sudden and unexpected infant death that is initially
Figure 12: Number of deaths for the three most common ill-defined causes of death: item 797 (Senility), item 798 (Sudden death) and item 799 (Cause unknown), and the remaining ill-defined causes 780-796, both sexes combined
Senility
Cause unknown
Sudden death
Other ill−defined
0
5000
10000
15000
20000
Deaths
1970 1980 1990 2000
year
Contrasting with the overall decrease in numbers of deaths in the two above-mentioned ill-defined categories is the continuous rise in deaths from unknown cause (ICD9 item 799). An age-sex-specific analysis (not shown here) revealed that this trend is driven mainly by deaths of middle-aged men, suggesting that there could be problems related to registration of accidental and violent deaths. With the present data, however, we are not able to detect specific diagnostic or legal problems behind these unfavourable trends.
5.1 The redistribution of ill-defined causes of death
We have chosen to redistribute the ill-defined deaths proportionally into well-defined diseases (001-779) and into accidents (E800-E999). The proportional method is fully applicable to West Germany, where the share of ill-defined deaths is relatively low, the era of epidemics has passed and the time series do not show any major fluctuations. Moreover, several redistribution methods (proportional and regression method inspired by Ledermann (1955)16 were tested on West German data from
1981-1983 and the author concluded that the choice of method had only a minor impact on the redistribution result (Bubenheim 2000).
Applying the method of proportional redistribution, we assume that every death can be attributed to a disease or an accident listed in ICD9 and, consequently, if the death, for some reason, was not classified as ill-defined, it would have been classified under one of the ICD9 categories. At the same time, the method assumes that the decision to classify the death as ill-defined or not is independent of its real underlying cause (Bubenheim 2000). These assumptions are hardly true for age 0, where sudden infant death syndrome occupies the key position in infant mortality and is generally accepted as a single cause of death. Therefore, the deaths from item 798 are not redistributed for the first year of life.
Apart from the chapter dedicated to ill-defined diseases, additional ill-defined conditions are included in several regular ICD9 chapters. The most important of these categories is ICD9 item 429 Ill-defined descriptions and complications of heart disease (shown on Figure 4). The death counts in the ICD9 category 429 decreased rapidly from 17,743 in 1980 to 4,020 in 1997, while the numbers of deaths from the remaining cardiovascular diseases in the association 138 increased. Like for the ill-defined diseases in Chapter XVII, such relatively large fluctuations may influence the trends and limit the informative value of the data, reconstructed or not. However, at this stage, we decided not to redistribute these ill-defined conditions into other categories of the appropriate chapter. First of all, apart from ICD9 item 429, they are negligible in death counts. Second, the assumption of independence between coding to well-defined and ill-defined conditions of one chapter is disputable. To give an example: the irregularity of the ICD9 429 trend probably arises from a change in coding instructions – as of 1980, a part of the ICD9 429 deaths were to be coded to another category. With the present data, we are not able to reveal the exact character of this interchange and therefore prefer to avoid speculations and leave the data as they are. This issue can be better examined in the framework of in-depth studies on cardiovascular diseases.
6. Conclusion
The statistical continuity of the West German cause-of-death data was affected by changes in the tabulation system in 1969 and 1980, but these discontinuities are minor compared to the disruption introduced with adoption of the 9th ICD revision in 1979.
The presented work resulted in production (and publication) of continuous time series – the set of age-sex-cause specific data without breaks nor inconsistencies, covering the years between 1968 and 1997.
The main part of the study dealt with the methodology of reconstructing the time series, focusing on specific problems of the ex-post double classification and the question of the medical content of the ICD categories. All stages of reconstruction work were described and accompanied by practical examples of problems encountered and solutions applied. Some causes of death required special treatment due to the change in coding instructions. This happens more frequently shortly after introducing a new classification, while in rarer cases corrections are needed when a new disease is introduced, as was the case of AIDS. Thus, although the principles of the method can be applied universally (including countries not using ICD), the specific problems will vary from country to country due to persisting variance in reporting and coding practices. Obviously, such problems can be detected solely by systematic inspection of the time series on a detailed level.
A novel feature of the presented work is the application of the method to 3-digit ICD items. In earlier studies, the authors used either grouped items (United Kingdom, Netherlands), or the most detailed 4-digit level (France), or the transition was performed on a classification other than ICD (countries of ex-USSR). As the 3-digit level is the usual level of detail provided by the national statistical offices (and the detail compulsory for reporting to WHO), the results of this work could serve as a guideline for future reconstruction attempts in other countries where the double codification between ICD8 and ICD9 is missing.
population and to analyse the factors behind the plasticity of mortality observed in East Germany shortly after unification.
West and East Germany were separated between 1949 and 1989. Until the early 1970s, mortality in both countries followed similar levels and trends (Gjonça, Brockmann, and Maier 2000). Later on, an East-West gap began to emerge, resulting in a difference of 2.6 years of life expectancy at birth for women and 2.4 years of difference for males just before reunification in 1989. Up to 2006, this difference was rapidly reduced to less than 1 year for females and to 1.2 years for males.
Studies addressing the widening and subsequent narrowing of the east-west mortality gap in Germany either worked on all-cause mortality (Gjonça, Brockmann, and Maier 2000), or aggregated the diseases into broad categories (Nolte, Shkolnikov, and McKee 2000). A large part of the gap has been explained as due to differences in medical care and public health, but this hypothesis has never been tested on detailed cause-of-death data in a longer term perspective.
The West Germany dataset produced here is the first piece of the puzzle connecting the information from cause-of-death data with the trends observed on both sides of the iron curtain between East and West Germany. The second piece, a continuous series for East Germany, is under construction. Its future addition will allow us to study the health deterioration which occurred under the communist regime and to identify which causes of death were the most sensitive to the adoption of a new health care system and to new socioeconomic conditions, both factors being relevant for the questions of public health and the concepts of causes amenable to medical care.
Another future extension of the present work is the updating of the series to the 10th revision of ICD, which has already been in use for a decade (it was adopted in
Germany in 1998). The ICD10 represents another big challenge in cause-of-death studies. It establishes a new tabulation system and a new set of coding rules, and has ambitions to become a “stable and flexible classification which would not require revisions for many years to come” (WHO 1993:122). Therefore, more than ever in the past, the question of bridging the current and the previous classification deserves close attention.
7. Acknowledgements
author is also grateful to Vladimir Shkolnikov for valuable comments and efficient support.
The author wishes to express very special thanks to France Meslé and Jacques Vallin from INED (Institut National d’Études Démographiques), who were continuously consulting the results of the work and reviewed the interim version of this report.
References
Bubenheim, M. (2000). Des systèmes d'enregistrement des décès par cause en France et en Allemagne. [PhD Thesis]. Lyon: Université Lumière.
CDC (1987). Human immunodeficiency virus (HIV) infection codes. Official authorized addendum. ICD-9-CM (Revision No. 1). Effective January 1, 1988. Atlanta: Center for Disease Control and Prevention. (Morbidity and Mortality Weekly Report; S-7).
DESTATIS (2005). Grundlagen der Todesursachenstatistik [electronic resource]. Wiesbaden: Statistisches Bundesamt Deutschland. http://www.destatis.de/ jetspeed/portal/cms/Sites/destatis/Internet/DE/Content/Statistiken/Gesundheit/To
desursachen/content75/Todesursachen,property=file.pdf.
Gjonça, A., Brockmann, H., and Maier, H. (2000). Old-Age mortality in Germany prior to and after Reunification. Demographic Research 3(1).
doi:10.4054/DemRes.2000.3.1.
Meslé, F. (1995). L'enregistrement des causes de décès en Europe. In: Duchêne, J. and Wunsch, G. (eds.). Collecte et comparabilité des données démographiques et sociales en Europe. Louvain-la-Neuve: Academia/L'Harmattan: 401-431. Meslé, F., Shkolnikov, V., Hertrich, V., and Vallin, J. (1996). Tendances récentes de la
mortalité par cause en Russie 1965-1994: la crise sanitaire dans les pays de l'ex-URSS. Paris: INED (Données statistiques No. 2).
Meslé, F. and Vallin, J. (1993). Causes de décès: de la 8e à la 9e révision, deux cas différents, la France et l'Angleterre. In: Blum, A. and Rallu, J.-L. (eds.).
Démographie Européenne. II. Dynamiques Démographiques. Paris: John
Libbey, INED: 421-445.
Meslé, F. and Vallin, J. (2003). Mortalité et causes de décès en Ukraine au XXe siècle. Paris: INED (Les Cahiers de l'INED).
Nolte, E., Shkolnikov, V., and McKee, M. (2000). Changing mortality patterns in East and West Germany and Poland. I: long term trends (1960-1997). Journal of
Epidemiology and Community Health 54(12): 890-898.
doi:10.1136/jech.54.12.890.
Pechholdová, M. (2008). Reconstruction of continuous series of mortality by cause of death in West Germany for the years 1968-1997. Rostock: Max Planck Institute for Demographic Research (MPIDR working paper; WP 2008-009).
Vallin, J. and Meslé, F. (1988). Les causes de décès en France de 1925 à 1978. Paris: PUF, INED (Travaux et documents; 115).
Vallin, J. and Meslé, F. (1996). Comment suivre l'évolution de la mortalité par cause malgré les discontinuités de la statistique ? le cas de la France de 1925 à 1993. Paris: INED (Dossiers et recherches; 53).
WHO (1986). International Classification of Diseases, Ninth Revision. Clinical Modification. Vol. 1 and 2 update. HTLV-III/LAV Infection codes. Official Authorized Addendum. Geneva: WHO.
WHO (1993). International Statistical Classification of Diseases and Related Health Problems, Tenth Revision, Volume 2: Instruction Manual. Geneva: WHO. Wolleswinkel-van Den Bosch, J.H., Van Poppel, F.W.A., and Mackenbach, J.P. (1996).
Reclassifying causes of death to study the epidemiological transition in The Netherlands, 1875-1992. European Journal of Population 12(4): 327-361.