DEMOGRAPHIC RESEARCH
VOLUME 28, ARTICLE 25, PAGES 713-732
PUBLISHED 4 APRIL 2013
http://www.demographic-research.org/Volumes/Vol28/25/ DOI: 10.4054/DemRes.2013.28.25
Research Article
What has high fertility got to do with the low
birth weight problem in Africa?
Ivy A. Kodzi
Øystein Kravdal
© 2013 Ivy A. Kodzi & Øystein Kravdal.
This open-access work is published under the terms of the Creative Commons Attribution NonCommercial License 2.0 Germany, which permits use, reproduction & distribution in any medium for non-commercial purposes, provided the original author(s) and source are given credit.
1 Introduction 714 2 Determinants of birth weight and estimation strategy 715
3 Methods 717
3.1 Sample selection 717
3.2 Estimation 718
4 Results 721
5 Discussion and conclusions 724
6 Acknowledgements 725
References 726
What has high fertility got to do with the low birth weight problem
in Africa?
Ivy A. Kodzi1
Øystein Kravdal2
Abstract
BACKGROUND
There has been much concern about adverse individual and societal consequences of high fertility in sub-Saharan Africa. One concern is that children of high birth orders may have low birth weight. However, the evidence for such an effect is not strong. OBJECTIVE
Our objective is to investigate whether a woman’s high parity status might increase her risks of having a baby with low birth weight.
METHODS
Pooling 60 Demographic and Health Surveys data-sets from 32 sub-Saharan countries, we selected children of mothers who had at least two births of order two or higher within the five years preceding the surveys. We modeled the probability of having a child with low birth weight and controlled for all mother-specific, household, or community characteristics that are constant over the period of analysis, by including fixed-effects for the mother. We also controlled for salient factors including sex, maternal age, preceding birth interval, and whether prenatal care was received.
RESULTS
We found no adverse effect of increasing parity on the odds of having a child with low birth weight at normative ranges; such effects only manifest at extremely high parities - nine or more children. At moderately high parities, the chance of low birth weight is actually lower than at very low parities.
CONCLUSIONS
While high fertility may lead to various adverse outcomes for African families, low birth weight appears not to be among these outcomes. Other factors, such as adolescent childbearing, poverty, and inadequate prenatal care may be more important determinants of low birth weight in Africa.
1. Introduction
An infant’s birth weight is determined by the amount of growth during pregnancy and the eventual gestational age – factors which are related to the infant’s own genetic makeup, the mother’s genetic makeup, her lifestyle, and her overall health (UNICEF 2004; Wilcox 2001). Very small neonates, particularly those weighing less than 2.5 kilograms (5.5 pounds) at birth, are characterized by poor health outcomes in later life. In particular, a child born with low birth weight is less prepared to fight infections due to its weaker immune system and is therefore more predisposed to infectious diseases such as diarrhea and respiratory infections (Ballot et al. 2010). For this and other reasons, children with low birth weight also tend to have high mortality. In addition, surviving low birth weight babies have higher risks of chronic diseases, inhibited cognitive development, and cardiac and metabolic disorders in adulthood; all of which may reduce their economic productivity (Bryce and Requejo 2008; Black, Devereux, and Salvanes 2005; Barker 2004; Black, Morris, and Bryce 2003; Barker et al. 2002; Wilcox 2001; Godfrey and Barker 2001; Ashworth 1998; Barker 1992; Low, Handley-Derry, and Burke 1992).
have low birth weight according to a conservative estimate (Blanc and Wardlaw 2005; UNICEF 2004). In deprived settings like sub-Saharan Africa, the daily physical labor, poor nutrition, poor sanitation, and inadequate health care availability and access generally result in mothers having poor health and inadequate pregnancy care (UNICEF 2004). Poor mothers in these settings are also exposed to indoor air pollutants through the use of poorer quality cooking fuel (Mishra et al. 2004). Nonetheless, there are only a few studies (often localized) from this region about the importance of parity for birth weights (Ozumba and Igwebe 1992; Oni 1986; Simpkiss 1968), none of them using this type of approach. We use pooled data on children born in the five years preceding 60 Demographic and Health Surveys (DHS) from 32 sub-Saharan African countries.
We proceed with an overview of the determinants of birth weight, describe the data and our analytical approach, present the results, and conclude with a discussion of the main findings.
2. Determinants of birth weight and estimation strategy
Birth weights below 3000g are considered sub-optimal, with the lower extreme end, below 2500g (5.5lb), having the most documented adverse health outcomes. On the upper end of the birth weight distribution, birth weights over 4000g are associated with increased maternal morbidity, complicated labor, and maternal death. Outcomes at the lower end of the birth weight scale most likely reflect intrauterine growth deprivation or conditions leading to preterm delivery, while the upper end reflects unusual fetal growth. Thus, there is an optimum birth weight range associated with trouble-free delivery, where neonatal survival is maximized and maternal death is minimized. Undeniably, the child’s genetic makeup affects the birth weight. In addition, the intrauterine environment is a critical determinant, as demonstrated for example in studies where embryos have been transferred to different mothers (Rice and Thapar 2010; Brooks et al. 1995).
mentioned (Cramer 1995). To elaborate on the latter effect, it has been shown in sub-Saharan Africa as well as other developing parts of the world, that poverty, low education, and women’s lack of autonomy are related to limited or late initiation of obstetric care, irregular or incomplete immunization (e.g. against Tetanus infection), poor nutrition, and micronutrient supplementation during pregnancy (Spangler and Bloom 2010; Fotso, Ezeh, and Essendi 2009; Magadi, Agwandad, and Obare 2007; Onah, Ikeako, and Iloabachie 2006; Magadi, Madise, and Diamond 2001; Prentice et al. 1983). In addition, the length of the earlier birth intervals (those who have had many children are likely to have had them in short intervals) is important. A birth interval below two years tends to be a risk factor for a preterm or low birth weight delivery (Conde-Agudelo, Rosas-Bermudez, and Kafury-Goeta 2006; Smith, Pell, and Dobbie 2003; Zhu 2005; Zhu et al. 2001; Rawlings, Rawlings, and Read 1995).
Furthermore, some studies have shown that birth weights tend to be low at very low parities (Wilcox 2001) and then increase with parity up to a certain level, after which the marginal increases begin to dwindle and eventually give way to declines (Phung et al. 2003; Wilcox, Chang, and Johnson 1996; Cogswell and Yip 1995; Seidman et al. 1988). The exact parity level at which birth weights begin to decline appears to be context-specific and has not been widely studied (see MacLeod and Kiely 1988, for example). A possible reason for this negative effect of birth order on the birth weight is that the mother’s health may have been weakened as a result of many pregnancies and years of caring for children. This idea is somewhat medically supported in that it is believed that the growth of the baby during pregnancy is affected by the mother’s levels of hormones and insulin-like growth factors; which tend to reduce at very high parities (D’Ercole and Ye 2008; Skalkidou et al. 2003; Beyer 1999; Reece et al. 1994; Panagiotopoulou et al. 1990; Maccoby et al. 1979).
necessarily a problem, however, as these factors have causal positions that are quite ambiguous. For example, women suffering from certain chronic diseases may not want or be able to have many children. If this is the case, maternal health status should be controlled for. On the other hand, poor health may be the result of having been through many pregnancies and having many children to care for. Likewise, maternal pre-pregnancy and pre-pregnancy-related weight gain may reflect past pre-pregnancy and childcare experiences. In other words, maternal weight and health status may be factors that parity may operate through (at least partially) in affecting the birth weight, and should not necessarily be controlled for.
3. Methods
3.1 Sample selection
3.2 Estimation
The fixed-effects logit model is as follows:
log � 𝑃𝑖𝑗
1 − 𝑃𝑖𝑗� = 𝛽𝑀𝑖𝑗+ 𝛿𝑋𝑖𝑗+ 𝜇𝑖
where Pij is the probability that the child i (index of the child within the five-year
observation window) of mother j has low birth weight, Mij is a vector of birth order
dummies (to allow for a flexible pattern in the relationship between birth order and birth weight rather than, for example, a linear effect), and Xij is a vector of other related
factors. β and δ are the corresponding coefficients. The X vector includes the sex of the child, maternal age at birth, preceding birth interval (in months), and whether or not the mother had prenatal services during the pregnancy. The latter may generally reflect access to health facilities, which has implications both for fertility and birth weight. One might argue that the variable is also to some extent influenced by parity and thus a causally-intermediate factor. However, this is not a critical issue, as its inclusion had only minor impact on the parity-effect estimates (not shown in the tables). The unobserved constant mother-level characteristics are represented by μj. Only mothers
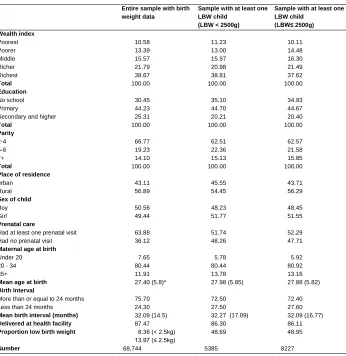
Table 1: Percent distribution of variables in pooled sample of births in the five years before DHS surveys
Entire sample with birth weight data
Sample with at least one LBW child
(LBW < 2500g)
Sample with at least one LBW child
(LBW≤ 2500g) Wealth index
Poorest 10.58 11.23 10.11
Poorer 13.39 13.00 14.48
Middle 15.57 15.97 16.30
Richer 21.79 20.98 21.49
Richest 38.67 38.81 37.62
Total 100.00 100.00 100.00
Education
No school 30.45 35.10 34.93
Primary 44.23 44.70 44.67
Secondary and higher 25.31 20.21 20.40
Total 100.00 100.00 100.00
Parity
2-4 66.77 62.51 62.57
5-6 19.23 22.36 21.58
7+ 14.10 15.13 15.85
Total 100.00 100.00 100.00
Place of residence
urban 43.11 45.55 43.71
Rural 56.89 54.45 56.29
Sex of child
Boy 50.56 48.23 48.45
Girl 49.44 51.77 51.55
Prenatal care
Had at least one prenatal visit 63.88 51.74 52.29
Had no prenatal visit 36.12 48.26 47.71
Maternal age at birth
Under 20 7.65 5.78 5.92
20 - 34 80.44 80.44 80.92
35+ 11.91 13.78 13.16
Mean age at birth 27.40 (5.8)* 27.98 (5.85) 27.88 (5.82)
Birth Interval
More than or equal to 24 months 75.70 72.50 72.40
Less than 24 months 24.30 27.50 27.60
Mean birth interval (months) 32.09 (14.5) 32.27 (17.09) 32.09 (16.77)
Delivered at health facility 87.47 86.30 86.11
Proportion low birth weight 8.36 (< 2.5kg) 13.97 (≤ 2.5kg)
48.69 48.95
Number 68,744 5385 8227
4. Results
Table 1 provides the descriptive information on the demographic and socioeconomic characteristics, as well as the prevalence of low birth weight for the entire sample of children with birth weights and the two fixed-effects sub-samples. The distribution of the two fixed effects samples differed slightly from the general sample in a few areas. The children in the fixed effects samples had mothers who were slightly less educated (35 percent had no formal schooling compared to 30 percent in the entire sample). These mothers were also of higher parities and were less likely to have had prenatal care during pregnancies. By design, the proportion of children with low birth weight in the fixed effects sub-samples was much higher (48 and 49 percent in the samples with low birth weight defined as < 2500g and ≤ 2500g respectively) than in the whole sample, where it ranged from 8 percent to 14 percent depending on the definition applied.
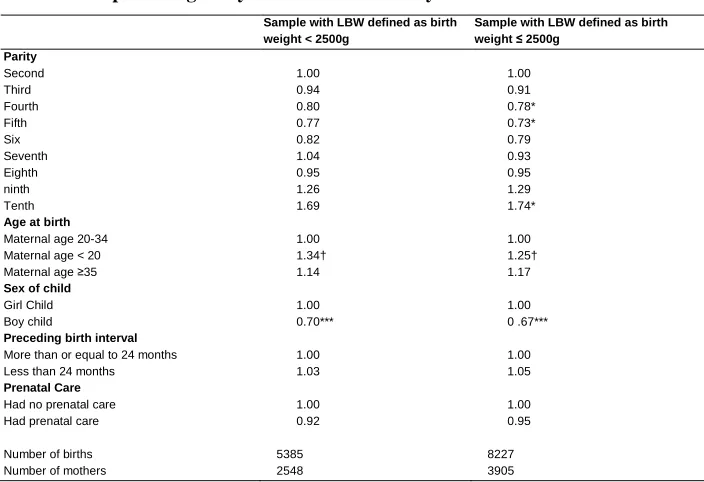
Table 2: Fixed-effects logistic regression model predicting the occurrence of
low birth weight among pooled DHS samples of children born in the preceding five years before the surveys
Sample with LBW defined as birth weight < 2500g
Sample with LBW defined as birth weight ≤ 2500g
Parity
Second 1.00 1.00
Third 0.94 0.91
Fourth 0.80 0.78*
Fifth 0.77 0.73*
Six 0.82 0.79
Seventh 1.04 0.93
Eighth 0.95 0.95
ninth 1.26 1.29
Tenth 1.69 1.74*
Age at birth
Maternal age 20-34 1.00 1.00
Maternal age < 20 1.34† 1.25†
Maternal age ≥35 1.14 1.17
Sex of child
Girl Child 1.00 1.00
Boy child 0.70*** 0 .67***
Preceding birth interval
More than or equal to 24 months 1.00 1.00
Less than 24 months 1.03 1.05
Prenatal Care
Had no prenatal care 1.00 1.00
Had prenatal care 0.92 0.95
Number of births 5385 8227
Number of mothers 2548 3905
The coefficients for the birth order dummy variables in the fixed-effects regressions in Table 2 show that the odds of low birth weight decrease with parity (significant only when low birth weight includes 2500g) and then increase at parities beyond eight (also significant only with this definition). We also note that the effects of the control variables were in the expected direction. Boys had significantly less risk of low birth weight than girls. Births during adolescence had significantly higher risks than between ages 20 and 34. When a mother had at least one prenatal visit during the pregnancy and birth intervals greater than 24 months, she had lower risks of having a child with low birth weight.
Can we generalize from these results?
As mentioned earlier, children with reported birth weights are not representative of all children in these countries. This could have the consequence that the effects of parity that we estimate are different from those we would have found if all children could be included. More specifically, such a bias would arise if the effect of parity on birth weight varies with certain factors that also affect the chance of being weighed. One such factor could be the socio-economic resources in the household. The relatively rich may, to a larger extent, be able to raise many children without experiencing the deterioration of the mother’s health that might reduce the birth weight of later children, and they would also be more likely to give birth in hospitals and thus have their children weighed. In that case, we would see a less adverse effect of very high parity in our analysis than the one existing in the general population. To get an impression of the importance of these selection problems, we estimate the fixed effects models separately for various sub-samples of women who have different chances of having their children weighed at birth.
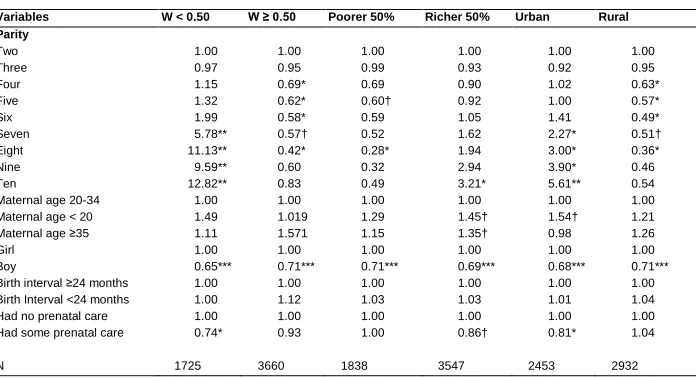
This analysis step includes three slightly different versions. In one, we consider rich and poor women. As mentioned, there are relatively many poor among those who are not included in our sample. In other words, if we could have included all children, we would have had a larger proportion of poor than we actually have in our sample, and the estimates would have been influenced by the greater number of poorer women. When we group the women into those among the 50% richest and those among the 50% poorest3, we see that there are more beneficial effects of moderately high parity and less adverse effects of very high parity among the latter according to the fixed effects model (3rd and 4th column of Table 3). This pattern is contrary to what was suggested
3 We calculated the relative wealth status of the mothers from household possessions and amenities using the
above, and we do not see any obvious explanation. Selection might, for example, be involved: the very few who have many children in spite of being rich may have certain characteristics that also lead to low birth weights. Whatever the explanation, however, the conclusion is that with a more representative sample, the estimates would have been more like what we see among the poorer women. In other words, it seems that we underestimate the advantage at moderate parities and overestimate the disadvantage at very high birth orders. (This argument hinges on the assumption that the difference between the top 50% richest and bottom 50% in our sample is representative of the difference between the rich and the poor in the entire population, i.e. that the same factors affect the chance of having a child weighed among the rich as among poor, or that – if there are such differences – the factors also have different effects on the birth weight.) The second version of our attempt to shed light on the selection problem, which considers the rural-urban distinction (5th and 6th column), leads to a similar conclusion: the over-representation of urban women in our sample seems to cause overestimation rather than underestimation of the adverse effect of high parity.
Table 3: Fixed effects regression results showing odds of low birth weight
(<2500g) by “probability missing, W”, relative wealth, and place of residence
Variables W < 0.50 W ≥ 0.50 Poorer 50% Richer 50% Urban Rural Parity
Two 1.00 1.00 1.00 1.00 1.00 1.00
Three 0.97 0.95 0.99 0.93 0.92 0.95
Four 1.15 0.69* 0.69 0.90 1.02 0.63*
Five 1.32 0.62* 0.60† 0.92 1.00 0.57*
Six 1.99 0.58* 0.59 1.05 1.41 0.49*
Seven 5.78** 0.57† 0.52 1.62 2.27* 0.51†
Eight 11.13** 0.42* 0.28* 1.94 3.00* 0.36*
Nine 9.59** 0.60 0.32 2.94 3.90* 0.46
Ten 12.82** 0.83 0.49 3.21* 5.61** 0.54
Maternal age 20-34 1.00 1.00 1.00 1.00 1.00 1.00
Maternal age < 20 1.49 1.019 1.29 1.45† 1.54† 1.21
Maternal age ≥35 1.11 1.571 1.15 1.35† 0.98 1.26
Girl 1.00 1.00 1.00 1.00 1.00 1.00
Boy 0.65*** 0.71*** 0.71*** 0.69*** 0.68*** 0.71***
Birth interval ≥24 months 1.00 1.00 1.00 1.00 1.00 1.00
Birth Interval <24 months 1.00 1.12 1.03 1.03 1.01 1.04
Had no prenatal care 1.00 1.00 1.00 1.00 1.00 1.00
Had some prenatal care 0.74* 0.93 1.00 0.86† 0.81* 1.04
N 1725 3660 1838 3547 2453 2932
The third version can be seen as a generalization of the two others. We first estimated a model for the chance that a mother does not have her child weighed at birth. This model included the following variables: her relative wealth position, educational level, and whether she lives in an urban area or not. Using the estimated coefficients, we predicted the chance W of not having the child weighed for each mother included in our fixed-effects analysis (that is for those whose children were actually weighed). We then estimated the fixed-effects models for subgroups of women with different levels of W to see if there were different estimates at lower levels of W than at higher levels. The results are shown in the 2nd and 3rd columns of Table 3 for two groups, W < 0.5 and W ≥ 0.5. We see that, when there is a high chance of not having a child weighed, there are stronger advantages at moderately high parities or birth orders and less adverse effects of very high parity. Therefore, if more children could have been included in our analysis, the estimates would have moved in this direction, just as concluded based on the distinctions between rich and poor and between urban and rural.
5. Discussion and conclusions
In this study, we explored the relationship between a woman’s parity and her chances of having a child with low birth weight. The data were based on a pooled sample of births of mothers who had multiple births in the five years preceding African DHS surveys. Our fixed-effects regression models controlled for all stable characteristics of the mother, including the average amount of socioeconomic resources over the five-year observation period, as well as some time-varying or child-specific factors. The results show a pattern of decreasing risk of low birth weight deliveries comparing birth orders 3-8 to second births, followed by an increase at higher birth orders. This was seen most clearly when low birth weight was defined to include 2500g. A decline at moderate parities has also been reported in earlier studies, though there is always doubt about whether these studies adequately controlled for joint determinants of fertility and birth weight.
relatively small fraction of births in these populations. Our attempts to understand the implications of the selective nature of the birth weight data on our estimates suggest that we may have overestimated the adverse effects of very high parities and underestimated the advantage at more moderate levels.
There are very few women in sub-Saharan Africa who have nine or more children, so unless the estimates are strongly biased downwards by unobserved time-varying factors, it seems that the low birth weight problem in sub-Saharan Africa is not a consequence of the prevalent high fertility in the region. On the contrary, the large proportion of births of moderately high orders in sub-Saharan Africa may serve to reduce the average chance of low birth weight in these populations. In other words, while high fertility may well lead to various adverse outcomes for African families and societies (which has been the impetus for many population policies over the years), low birth weight appears not to be among these outcomes.
Poverty and low levels of education, which have been shown to be important determinants in other contexts (Janevic et al. 2010, Collins et al. 2009; Conley and Bennett 2001), are probably more important reasons for the high prevalence low birth weights in Africa. Additional risk factors, not only caused by lack of socioeconomic resources, are the use of inferior energy sources for indoor cooking (Mishra et al. 2004), early childbearing, and inadequate access to prenatal health services (though the better access in urban areas seems to be more than outbalanced by various disadvantages, leading to a higher prevalence of low birth weight in cities than in rural areas in sub-Saharan Africa; Ezeh, Kodzi, and Emina 2010). Expansion of health services, especially to poor women, would reduce the incidence of low birth weight babies in the region, and such efforts would also serve to improve the quality and coverage of data on birth outcomes.
6. Acknowledgements
References
Aliyu, M., Salihu, H.M., Keith, L.G., Ehiri, J.E., Islam, A., and Jolly, P. (2005). High parity and fetal morbidity outcomes. Obstetrics & Gynecology 105(5): 1045-1051. doi:10.1097/01.AOG.0000157444.74674.75.
Ashworth, A. (1998). Effects of intrauterine growth retardation on mortality and morbidity in infants and young children. European Journal of Clinical Nutrition 52(Suppl 1): S34-41.
Ballot, D.E., Chirwa, T.F., and Cooper, P. (2010). Determinants of survival in very low birth weight neonates in a public hospital in Johannesburg. BMC Pediatrics 10(1): 1-11. doi:10.1186/1471-2431-10-30.
Barker, D.J.P. (1992). Fetal and Infants origins of disease. London: BMJ Books. Barker, D.J.P. (2004). Developmental origins of adult health and diseases. Journal of
Epidemiology and Community Health 58(2):114-115. doi:10.1136/jech.58.2.114. Barker, D.J.P., Eriksson, J.G., Forsen, T., and Osmond, C. (2002). Fetal origins of adult disease: Strength of effect and biological basis. International Journal of Epidemiology 31(6): 1235-1239. doi:10.1093/ije/31.6.1235.
Beyer, C. (1999). Estrogen and the developing mammalian brain. Anatomy and Embryology 199(5): 379-390. doi:10.1007/s004290050236.
Black, R.E., Morris, S.S., and Bryce, J. (2003). Where and why are 10 million children dying every year? The Lancet 361(9376): 2226-2234. doi:10.1016/S0140-6736(03)13779-8.
Black, S.E., Devereux, P.J., and Salvanes, K.G. (2005). From the Cradle to the Labor Market? The effect of Birth weight on adult outcomes. IZA Discussion Paper Series. (Number 1864).
Blanc, A.K. and Wardlaw, T. (2005). Monitoring low birth weight: An evaluation of international estimates and an updated estimation procedure. Bulletin of the World Health Organization 83(3): 178-185. doi:10.1590/S0042-96862 005000300010.
Brooks, A.A., Johnson, M.R., Steer, P.J., Pawson, M.E., and Abdalla, H.I. (1995). Birth weight: Nature or nurture? Early Human Development 42(1): 29-35.
doi:10.1016/0378-3782(95)01637-I.
Bryce, J. and Requejo, J.H. (2008). Countdown to 2015. Tracking progress in maternal, newborn and child survival: The 2008 Report. New York: UNICEF.
Cogswell, M.E. and Yip, R. (1995). The influence of fetal and maternal factors on the distribution of birth weights. Seminars in Perinatology 19(3): 222-240.
doi:10.1016/S0146-0005(05)80028-X.
Collins, J.W., Wambach, J., David, R.J., and Rankin, K.M. (2009). Women’s lifelong exposure to neighborhood poverty and low birth weight: A population-based study. Maternal and Child Health Journal 13(3): 326-333. doi:10.1007/s10995-008-0354-0.
Conde-Agudelo, A., Rosas-Bermudez, A., and Kafury-Goeta, A.C. (2006). Birth Spacing and Risk of Adverse Perinatal Outcomes. Journal of American Medical Association 295(15): 1809-1823. doi:10.1001/jama.295.15.1809.
Conley, D. and Bennett, N.G. (2001). Birth weight and income: Interactions across generations. Journal of Health and Social Behavior 42(4): 450-465.
doi:10.2307/3090189.
Cramer, J.C. (1995). Racial and ethnic difference in birth weight: The role of income and financial assistance. Demography 32(2): 231-247. doi:10.2307/2061742. D’Ercole, J.A. and Ye, P. (2008). Expanding the mind: Insulin-Like Growth Factor I
and brain development. Endocrinology 149(12): 5958-5962. doi:10.1210/en. 2008-0920.
Ezeh, A.C., Kodzi, I., and Emina, J. (2010). Reaching the urban poor with family planning services. Studies in Family Planning 41(2): 109-116. doi:10.1111/ j.1728-4465.2010.00231.x.
Filmer, D. and Pritchett, L.H. (2001). Estimating wealth effects without expenditure data – or tears: An application to education enrollments in states of India. Demography 38(1): 115-132. doi:10.1353/dem.2001.0003.
Godfrey, K.M. and Barker, D.J. (1997). Maternal birthweight and diet in pregnancy in relation to the infant’s thinness at birth. British Journal of Obstetrics and Gynecology 104(6): 663-667. doi:10.1111/j.1471-0528.1997.tb11975.x.
Godfrey, K.M. and Barker, D.J. (2001). Fetal programming and adult health. Public Health Nutrition 4(2b): 611-624. doi:10.1079/PHN2001145.
Janevic, T., Stein, C.R., Savitz, D.A., Kaufman, J., Mason, S.M., and Herring, A.H. (2010). Neighborhood deprivation and adverse birth outcomes among diverse ethnic groups. Annals of Epidemiology 20(6): 445-451. doi:10.1016/ j.annepidem.2010.02.010.
Khoshwood, B. (2005). Risk of low birth weight associated with advanced maternal age among four ethnic four ethnic groups in United States. Maternal and Child Health Journal 9(1): 3-9. doi:10.1007/s10995-005-2446-4.
Kramer, M.S. (1987). Determinants of low birth weight: Methodological assessment and meta-analysis. Bulletin World Health Organization 65: 663-737.
Low, J., Handley-Derry, M., and Burke, S. (1992). Association of intrauterine fetal growth retardation and learning deficits at age 9 to 11. American Journal of Obstetrics and Gynecology 167(6): 1499-1505.
Maccoby, E.E., Doering, C.H., Jacklin, C.N., and Kraemer, H. (1979). Concentration of sex hormones in umbilical cord blood: Their relation to sex and birth order of infants. Child Development 50(3): 632-642. doi:10.2307/1128928.
MacLeod, S. and Kiely, J.L. (1988). The effect of maternal age and parity on birthweight: A population-based study in New York City. International Journal of Gynecology and Obstetrics 26(1): 11-19. doi:10.1016/0020-7292(88)90191-9. Magadi, M., Madise, N., and Diamond, I. (2001). Factors Associated with unfavourable birth outcomes in Kenya. Journal of Biosocial Science 33(2): 199-225.
doi:10.1017/S0021932001001997.
Magadi, M.A., Agwandad, A.O., and Obare, F.O. (2007). A comparative analysis of the use of maternal health services between teenager and older mothers in sub-Saharan Africa: Evidence from the Demographic and Health Surveys. Social Science and Medicine 64(6): 1311-1325. doi:10.1016/j.socscimed.2006.11.004. Magee, B.D., Hattis, D., and Kivel, N.M. (2004). Role of smoking in low with weight.
Mahanty, C., Prasad, R., Reddy, S., Ghosh, J.K., Singh,T.B., and Das, B.K. (2006). Maternal anthropometry as predictors of low birth weight. Journal of Tropical Pediatrics 52(1): 24-29. doi:10.1093/tropej/fmi059.
Mishra, V., Dai, X., Smith, K., and Mika, L. (2004). Maternal exposure to biomass smoke and reduced birth weight in Zimbabwe. Annals of Epidemiology 14(10): 740-747. doi:10.1016/j.annepidem.2004.01.009.
Onah, H.E., Ikeako, L.C., and Iloabachie, G.C. (2006). Factors associated with the use of maternal services in Enugu, Nigeria. Social Science and Medicine 63(7): 1870-1878. doi:10.1016/j.socscimed.2006.04.019.
Oni, G.A. (1986). The effects of maternal age, education and parity on birth weight in a Nigerian community. The comparison of results from bivariate and multivariate analyses. Journal of Tropical Pediatrics 32(6): 295-300. doi:10.1093/ tropej/32.6.295.
Ozumba, B.C. and Igwegbe, A.O. (1992). The challenge of grandmultiparity in Nigerian obstetric practice. International Journal of Gynecology and Obstetrics 37(4): 259-264. doi:10.1016/0020-7292(92)90326-E.
Panagiotopoulou, K., Katsouyanni, K., Petridou E., Garas, Y., Tzonou, A., and Trichopoulos, D. (1990). Maternal age, parity, and pregnancy estrogens. Cancer Causes and Control 1(2): 119-124. doi:10.1007/BF00053162.
Phung, H., Bauman, A., Nguyen T.V., Young L., Tran, M., and Hillman, K. (2003). Risk factors for low birth weight in a socio-economically disadvantaged population: Parity, marital status, ethnicity and cigarette smoking. European Journal of Epidemiology 18(3): 235-243. doi:10.1023/A:1023384213536. Prentice, A.M., Whitehead, R.G., Watkinson, M., Lamb, W.H., and Cole, T.J. (1983).
Prenatal dietary supplementation of African women and birth-weight. The Lancet 321(8323): 489-492. doi:10.1016/S0140-6736(83)92188-8.
Rafalimanana, H. and Westoff, C.F. (2001). Gap between Preferred and Actual Birth Intervals in Sub-Saharan Africa: Implications for Fertility and Child Health. Calverton, Maryland: ORC Macro (DHS Analytical Studies No. 2).
Rawlings, J.S., Rawlings V.B., and Read, J.A. (1995). Prevalence of low birth weight and preterm delivery in relation to the interval between pregnancies among white and black women. The New England Journal of Medicine 332: 69-74.
Reece, A.E., Wizniter, A., Le, E., Homko, C.J., Behrman, H., and Spencer, E.M. (1994). The relation between human fetal growth and fetal blood levels of insulin-like growth factors I and II, their binding proteins, and receptors. Obstetrics and Gynecology 84(1): 88-95.
Rice, F. and Thapar, A. (2010). Estimating the relative contributions of maternal genetic, paternal genetic intrauterine factors to offspring birth weight and head circumference. Early Human Development 86(7): 425-432. doi:10.1016/ j.earlhumdev.2010.05.021.
Rustein, S.O. and Johnson, K. (2004). The DHS wealth index. Calverton, Maryland: ORC Macro (DHS Comparative reports No 6).
Seidman, D.S., Dollberg, S., Stephenson, D., and Gale, R. (1991). The effects of high parity and socioeconomic status on obstetric and neonatal outcome. Archives of Gynecology and Obstetrics 249(3): 119-127. doi:10.1007/BF02391578.
Seidman, D.S., Ever-Hadani, P., Stevenson, D., Slater, P., Harlap, S., and Gale, R. (1988). Birth order and weight re-examined. Obstetrics and Gynecology 72(2): 158-162.
Sharma, V., Katz, J., Mullany, L.C., Khatry, S.K., LeClerq, S.C., Shrestha, S.R., Darmstadt, G.L., and Tielsch, J.M. (2008). Young maternal age and the risk of mortality in Rural Nepal. Archives of Pediatrics & Adolescent Medicine 162(9): 828-835. doi:10.1001/archpedi.162.9.828.
Simon, D.M., Vyas, S., Prachand, N.G., David, R.J., and Collins, J.W.Jr. (2006). Relation of maternal low birth weight to infant growth retardation and prematurity. Maternal and Child Health Journal 10(4): 321-327.
doi:10.1007/s10995-005-0053-z.
Simpkiss, M.J. (1968). Birth weight, maternal age, parity among the African population of Uganda. British Journal of Preventive and Social Medicine 22(4): 234-237.
doi:10.1136/jech.22.4.234.
Skalkidou, A., Petridou, E., Papathoma, E., Savanos, H., Kedikoglou, S., Chrousos, G., and Trichopoulos, D. (2003). Determinants and consequences of major insulin-like growth factor components among full-term healthy neonates. Cancer Epidermiology Biomakers Prevevention 12: 860-865.
Spangler, S.A. and Bloom, S. (2010). Use of biomedical obstetric care in rural Tanzania: The role of social and material inequalities. Social Science and Medicine 71(4): 760-768. doi:10.1016/j.socscimed.2010.05.025.
Stephenson, T. and Symonds, M.E. (2002). Maternal nutrition as a determinant of birth weight. Arch Dis Child Fetal Neonatal Ed 86: F4-F6. doi:10.1136/fn.86.1.F4. United Nations Children’s Fund and World Health Organization (2004). Low
Birthweight: Country, regional and global estimates. UNICEF.
Wilcox, A.J. (2001). On the importance – and the unimportance – of birthweight. International Journal of Epidermiology 30(6): 1233-1241. doi:10.1093/ije/ 30.6.1233.
Wilcox, A., Chang, A.M., and Johnson, I.R. (1996). The effects of parity on birth weight using successive pregnancies. Acta Obstetricia et Gynecologica Scandinavica 75(5): 459-463. doi:10.3109/00016349609033354.
Zhu, B.P. (2005). Effects of interpregnancy interval on birth outcomes: Findings from three recent US studies. International Journal of Gynecology and Obstetrics 89(1): S25-S33. doi:10.1016/j.ijgo.2004.08.002.
Appendix
Selected DHS surveys in pooled data-set
Country Year of survey Country Year of survey
Benin 1996 Madagascar 2008
Benin 2001 Malawi 2000
Benin 2006 Malawi 2004
Burkina-Faso 1998-99 Mali 1995-96 Burkina-Faso 2003 Mali 2001
Cameroon 1998 Mali 2006
Cameroon 2004 Mozambique 1997 Central African Republic 1994-95 Mozambique 2003
Chad 1996-97 Namibia 2000
Chad 2004 Namibia 2006-07 Comoros 1996 Niger 1998 Congo 2007 Niger 2006
Congo-Brazzaville 2005 Nigeria 2003
Cote D’Ivoire 1994 Nigeria 2008
Cote D’Ivoire 1998 Rwanda 2000
Ethiopia 2000 Rwanda 2005
Ethiopia 2005 Senegal 2005
Gabon 2000 Sierra-Leone 2008
Ghana 1998 Swaziland 2006
Ghana 2003 Tanzania 1996 Ghana 2008 Tanzania 1999
Guinea 1999 Tanzania 2004
Guinea 2005 Togo 1998 Kenya 1999 Uganda 2000-01 Kenya 2003 Uganda 2006 Kenya 2008-09 Zambia 2001
Lesotho 2004 Zambia 2007
Liberia 2007 Zimbabwe 1994 Madagascar 1997 Zimbabwe 1999