DEMOGRAPHIC RESEARCH
VOLUME 30, ARTICLE 20, PAGES 579
608
PUBLISHED 4 MARCH 2014
http://www.demographic-research.org/Volumes/Vol30/20/ DOI: 10.4054/DemRes.2014.30.20
Research Article
Quantifying policy trade-offs to support aging
populations
Sergei Scherbov
Warren C. Sanderson
Marija Mamolo
© 2014 Scherbov, Sanderson & Mamolo.
This open-access work is published under the terms of the Creative Commons Attribution NonCommercial License 2.0 Germany, which permits use, reproduction & distribution in any medium for non-commercial purposes, provided the original author(s) and source are given credit.
1 Introduction 580
2 Methodology 581
3 Results 588
4 Discussion 591
5 Acknowledgments 593
References 594
Quantifying policy trade-offs to support aging populations
Sergei Scherbov1
Warren C. Sanderson2
Marija Mamolo3
Abstract
BACKGROUND
Coping with aging populations is a challenge for most developed countries. Supporting non-working adults can create an unsustainable burden on those working. One way of dealing with this is to raise the normal pension age, but this has proven unpopular. A complementary approach is to raise the average labor force participation rate. These policies are generally more politically palatable because they often remove barriers, allowing people who would like to work to do so.
OBJECTIVE
To conceptualize and estimate the trade-off between pension age and labor force participation rate policies.
METHOD
We project the populations of European countries and apply different levels of labor force participation rates to the projected populations. We introduce the notion of a relative burden, which is the ratio of the fraction of the income of people in the labor market in 2050 that they transfer to adults out of the labor market to the same fraction in 2009. We use this indicator to investigate the trade-offs between changes in normal pension ages and the general level of labor force participation rates.
1 Wittgenstein Centre for Demography and Global Human Capital (IIASA, VID/ÖAW, WU), International
Institute for Applied Systems Analysis, Austria. E-Mail: [email protected].
2 Wittgenstein Centre for Demography and Global Human Capital (IIASA, VID/ÖAW, WU), International
Institute for Applied Systems Analysis, Austria. Stony Brook University, Stony Brook, New York, U.S.A. E-Mail: [email protected].
3
RESULTS
We show that, in most European countries, a difference in policies that results in an increase in average labor force participation rates by an additional one to two percentage points by 2050 can substitute for a one-year increase in the normal pension age. This is important because, in many European countries, without additional increases in labor force participation rates, normal pension ages would have to be raised well above 68 by 2050 to keep the burden on those working manageable.
CONCLUSION
Because of anticipated increases in life expectancy and health at older ages as well as because of financial necessity, some mix of increases in pension ages and in labor force participation rates will be needed. Pension age changes by themselves will not be sufficient.
1. Introduction
Most developed countries face a demographic challenge – population aging will reduce the portion of the adult population who participate in the labor force, given current age-specific participation rates (Lutz, Sanderson, and Scherbov 2008; United Nations 2010).
Nonworking adults will have their consumption financed significantly by those who are working and the burden of these transfers can become unsustainable (European Commission 2010; Kotlikof and Burns 2004). This paper is part of a dialog on how best to conceptualize and respond to this challenge.
One way of dealing with this is to think about population aging simply as a public pension problem. An obvious solution, then, would be to decrease pension costs, often by increasing normal pension ages (OECD 2011). Governments can always save money by increasing normal pension ages. But if budgetary considerations are the sole rationale for raising the pension age it is unclear why alternative expenditure reductions or revenue increases are not equally satisfactory. After all, if education costs rise we do not automatically argue that, for the sake of government budgets, the age at which students begin primary education should be increased. Thinking about aging solely in terms of raising money for public pensions defines the challenge too narrowly.
In this article we argue that addressing the effects of aging is best done in a framework that takes both pension age and labor force participation rate policies into account. We do this by quantifying the trade-offs between pension ages and labor force participation rates in affecting the burden on younger generations of supporting nonworking adults as life expectancies increase and populations grow older. The political dialogue, however, has not generally recognized that there exists a potential trade-off between normal pension ages and labor force participation rates that can be translated into policy with good effect.
We have conceptualized and estimated these trade-offs for the first time for all EU countries. We show the mix of pension age policies and labor force participation rate policies that would keep the burden on workers of supporting nonworking adults at selected levels relative to 2009. As part of this analysis we demonstrate that, in most European countries, an increase in normal pension ages to 68 by 2050 would not be enough to keep the burden on the working population from ballooning. Policies that rely entirely on changes in normal pension ages may require normal pension ages of 70 or more by 2050 in order to do this. In a world in which normal pension ages could get quite high it is especially important to note that policies that increase labor force participation rates by an additional one to two percentage points by 2050 can substitute for a one year increase in the normal pension age.
2. Methodology
The quantity that underlies our analysis is the average proportion of the income of people in the labor force transferred to adults out of the labor force. In year t this can be written:
∑ ∑ ( )
∑ ∑ , (1)
where is the average proportion of the income of people in the labor force transferred to adults out of the labor force in year t (relative transfer), is the average amount received by people out of the labor force in period t from those who are in the labor force, is the highest age at which these amounts are received (100 in our computation), is the population of people at age i and gender j in year t, is
the labor force participation rate at age i for people of gender j in year t, and is the average income of people in the labor market in year t.
private and public sources. This concept of the transfer is broader than the fraction of labor income taxed to pay for a Pay-As-You-Go pension system, because it includes all money transfers to people out of the labor market. Second, the normal pension age does not appear explicitly in the equation for the average transfer. It does, however, appear implicitly. Countries have different patterns of age- and gender-specific labor force participation rates and we allow changes in normal pension ages to have an effect on the labor force participation rates of older workers. Third, we do not assume that labor force participation rates become zero after the normal pension age, although they are typically quite small. We do assume that labor force participation at age 75 and beyond is small enough to ignore.
The average transfer is related to another well-known quantity, the economic dependency ratio. There are a number of minor variations in how this ratio is defined, but the version most closely related to the average transfer is
EDRt
∑ ∑ ( ) ∑ ∑ ,
where EDRt is the economic dependency ratio at time t. In our computations we hold constant. Therefore,
, (2)
where RB2050is the relative burden in 2050. It is the ratio of the fraction of the income
of people in the labor market that they transfer to those out of the labor market in 2050 to the same fraction in 2009. If the fraction of income transferred to those out of the labor market were the same in the two years, the relative burden would be 1.0.
The population age structures in 2009 are known (Vienna Institute of Demography 2010), as are the labor force participation rates in that year (Table A1 and its source). The age structures of populations in 2050 are derived from the population projections of the Vienna Institute of Demography (2010). Therefore, everything in the relative burden in equation (2) is known except for the labor force participation rates and the normal pension age in 2050.
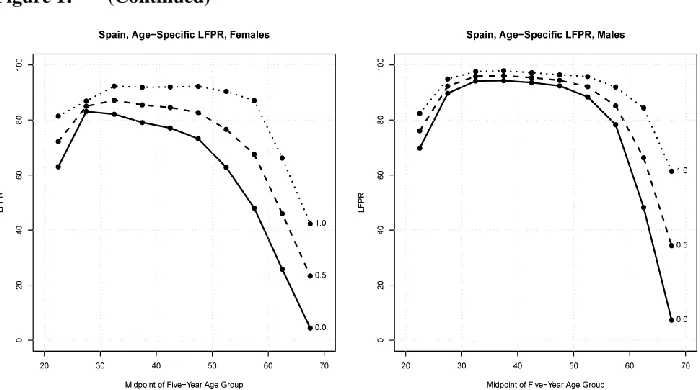
observed in 2009. For age 55 and above the baseline rates are adjusted for possible changes in normal retirement ages. Essentially, the procedure is just an age rescaling of the participation rates. For example, if the normal pension age were to rise by one year, from 65 to 66, then the baseline labor force participation rate of 58 year olds would be assigned a value equal to the one observed in 2009 at age 57, one year of age earlier. In the second step we take the baseline labor force participation rates (2009 rates adjusted for normal pension age changes) and parameterize them as follows:
* + ( ) ( ) , (3)
where i is an index for age, j refers to gender and t to the year, are the baseline
labor force participation rates, and the maximum in equation (3) for each gender separately is taken over all EU countries in 2009, supplemented by Iceland, Norway, and Switzerland. These maximum labor force participation rates are shown in Appendix Table A1. After these two steps are completed the entire schedule of labor force participation rates by age and sex can be specified using only two parameters, the normal retirement age and λ.
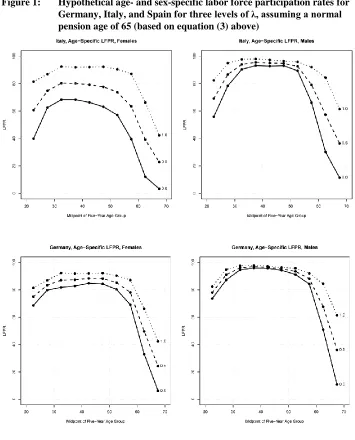
Figure 1: (Continued)
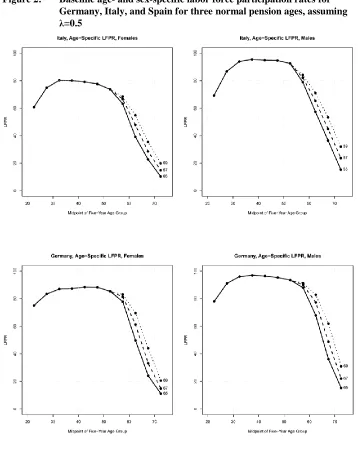
Figure 2: (Continued)
Figure 2 shows how we model the effects of changing normal pension ages on labor force participation rates in the same three countries, when λ is set equal to 0.5. Labor force participation rates below age 55 are unaffected. The largest changes in rates due to an increase in the normal pension age from 65 to 69 are for men in the age group 6569. Women also have substantial increases in the participation rates at 6064. For both sexes there is some increase in the labor force participation rates of 7074 year-olds.
For our current purposes the parameterization of labor force participation rates by normal pension age and has a disadvantage. The same level of in different countries could be associated with different labor force participation rates because of differences in the 2009 rates. To provide a measure that is comparable across countries we compute truncated average labor force participation rates by taking the unweighted average of the age-specific labor force participation rates through age 64:
* +
∑ ∑ * +
. (4)
3. Results
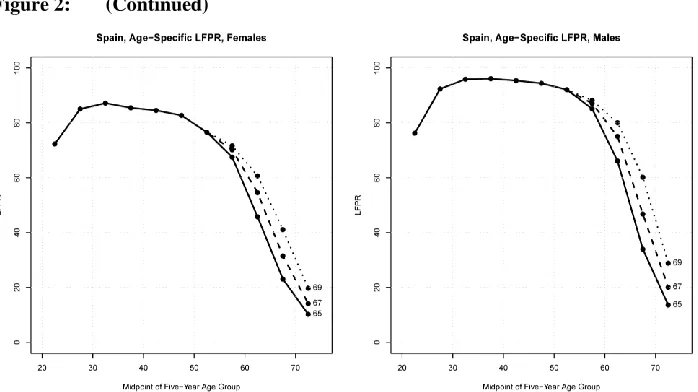
In Figure 3 we investigate the trade-off between normal pension age and average labor force participation in the United Kingdom. According to current legislation the normal pension age in the UK will increase to 68 by 2046, although planned five-year reviews of the normal pension age could change this (BBC News 2013; UK Department of Work and Pensions 2006). To show the trade-off we specify three different values of the relative burden on the left-hand side of equation (2), the same as in 2009 (1.0), a 10% higher relative burden than in 2009 (1.1), and a 28% higher burden (1.28). A 28% increase in the burden is what we forecast would occur in 2050 if the pension age was 68 and the average labor force participation rate remained at its 2009 level. A 28% increase in that burden would certainly be substantial. We plot iso-burden lines at each of these three levels of the relative burden to indicate the trade-off between higher labor force participation rates and a higher normal pension age.
Figure 3 shows an array of policy options available to UK policymakers. One option is to set the retirement age at 68 and raise the average labor force participation rate from its 2009 level of 0.79 to 0.86. This mix would keep the relative burden at its 2009 level. An alternative policy with the retirement age at 68 would be to increase the average labor force participation rate to 0.83 instead of 0.86. In this case the relative burden would be 10% higher in 2050 than in 2009. If the UK wanted to keep the relative burden at its 2009 level it could increase the normal pension age to 69 and increase the average labor force participation rate to 0.84, or keep the normal pension age at 65 and raise the average labor force participation rate to 0.88.
In Appendix Section 2 we present similar trade-off plots for all EU-27 countries, showing three iso-burden levels, 1.0, 1.1, and 1.2. In most EU countries, keeping the relative burden at its 2009 level in 2050 with a pension age of 68 would require increases in the average labor force participation rates. In some countries there are no feasible average labor force participation rates which would allow the average burden to remain at its 2009 level, even with a normal pension age of 68.
decline relative to that in the UK makes aging there more rapid and causes the support of nonworking adults to be much more challenging.
Figure 3: Trade-off between pension age and labor force participation in the
UK in 2050. The 2009 average labor force participation rate of 0.79 is indicated on the graph. Current plans in the UK are for the normal pension age (NPA) to be 68 in 2050. At the 2009 average labor participation rate of 0.79 and a normal pension age of 68, the relative burden would be 28% higher than it was in 2009
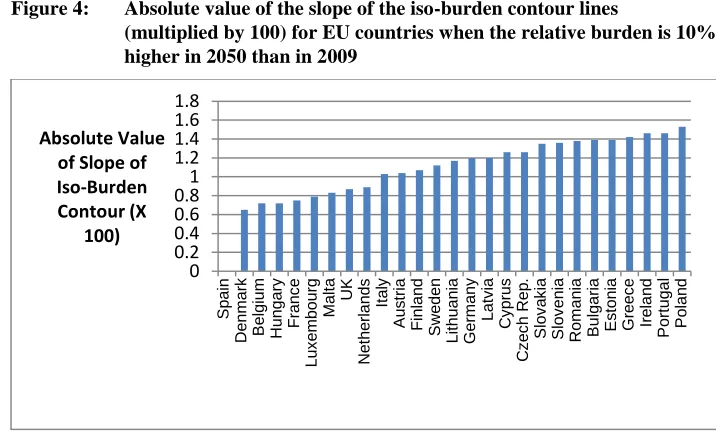
We can see from Figure 3 and the figures in Section 2 of the Appendix that the iso-burden lines are relatively linear. This makes it feasible to make good approximations of their slopes. In Figure 4 we show the slopes of the iso-burden lines for the EU countries, measured at the level of the relative burden of 1.1. The slope of the iso-burden contour could not be computed for Spain because that computation would have required a normal pension age higher than 69, which is the highest that we used in our computations.
Figure 4: Absolute value of the slope of the iso-burden contour lines
(multiplied by 100) for EU countries when the relative burden is 10% higher in 2050 than in 2009
The absolute value of the slope is the percentage point increase in the average labor force participation rate that keeps the relative burden constant when the normal pension age is reduced by one year. The median value of the absolute values shown in Figure 4 is 1.2. This indicates that, in general, it would take around a 1.2 percentage point increase in the average labor force participation rate to keep the relative burden constant when the normal pension age is reduced by one year.
Another way to interpret Figure 4 is to see that the inverse of the absolute value of the slope is the number of years that the normal pension age could be reduced when the average labor force participation rate is increased by one percentage point, so as to keep the relative burden constant. The median value of those inverses is 0.84, indicating that, keeping the relative burden constant, a one percentage point increase in the average
labor force participation rate can compensate for around a 0.84 year decrease in the normal pension age. In the Appendix, Section 4, we show that the slopes are rather insensitive to whether they are measured using labor force participation rates based on 2009 or on 2012.
Average labor force participation rates in the EU in 2009 varied from a low of 0.63 in Malta to a high of 0.84 in Sweden. In France the average was 0.75 and in the UK it was 0.79 or four percentage points higher than in France. An additional increase in the French average labor force participation rate of four percentage points by 2050 would almost completely substitute for a three-year increase in the normal pension age. Italy had a relatively low average labor force participation rate in 2009 of 0.65, ten percentage points lower than France. An additional five percentage point increase in the average labor force participation rate in Italy in 2050, half the difference to France’s level in 2009, would substitute for a three-year increase in the normal pension age. In developed countries labor force participation rates in the ages prior to the normal pension age differ widely. For example, in 2009 the labor force participation rate among 5559 year olds in Denmark was 83.2%, 62.5% in France, while in Malta it was 48.5% (see Appendix Section 1 for the labor force participation rates of all EU-27 countries). These differences in labor force participation rates are uncorrelated with rates of disability (Sanderson and Scherbov 2010) (see Appendix Section 3), and are likely to be influenced by policy differences (Burniaux, Duval, and Jaumotte 2004; European Commission 2010).
4. Discussion
Although economic dependency ratios can be found in Economic Policy Committee (2005), Toosi (2009), and Whiteford (2006), among others, this is the first detailed analysis of the trade-off between normal pension ages and average labor force participation rates.
years old should get a public pension in one year, and someone 65 years old but born one year later should not get it.
In some countries increasing the normal pension age also increases the uncertainty of income when people have adverse health shocks. Some people are concerned that they might not be healthy enough to continue working up to later pension ages.
Pension age increases also have a disadvantage from a macroeconomic perspective. Pension age increases raise the labor force participation rates of people close to the end of their working lives. These are ages at which productivity is generally declining (Gordo and Mertens 2010; Gordo and Skirbekk 2012; Koolhaas et al. 2012; Skirbekk 2004, 2008) and at which it can be difficult to find job openings.
Pension age increases take decades to implement, as the British example shows. Labor force participation policies typically can be implemented much more rapidly, in part because they are likely to be more popular and so can contribute to solving the fiscal problems associated with aging much sooner. Despite these drawbacks, some increases in normal pension age may be desirable. With increasing life expectancies, spreading working time more evenly over the lifecycle is becoming necessary and desirable (Vaupel and Kistowski 2008; Vaupel and Loichinger 2006). To do this and to reduce the burden on working adults of supporting those who are not working requires changes both in normal pension ages and in labor force participation rates.
Labor force participation rate policies can be divided into those that primarily affect the supply of labor and those that primarily affect the demand for labor. Two groups are most frequently targeted by these policies: women and older workers. For women, three supply-side policies are particularly relevant. They are more flexible working hours, support for families with young children, and equal tax treatment for married and single women. Empirical studies have shown that these policies can result in an increase in female labor force participation (Del Boca 2002; Euwals 2001; Jaumotte 2003; Kornstad and Thoresen 2006; Lefebvre, Merrigan, and Verstraete 2009; Smith et al. 2003). The demand-side policy of enforcing anti-sex discrimination laws could also help.
Flexibility in hours of work, working conditions, and wages can provide an environment in which older people can continue to work. When wages are rigidly tied to seniority, older workers could have their positions terminated when their productivity falls. A phased retirement approach could keep them working, perhaps with fewer hours and at a lower wage (Hutchens 2003). Education and training programs for older workers could also keep them interested in continuing to work and employers interested in continuing to hire them (Crépon, Ferracci, and Fougère 2007; Jones et al. 2009; Lechner, Miquel, and Wunsh 2008).
Evidence shows that removing financial incentives to retire prior to the normal pension age and making pension systems more actuarially fair would have a substantial effect on the labor force participation rates of older workers (Blöndal and Scarpetta 1999; Börsch-Supan 2000; Duval 2003; Gruber and Wise 1998, 1999, 2004).
Disability pensions are sometimes abused and become a vehicle to finance early retirement. (Euwals, van Vuuren, and Wolthoff 2010; Gruber 2000; Whiteford 2006). For the majority of the working population abuses of the disability system are often regarded as something negative. Reforming such systems is likely to be politically popular. A nuanced approach to disability where partially disabled people are encouraged to work up to their potential can also keep people in the labor force (Yin 2008). Anti-age discrimination policies can also be used.
While, in the medium-term, policies to increase labor force participation rates can reduce the pressure for increases in the pension age, there is a limit to the ability to increase labor force participation rates. Because of this, and anticipated increases in life expectancy and improvements in health, some increases in the normal pension age are appropriate in the long-run (Sanderson and Scherbov 2005, 2010), in order to keep intergenerational balance.
While the public widely perceives increases in the normal pension age as a negative thing, many labor force participation policies are viewed positively, because they eliminate distortions, provide people with more opportunities, and reduce the fraudulent use of disability pensions. Because of anticipated increases in life expectancy and health at older ages as well as because of financial necessity, some mix of increases in pension ages and in labor force participation rates will be needed. The best mix is more likely to be found where the trade-offs between the two are clearly articulated.
5. Acknowledgments
References
Börsch-Supan, A. (2000). Incentive effects of social security on labor force participation: Evidence in Germany and across Europe. Journal of Public Economics 78(12): 2549. doi:10.1016/S0047-2727(99)00110-3.
BBC News (2010). France hit by new wave of strikes over pension reform (October 19, 2010) [electronic resource]. London: British Broadcasting Corporation. http://www.bbc.co.uk/news/world-europe-11570828.
BBC News (2013). State pension age to be reviewed every five years (14 January, 2013) [electronic resource]. London: British Broadcasting Corporation. http://www.bbc.co.uk/news/business-20993027.
Blöndal, S. and Scarpetta, S. (1999). The retirement decision in OECD countries. Paris: Organisation for Economic Co-operation and Development (OECD Economics Department Working Paper; 202). doi:10.1787/565174210530.
Burniaux, J.-M., Duval, R., and Jaumotte, F. (2004). Coping with geing: A dynamic approach to quantify the impact of alternative policy options on future labor supply in OECD countries. Paris: Organisation for Economic Co-operation and Development (OECD Economics Department Working Paper; 371). doi:10.1787/224538175006.
Crépon, B.M.F. and Fougère, D. (2007). Training the unemployed in France: How does it affect unemployment duration and recurrence. Bonn: Institute for the Study of Labor (IZA Discussion Paper; 3215).
Del Boca, D. (2002). The effect of child care and part time opportunities on participation and fertility decisions in Italy. Journal of Population Economics 15(3): 549573. doi:10.1007/s001480100089.
Duval, R. (2003). Retirement behavior in OECD countries: Impact of old-age pension schemes and other social transfer programmes. OECD Economic Studies 37(2): 750. doi:10.1787/eco_studies-v2003-art8-en.
Economic Policy Committee (2005). The 2005 EPC projection of age-related expenditure: Agreed underlying assumptions and projection methodologies. Brussels: European Commission (Occasional Papers; 19).
European Commission (2010). Towards adequate sustainable and safe European pension systems. Luxembourg: Publications Office of the European Union. (Green Paper).
Euwals, R. (2001). Female labor supply, flexibility of working hours and job mobility. Economic Journal 111(471): C120C134. doi:10.1111/1468-0297.00623. Euwals, R., van Vuuren, D., and Wolthoff, R. (2010). Early retirement behavior in the
Netherlands: Evidence from a policy reform. Economist-Netherlands 158(3): 209236. doi:10.1007/s10645-010-9139-0.
Gordo, L.R. and Mertens, A. (2010). Do older workers earn more than they deserve? In: Salzmann T., Skirbekk V., and Weiberg M. (eds.), Wirtschaftspolitische Herausforderungen des demografischen Wandels. Berlin, Heidelberg: VS Verlag für Sozialwissenschaften: 149–174. doi:10.1007/978-3-531-92489-2_8. Gordo, L.R. and Skirbekk, V. (2012). Skill demand and the comparative advantage of
age: Jobs tasks and earnings from the 1980s to the 2000s in Germany. Labour Economics 2: 6169.
Gruber, J. (2000). Disability insurance benefits and labor supply. Journal of Political Economy 108(6): 11621183.
Gruber, J. and Wise, D.A. (1998). Social security and retirement: An international comparison. American Economic Review 88(2): 158163.
Gruber, J. and Wise, D.A. (eds.) (1999). Social security and retirement around the world. Chicago: University of Chicago Press.
Gruber, J. and Wise, D.A. (eds.) (2004). Social security programs and retirement around the world: Micro estimation. Chicago: University of Chicago Press. Guardian (2011). State pension age reform- in pictures. (May 19, 2010) [electronic
resource]. London: Guardian News and Media. http://www.guardian.co. uk/money/gallery/2011/may/19/state-pension-age-protest#/?picture=374754751 &index=0
Hutchens, R. (2003). The Cornell Study of employer phased retirement policies: A report on key findings. Ithaca, New York: Cornell University, School of Industrial and Labor Relations.
Jones, M.K., Jones, R.J., Latreille P.L., and Sloane, P.J. (2009). Training, job satisfaction and workplace performance in Britain: Evidence from WERS 2004. Labour 23(Special Issue): 139175. doi:10.1111/j.1467-9914.2008.00434.x. Koolhaas, W., van der Klink, J.J.L., Groothoff, J.W., and Brouwer, S. (2012). Towards
a sustainable healthy working life: associations between chronological age, functional age and work outcomes. The European Journal of Public Health 22(3): 424–429. doi:10.1093/eurpub/ckr035.
Kotlikoff, L. and Burns, S. (2004). Coming generational storm: What you need to know about America’s future. Cambridge, MA: MIT Press.
Kornstad, T. and Thoresen, T.O. (2006). Effects of family planning reforms in Norway: Results from a joint labour supply and childcare microsimulation. Fiscal Studies 27(3): 339371. doi:10.1111/j.1467-8578.2006.00038.x.
Lefebvre, P., Merrigan, P., and Verstraete, M. (2009). Dynamic labour supply effects of childcare subsidies: Evidence from a Canadian natural experiment on low-fee universal child care. Labour Economics 16(5): 490502. doi:10.1016/j.labeco. 2009.03.003.
Lechner, M., Miquel, R., and Wunsh, C. (2008). The curse and blessing of training the unemployed in a changing economy: The case of East Germany after unification. German Economic Review 8(4): 468509. doi:10.1111/j.1468-0475.2007. 00415.x.
Lutz, W., Sanderson, W.C., and Scherbov, S. (2008). The coming acceleration of global population ageing. Nature 451(7179): 716719. doi:10.1038/nature06516. OECD (2011). Pensions at a glance 2011: Retirement-income systems in OECD and
G20 countries [electronic resource]. Paris: Organisation for Economic Co-operation and Development. doi:10.1787/pension_glance-2011-en.
Smith, N., Dex, S., Vlasborn, J.D., and Callan, T. (2003). The effects of taxation of married women’s labor supply across countries. Oxford Economic Papers 55(3): 417439. doi:10.1093/oep/55.3.417.
Sanderson, W.C. and Scherbov, S. (2005). Average remaining lifetimes can increase as human populations age. Nature 435: 811813. doi:10.1038/nature03593. Sanderson, W.C. and Scherbov, S. (2010). Remeasuring aging. Science 329(5597):
Skirbekk, V. (2004). Age and individual productivity: A literature survey. Vienna Yearbook of Population Research 2: 133–153. doi:10.1553/populationyearbook 2004s133.
Skirbekk, V. (2008). Age and productivity potential: A new approach based on ability levels and industry-wide task demand. Population and Development Review 34: 191–207.
Toossi, M. (2009). Labor force projections to 2018: Older workers staying more active. In: US Bureau of Labor Statistics (ed.). Employment outlook 2008-2018. Washington, DC: U.S. Bureau of Labor Statistics: 3051.
UK Department of Work and Pensions (2006). Security in retirement: Toward a new pensions system. Northampton: Department for Work and Pensions.
United Nations (2010). World Population Ageing 2009. New York: United Nations, Department of Economic and Social Affairs (ST/ESA/SER.A/295).
Vaupel, J.W. and Loichinger, E. (2006). Redistributing working in aging Europe. Science 312(5782):19111913. doi:10.1126/science.1127487.
Vaupel, J.W. and Kistowski, K.G.K. (2008). Living longer in an ageing Europe: A challenge for individuals and societies. European View 7: 255263. doi:10. 1007/s12290-008-0047-5.
Vienna Institute of Demography (2010). Data Sheet 2010. [electronic resource] Vienna: Vienna Institute of Demography, Austrian Academy of Sciences. http://www. oeaw.ac.at/vid/datasheet/download_2010.shtml.
Whiteford, P. (2006). Increasing employment among older workers: Social security reform in OECD countries – A survey and assessment. In: Emanuel, H. (ed.) Ageing and the labor market: Issues and solutions. Or are there? Antwerpen: intersentia: 1141.
Appendix Section 1: Participation rates in 2009, selected age groups,
both sexes
Table A1: Labor force participation rates by selected age groups and country in
2009 (%) [lfsa_argan] (Last update: 28-07-2011)
4044 4549 5054 5559 6064
Austria 90.7 88.5 81.4 61.0 21.4
Belgium 87.2 84.6 76.7 53.2 19.6
Bulgaria 88.0 85.8 81.0 68.9 30.4
Cyprus 88.3 85.0 80.7 68.8 46.2
Czech Rep. 94.3 93.7 90.3 70.7 27.2
Denmark 91.5 89.7 88.3 83.2 37.5
Estonia 91.5 90.7 86.1 78.6 51.7
Finland 91.0 90.3 87.2 76.8 41.2
France 90.8 89.7 85.6 62.5 18.1
Germany 90.4 89.4 85.7 76.5 41.8
Greece 85.1 81.3 72.6 56.5 32.0
Hungary 85.2 81.8 75.3 52.1 13.6
Ireland 79.0 78.7 74.8 63.6 44.4
Italy 79.6 77.9 72.9 52.5 20.9
Latvia 90.9 90.2 85.7 79.0 40.0
Lithuania 88.5 88.0 82.7 72.0 39.8
Luxembourg 85.6 81.5 76.5 54.9 20.2
Malta 72.5 64.9 59.9 48.5 13.8
Netherlands 89.5 88.0 84.2 74.7 38.6
Poland 87.6 83.5 73.0 45.7 19.1
Portugal 88.8 87.0 80.2 64.3 42.1
Romania 83.0 79.4 69.8 53.1 31.6
Slovakia 92.1 91.1 85.1 61.4 17.3
Slovenia 91.8 91.4 80.9 49.6 18.8
Spain 85.5 82.8 75.5 62.8 36.6
Sweden 92.4 90.7 88.4 84.6 64.0
UK 86.3 86.4 83.0 74.2 46.8
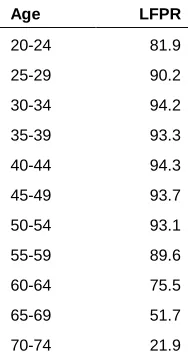
Maximum labor force participation rates
Table A2: Maximum age-specific labor force participation rates: EU-27
Countries plus Switzerland, Iceland, and Norway, in 2009
Age LFPR
20-24 81.9
25-29 90.2
30-34 94.2
35-39 93.3
40-44 94.3
45-49 93.7
50-54 93.1
55-59 89.6
60-64 75.5
65-69 51.7
70-74 21.9
Appendix Section 3: The relationship between age-specific disability
rates and labor force participation rates
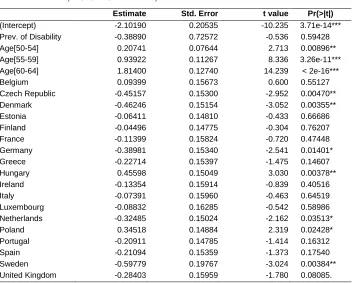
Table A3: Relationship between the log of the prevalence of disability (limited
and severe) and labor force participation rates for men 45 to 64 years old, EU-SILC countries, 2009
Estimate Std. Error t value Pr(>|t|)
(Intercept) -2.10190 0.20535 -10.235 3.71e-14***
Prev. of Disability -0.38890 0.72572 -0.536 0.59428
Age[50-54] 0.20741 0.07644 2.713 0.00896**
Age[55-59] 0.93922 0.11267 8.336 3.26e-11***
Age[60-64] 1.81400 0.12740 14.239 < 2e-16***
Belgium 0.09399 0.15673 0.600 0.55127
Czech Republic -0.45157 0.15300 -2.952 0.00470**
Denmark -0.46246 0.15154 -3.052 0.00355**
Estonia -0.06411 0.14810 -0.433 0.66686
Finland -0.04496 0.14775 -0.304 0.76207
France -0.11399 0.15824 -0.720 0.47448
Germany -0.38981 0.15340 -2.541 0.01401*
Greece -0.22714 0.15397 -1.475 0.14607
Hungary 0.45598 0.15049 3.030 0.00378**
Ireland -0.13354 0.15914 -0.839 0.40516
Italy -0.07391 0.15960 -0.463 0.64519
Luxembourg -0.08832 0.16285 -0.542 0.58986
Netherlands -0.32485 0.15024 -2.162 0.03513*
Poland 0.34518 0.14884 2.319 0.02428*
Portugal -0.20911 0.14785 -1.414 0.16312
Spain -0.21094 0.15359 -1.373 0.17540
Sweden -0.59779 0.19767 -3.024 0.00384**
United Kingdom -0.28403 0.15959 -1.780 0.08085.
Signif. codes: 0 ‘***’ 0.001 ‘**’ 0.01 ‘*’ 0.05 ‘.’ 0.1 ‘ ’ 1 Residual standard error: 0.2088 on 53 degrees of freedom Multiple R-squared: 0.9464, Adjusted R-squared: 0.9242 F-statistic: 42.55 on 22 and 53 DF, p-value: < 2.2e-16
Sources: Disability Rates: European Health Expectancy Monitoring Unit (EHEMU) (2009). Data on activity limitation from Statistics on Income and Living Conditions (SILC) Survey [electronic resource]. Montpellier: Centre de Recherche de Val d'Aurelle. www. ehemu.eu/. Labor Force Participation Rates: European Commission (2011). Eurostat: Activity rates by sex, age groups and nationality (%) [lfsa_argan] (Updated: 28-07-2011). European Union. http://epp.eurostat.ec.europa.eu/portal/page/portal/ statistics/search_database
Appendix Section 4: Sensitivity of the slopes to the use of 2009-based
labor force participation rates
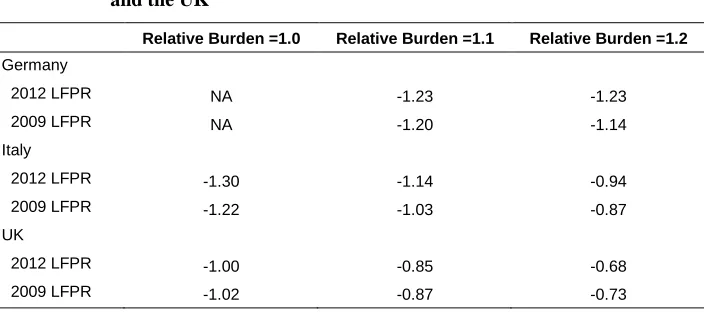
Table A4: Slopes of iso-burden contours for three levels of the relative burden,
2009 and 2012 labor force participation rates for Germany, Italy, and the UK
Relative Burden =1.0 Relative Burden =1.1 Relative Burden =1.2
Germany
2012 LFPR NA -1.23 -1.23
2009 LFPR NA -1.20 -1.14
Italy
2012 LFPR -1.30 -1.14 -0.94
2009 LFPR -1.22 -1.03 -0.87
UK
2012 LFPR -1.00 -0.85 -0.68
![Table A1: Labor force participation rates by selected age groups and country in 2009 (%) [lfsa_argan] (Last update: 28-07-2011)](https://thumb-us.123doks.com/thumbv2/123dok_us/8937090.1848198/22.482.75.426.131.464/table-labor-force-participation-selected-groups-country-update.webp)