University of New Orleans University of New Orleans
ScholarWorks@UNO
ScholarWorks@UNO
University of New Orleans Theses and
Dissertations Dissertations and Theses
12-17-2010
Development of a Simulation Model for Fluidized Bed Mild
Development of a Simulation Model for Fluidized Bed Mild
Gasifier
Gasifier
AKM Monayem Hossain Mazumder University of New Orleans
Follow this and additional works at: https://scholarworks.uno.edu/td
Recommended Citation Recommended Citation
Mazumder, AKM Monayem Hossain, "Development of a Simulation Model for Fluidized Bed Mild Gasifier" (2010). University of New Orleans Theses and Dissertations. 101.
https://scholarworks.uno.edu/td/101
This Thesis-Restricted is protected by copyright and/or related rights. It has been brought to you by
ScholarWorks@UNO with permission from the rights-holder(s). You are free to use this Thesis-Restricted in any way that is permitted by the copyright and related rights legislation that applies to your use. For other uses you need to obtain permission from the rights-holder(s) directly, unless additional rights are indicated by a Creative Commons license in the record and/or on the work itself.
Development of a Simulation Model for Fluidized Bed Mild Gasifier
A Thesis
Submitted to the Graduate Faculty of the University of New Orleans in partial fulfillment of the requirements for the degree of
Master of Science in
Engineering Mechanical
By
A.K.M. Monayem Hossain Mazumder
B.S. Bangladesh University of Engineering and Technology, 2006
ii
ACKNOWLEDGEMENT
I would like to take this opportunity to thank my advisor, Dr. Ting Wang, for his
guidance and support while working under him as a graduate student. None of this would be
made possible without Dr. Ting Wang's hard work and dedication to his students and the
University of New Orleans. I would also like to thank Drs. Paul J. Schilling, Melody A. Verges,
and Carsie A. Hall, III for being a part of my thesis committee.
I would like to acknowledge the support from the Louisiana Governor's Energy
Initiative, administered by the Louisiana Board of Regents via the Clean Power and Energy
Research Consortium (CPERC) and the Grant from the Department of Energy.
Furthermore, I would also like to thank my fellow colleague students and researches, Dr.
Jobaidur Rahman Khan, Dr. T. S. Dhanasekaran, Dr. Armin Silaen, Jason Kent, and other from
the Energy Conversion and Conservation Center (ECCC) for their help, support and valuable
suggestions.
Finally, I would like to thank all my family and friends for their support throughout the
years while I pursed both, my Bachelors of Science and Masters of Science degree in Mechanical
Engineering. They have always been there for me with constant support in dealing with difficult
times and made the good times even more enjoyable, and for that I am very grateful.
iii
TABLE OF CONTENTS
LIST OF FIGURES ... vi
LIST OF TABLES ... ix
NOMENCLATURE ...x
ABSTRACT ... xii
CHAPTER 1. INTRODUCTION ...1
1.1 Background ...1
1.1.1 Brief History of Coal Use ...1
1.1.2 United States Coal Reserves ...2
1.1.3 Impurities inside Coal ...2
1.1.4 Method of Using Coal ...2
1.1.5 Brief Description of IGCC System ...3
1.2 Literature Review...4
1.2.1 Clean Coal Technology...4
1.2.1.1 Knocking of SOx out of Coal ...5
1.2.1.2 Knocking of NOx out of Coal ...6
1.2.2 History of Gasification ...7
1.2.3 Coal Gasification ...7
1.2.3.1 Devolatilization ...8
1.2.3.2 Carbon Particle Combustion/Gasification ...10
1.2.3.3 Modeling Particle Combustion ...11
1.2.4 Gasification Global Reactions ...12
1.2.5 Types of Gasifiers ...13
1.2.5.1 Entrained-Flow Gasifier...13
1.2.5.2 Transport Gasifier ...18
1.2.5.3 Moving-Bed Gasifier ...19
1.2.5.4 Fluidized-Bed Gasifier ...21
1.2.6 Mild Gasification Method ...25
1.2.6.1 Wormser Mild Gasifier ...26
1.2.6.2 ECCC Mild Gasifier ...28
1.3 Motivation and Objectives ...30
2. FLUIDIZED BED GASIFICATION ...31
2.1 Coal Pyrolysis ...31
2.2 Liquefaction of Coal ...32
2.3 Gasification ...34
2.4 Fluidization ...35
2.5 Fluidized Bed ...36
2.5.1 Fluidized Bed Reactor (FBR) ...38
2.5.1.1 Advantages of FBR ...38
2.5.1.2 Disadvantages of FBR ...39
2.5.1.3 Current Research on FBR ...39
2.5.2 Fluidized Bed Boiler (FBB) ...40
2.5.3 Fluidized Bed Gasifier (FBG) ...41
iv
2.5.3.1.1 Pressurized Bubbling Bed Coal Partial Oxidizer 42
2.5.3.1.2 Pressurized Bubbling Bed Coal Carbonizer ...44
2.5.4 Fluidized Bed Combustor (FBC) ...45
2.5.4.1 Fluidized Bed Combustor Design Consideration ...46
2.5.4.1.1 Bubbling Bed Atmospheric Fluidized Bed Combustor ...46
2.5.4.1.2 Circulating Bed Atmospheric Fluidized Bed Combustor ...48
2.5.4.1.3 Bubbling Bed Pressurized Fluidized Bed Combustor ...50
2.5.5 The Future of Fluidized Bed Gasifiers and Combustors ...51
2.6 Theoretical and Empirical Prediction of Minimum Fluidization Velocity ...52
2.6.1 Minimum Fluidization Velocity of Packed Beds...52
2.6.2 Minimum Fluidization Velocity of Fluidized Beds ...54
2.6.3 Terminal Settling Velocity ...59
2.7 Review of Fluidized Bed Research and Development (R&D) ...62
3. CFD FORMULATION AND THEORY ...71
3.1 Problem Statement ...71
3.2 Computational Model ...75
3.2.1 Physical Characteristics of the Problem ...75
3.2.2 General Governing Equations ...75
3.2.3 Turbulence Model ...76
3.2.3.1 Standard k-ε Model ...77
3.2.3.2 Other Models ...83
3.2.4 Chemical Reaction Model...84
3.2.4.1 Instantaneous Gasification Model...85
3.2.4.2 Finite Rate Model ...88
3.2.4.3 Carbon Combustion Reaction Rates ...94
3.2.5 Boundary Conditions ...96
3.3 Computational Scheme ...100
3.3.1 Solution Methodology ...100
3.3.1.1 Preprocessing ...100
3.3.1.2 Processing ...100
3.3.1.3 Post processing...100
3.3.2 Computational Grid ...101
3.3.3 Numerical Procedure ...103
3.3.4 Convergence Criterion ...108
4. MODELING MULTIPHASE FLOWS ...111
4.1 Introduction ...111
4.2 Multiphase Flow Regimes ...111
4.3 Approaches of Multiphase Modeling...112
4.3.1 Euler-Lagrange Approach ...113
4.3.2 Euler-Euler Approach ...113
4.3.2.1 The Volume of Fluid (VOF) Model...113
4.3.2.2 The Mixture Model ...114
v
4.4 Eulerian Multiphase Model Theory ...115
4.4.1 Conservation Equations using Eulerian Multiphase Model...115
4.4.2 Description of Momentum Equations ...117
4.4.2.1 Lift Forces ...117
4.4.2.2 Virtual Mass Force ...118
4.4.2.3 Inter-phase Momentum Exchange Coefficient ...118
4.4.2.3.1 Fluid-Fluid Momentum Equations ...119
4.4.2.3.2 Fluid-Solid Momentum Equations ...119
4.4.2.3.2.1 Solid Pressure...123
4.4.2.3.2.2 Radial Distribution Function...123
4.4.2.3.2.3 Solids Shear Stresses...124
4.4.2.3.2.4 Granular Temperature ...126
4.4.3 Description of Energy Equations ...127
4.5 Multiphase Turbulence Models ...129
4.5.1 k-ε Mixture Turbulence Model ...130
4.6 Modeling Species Transport in Multiphase Flows ...131
5. RESULTS AND DISCUSSIONS ...136
5.1 Studies on Preliminary Geometry (Case 1, 2 and 3) ...137
5.1.1 Case 1: Thermal-flow behavior (no solids and no reactions) in the preliminary geometry ...137
5.1.2 Case 2: Homogeneous reactions (no solids) in the preliminary geometry ...138
5.1.3 Case 3: Thermal-flow behavior with solids (no reactions) ...142
5.2 Studies on Fluidized Bed Mild Gasifier (Case 4, 5, 6 and 7) ...147
5.2.1 Case 4: Thermal-flow behavior (no solids and no reactions) in gasifier...147
5.2.2 Case 5: Homogeneous reactions (no solids) in gasifier with volatiles150 5.2.3 Case 6: Thermal-flow behavior with solids (no reactions) ...155
5.2.3.1 Case 6a: 4 m/s solid inlet at draft tube ...155
5.2.3.2 Case 6b: 5 m/s solid inlet at draft tube ...159
5.2.4 Case 7: Heterogeneous (gas-solid) reactions with volatiles ...163
5.2.5 Compare the velocity fields of different Cases (Case 4 and 7) ...169
5.2.6 Grid Independence Study for Case 7 ...171
6. CONCLUSIONS...173
REFERENCES ...176
APPENDICES ...182
Appendix A Minimum fluidization velocity of carbon solid...182
Appendix B Calculation procedure for adiabatic flame temperature ...185
Appendix C Calculation of molecular composition and enthalpy of formation of volatiles ...194
Appendix D Calculation of inlet gas mass fraction at the Draft tube Inlet ...199
vi
LIST OF FIGURES
Figure 1.1 Schematic of an IGCC system (Source: Wikipedia, 2006) ...4
Figure 1.2 Simplified global gasification processes of coal particles (sulfur and other minerals are not included in this figure). Heat can be provided externally or internally through combustion of char, volatiles, and CO ...8
Figure 1.3 Schematic of a downdraft an entrained-flow gasifier [Holt (2004)] ...13
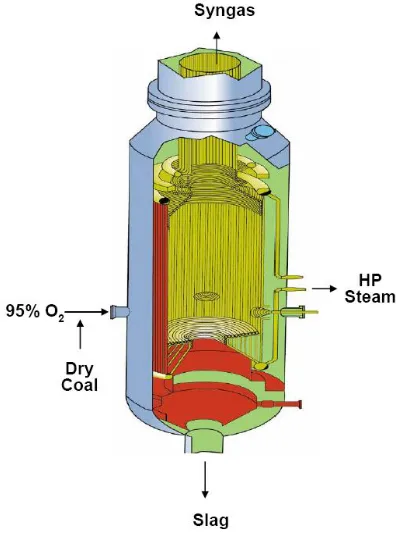
Figure 1.4 Schematic of the Shell gasifier ...14
Figure 1.5 Schematic of the General Electric gasifier ...15
Figure 1.6 Schematic of the Conoco-Phillips (E-Gas) gasifier ...16
Figure 1.7 (a) PRENFLO with Steam Generation (PSG) and (b) PRENFLO with Direct Quench (PDQ) ...17
Figure 1.8 Kellog Brown & Root (KBR) transport gasifier ...19
Figure 1.9 Schematic of a counter-current moving-bed gasifier [Holt (2004)] ...20
Figure 1.10 Schematic of the British Gas Lurgi moving-bed gasifier ...21
Figure 1.11 Schematic of fluidized-bed gasifier [Holt (2004)] ...22
Figure 1.12 Schematic of the High Temperature Wrinkler (HTW) Gasifier ...23
Figure 1.13 Schematic of a Kellogg-Rust-Westinghouse (KRW) gasifier ...24
Figure 1.14 Schematic diagram of a Mild Gasifier [Wormser (2008)] ...27
Figure 1.15 Schematic diagram of the cold-flow model of the ECCC Mild Gasifier ...29
Figure 2.1 Schematic drawing of Pyrolysis of Carbonaceous Fuels ...32
Figure 2.2 Schematic drawing of a Fluidized Bed ...38
Figure 2.3 Schematic drawing of pressurized bubbling coal partial oxidizer [Wen-Ching Yang (2003)]...43
Figure 2.4 Schematic drawing of pressurized bubbling bed coal carbonizer [Wen-Ching Yang (2003)] ...44
Figure 2.5 Schematic drawing of bubbling bed Atmospheric Fluidized Bed Combustor (AFBC) [Wen-Ching Yang (2003)] ...47
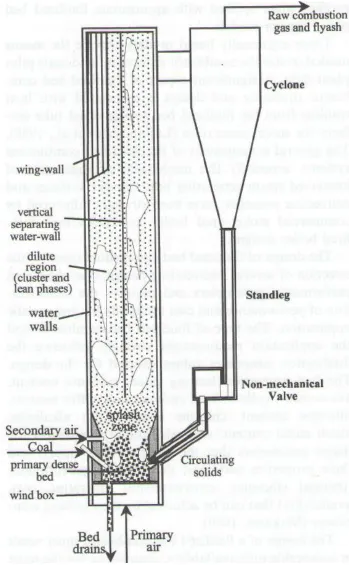
Figure 2.6 Schematic drawing of circulating bed Atmospheric Fluidized Bed Combustor (AFBC) [Wen-Ching Yang (2003)] ...49
Figure 2.7 Schematic drawing of bubbling bed Pressurized Fluidized Bed Combustor (PFBC) [Wen-Ching Yang (2003)] ...51
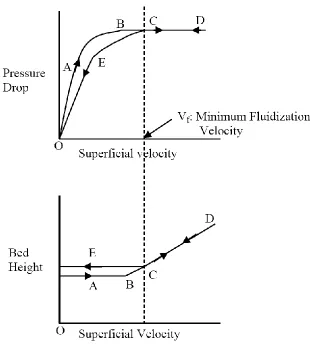
Figure 2.8 Schematic drawing of Minimum Fluidization Velocity ...55
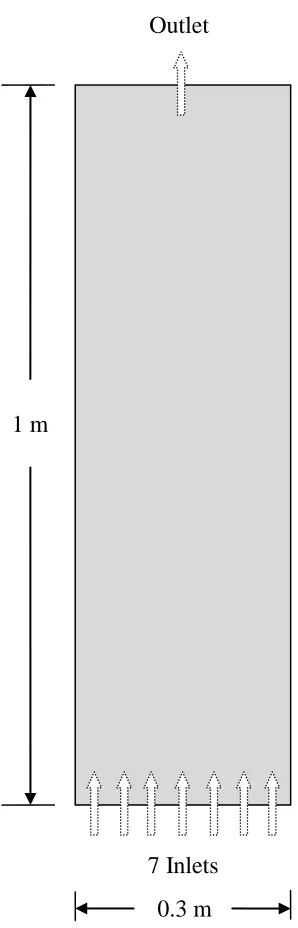
Figure 3.1 The simplified 2D preliminary geometry ...73
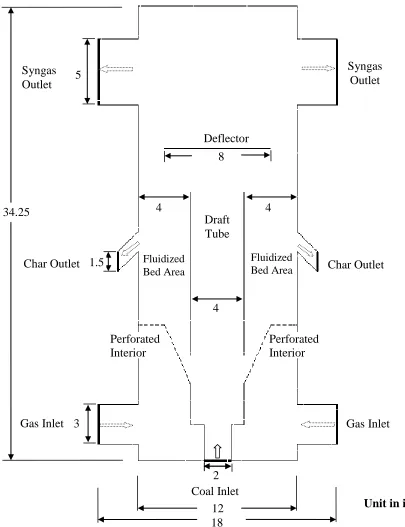
Figure 3.2 Schematic of the 2D simulated Fluidized Bed Mild Gasifier...74
Figure 3.3a Boundary conditions of preliminary geometry ...97
Figure 3.3b Boundary conditions of Fluidized Bed Mild Gasifier ...98
Figure 3.4 2D structured mesh of the simplified preliminary geometry ...101
Figure 3.5a 2D structured mesh (6,960 cells) of Fluidized Bed Mild Gasifier ...102
Figure 3.5b 2D structured mesh (30,876 cells) of Fluidized Bed Mild Gasifier ...102
Figure 3.5c 2D structured mesh (65,355 cells) of Fluidized Bed Mild Gasifier ...103
vii
oscillations, rather it is a typical feature caused by alternating iterations between the solid and gas phases ...109 Figure 5.1 A Chart showing CFD Simulation cases ...136 Figure 5.2 Air velocity vector plots in the simplified 2D preliminary geometry colored by static
pressure (Pascal) distribution (Case 1) ...138 Figure 5.3 Distribution of gas mass fraction in the simplified 2D preliminary geometry (Case 2)141 Figure 5.4 Gas velocity vector plots in the simplified 2D preliminary geometry colored by
temperature (K) distribution with five single-phase reactions (Case 2) ...142 Figure 5.5 Velocity vector plots for (a) particle and (b) air in the simplified 2D preliminary
geometry colored by static pressure (Pascal) for Case 3 ...144 Figure 5.6 Distribution of volume fraction of carbon particles with 4 m/s air inlet from time
intervals 0.2 to 1.6 seconds in the simplified 2D preliminary geometry without
reactions (Case 3) ...145 Figure 5.7 Distribution of volume fraction of carbon particles with 4 m/s air inlet from time
intervals 1.8 to 4.0 second in the simplified preliminary geometry without reactions (Case 3) ...146 Figure 5.8 Air velocity vector plots in the mild gasifier colored by temperature (K) distribution
without particles and reactions (Case 4) ...149 Figure 5.9 Distribution of reactant gas mass fraction in the mild gasifier with the instantaneous (homogeneous) gasification model including volatiles but without particles (Case 5)152 Figure 5.10 Distribution of product gas mass fraction in the mild gasifier with the instantaneous
(homogeneous) gasification model including volatiles but without particles (Case 5)153 Figure 5.11 Gas velocity vector plots in the mild gasifier colored by temperature (K) distribution
with the instantaneous (homogeneous) gasification model including volatiles but without particles (Case 5) ...154 Figure 5.12 Velocity vector plots for (a) particles and (b) air colored by temperature in Kelvin
with 2.8 m/s air inlet at horizontal and 4 m/s solid inlet at draft tube in the fluidized bed mild gasifier (Case 6a) ...156 Figure 5.13 Distribution of volume fraction of carbon solid particles with 2.8 m/s fluidization air
at the horizontal inlet and 4 m/s solid inlet at draft tube from time intervals 0.2 to 1.2 second in the fluidized bed mild gasifier (Case 6a) ...157 Figure 5.14 Distribution of volume fraction of carbon solid particles with 2.8 m/s fluidization air
at the horizontal inlet and 4 m/s solid inlet at draft tube from time intervals 1.4 to 3.0 second in the fluidized bed mild gasifier (Case 6a) ...158 Figure 5.15 Distribution of volume fraction of carbon solid particles with 2.8 m/s fluidization air
at the horizontal inlet and 4 m/s solid inlet at draft tube from time intervals 3.4 to 4.0 second in the fluidized bed mild gasifier (Case 6a) ...159 Figure 5.16 Velocity vector plots for (a) particles and (b) air colored by temperature in Kelvin
with 2.8 m/s air inlet at horizontal and 5 m/s solid inlet at draft tube in the fluidized bed mild gasifier (Case 6b) ...160 Figure 5.17 Distribution of volume fraction of carbon solid particles with 2.8 m/s fluidization air
at the horizontal inlet and 5 m/s solid inlet at draft tube from time intervals 0.2 to 1.2 second in the fluidized bed mild gasifier (Case 6b) ...161 Figure 5.18 Distribution of volume fraction of carbon solid particles with 2.8 m/s fluidization air
viii
Figure 5.19 Distribution of volume fraction of carbon solid particles with 2.8 m/s fluidization air at the horizontal inlet and 5 m/s solid inlet at draft tube from time intervals 3.4 to 4.0 second in the fluidized bed mild gasifier (Case 6b) ...163 Figure 5.20 Distribution of reactant gas mass fraction in the fluidized bed mild gasifier including
volatiles with particles (Case 7) ...166 Figure 5.21 Distribution of product gas mass fraction in the fluidized bed mild gasifier including
volatiles with particles (Case 7) ...167 Figure 5.22 Temperature distribution of (a) carbon solid (b) gas mixture in Kelvin and (c)
volume fraction of carbon solid in the fluidized bed mild gasifier (Case 7) ...168 Figure 5.23 Velocity vector plots for (a) particles and (b) air colored by temperature (K)
distribution in the fluidized bed mild gasifier (Case 7) ...168 Figure 5.24 Air velocity vector plots (a) without particles and reactions (Case 4) and (b) both
particles and reactions (Case 7) in the fluidized bed mild gasifier colored by
temperature (K) distribution. Note that the vectors are not in the same scale in each Case ...170 Figure 5.25 Particles velocity vector plots for (a) without reactions (Case 6a) and (b) with
reactions (Case 7) colored by temperature in Kelvin with 2.8 m/s gas inlet at horizontal and 4 m/s solid inlet at draft tube in the fluidized bed mild gasifier (Case 6a) ...171
ix
LIST OF TABLES
Table 1.1 Comparisons between Combustion and Gasification ...3
Table 1.2 Summary of coal gasifier comparisons ...25
Table 3.1 Parameters, inlet and operating conditions for heterogeneous (gas-solid) reaction with volatiles (Case 7 in Ch. 5) ...99
Table 5.1 Minimum fluidization velocity values calculated from different correlations and obtained from the CFD result for 5 mm diameter and 0.5 volume fraction of carbon solid ...143
Table 5.2 Different velocity values at different inlets for Case 4 ...148
Table 5.3 Parameters, boundary and operating conditions for simulated Case 5 ...151
Table 5.4 Different velocity values at different inlets for Case 6a ...156
Table 5.5 Different velocity values at different inlets for Case 6b ...160
Table 5.6 Parameters, boundary and operating conditions for simulated Case 7 ...165
x
NOMENCLATURE
a local speed of sound (m/s)
c concentration (mass/volume, moles/volume)
cp heat capacity at constant pressure (J/kg-K)
cv heat capacity at constant volume (J/kg-K)
D mass diffusion coefficient (m2/s) DH hydraulic diameter (m)
Dij mass diffusion coefficient (m2/s)
Dt turbulent diffusivity (m2/s)
E total energy (J)
g gravitational acceleration (m/s2) G incident radiation
Gr Grashof number (L3.ρ2.g.β.∆T/ µ2) H total enthalpy (W/m2-K)
h species enthalpy (W/kg-m2-K) J mass flux; diffusion flux (kg/m2-s) k turbulence kinetic energy (m2/s2) k thermal conductivity (W/m-K)
m mass (kg)
MW molecular weight (kg/kgmol)
M Mach number
p pressure (atm)
Pr Prandtl number (ν/α)
q heat flux
qr radiation heat flux
R universal gas constant (8314.34 J/Kmol-K)
S source term
Sc Schmidt number (ν/D)
xi
T temperature (K)
U mean velocity (m/s)
X mole fraction (dimensionless)
Y mass fraction (dimensionless)
x, y, z coordinates
Greek letter
β coefficient of thermal expansion (K-1) ε turbulence dissipation (m2/s3)
εw wall emissivity
κ von Karman constant
µ dynamics viscosity (kg/m-s)
µk turbulent viscosity (kg/m-s)
v kinematic viscosity (m2/s)
v' stoichiometric coefficient of reactant
v" stoichiometric coefficient of product
ρ density (kg/m3) ρw wall reflectivity
σ Stefan-Boltzmann constant
σs scattering coefficient
τ stress tensor (kg/m-s2)
Subscript
i reactant i
j product j
xii
ABSTRACT
A mild gasification method has been developed to provide an innovative clean coal
technology. The objective of this study is to developed a numerical model to investigate the
thermal-flow and gasification process inside a specially designed fluidized-bed mild gasifier
using the commercial CFD solver ANSYS/FLUENT. Eulerain-Eulerian method is employed to
calculate both the primary phase (air) and secondary phase (coal particles). The Navier-Stokes
equations and seven species transport equations are solved with three heterogeneous (gas-solid),
two homogeneous (gas-gas) global gasification reactions. Development of the model starts from
simulating single-phase turbulent flow and heat transfer to understand the thermal-flow behavior
followed by five global gasification reactions, progressively with adding one equation at a time.
Finally, the particles are introduced with heterogeneous reactions. The simulation model has
been successfully developed. The results are reasonable but require future experimental data for
verification.
Keywords: Clean coal technology, coal gasification, fluidized-bed, mild gasifier, CFD,
1
CHAPTER ONE
INTRODUCTION
1.1 Background
1.1.1 Brief History of Coal Use
Coal is the most abundant fuel in the fossil family, and it has the longest and most varied
history. Archeologists have found evidence that the Romans in England used coal in the second
and third centuries (100-200 AD).
The English found in the 1700’s that coal could produce a fuel that burned cleaner and
hotter than wood charcoal. However, it was the overwhelming need for energy to run the new
machinery invented during the Industrial Revolution in 1700’s that provided the real opportunity
for coal to become a dominant worldwide energy source.
During the 1300’s the Hopi Indians in North American, what is now the U.S. Southwest,
used coal for cooking, heating, and baking the pottery. Coal was re-discovered in the United
States by explorers in 1673. However, commercial coal mines did not start operation until the
1740’s in Virginia.
A major event that played a role in expanding the use of coal was the Industrial
Revolution. James Watt invented the steam engine, which made it possible for machines to do
work previously done by humans and animals. Mr. Watt used coal to make the steam to run his
engine.
The Industrial Revolution spread to the United States in the first half of 1800’s.
Steamships and steam-powered railroads, which used coal to fuel their boilers, were becoming
the leading modes of transportation. More uses for coal were found in the second half of the
1800's.
During the Civil War, weapon factories began to use coal. By 1875, coke (which is made
from coal) replaced charcoal as the primary fuel for iron blast furnaces to make steel. In 1880,
2 1.1.2 United States Coal Reserves
One quarter of the world's coal reserves are found in the United States. The energy
content of United States' coal reserves exceeds the world's known oil reserves. Coal is the
USA’s largest domestic energy resource, and more than 50 percents of the United States
electricity supply comes from coal. At the current rates of use, United States' coal reserves are
enough to last for 250 years. There is still enough coal underground in this country to provide
energy for the next 200 to 300 years. The dependence of the U.S. on coal as source of energy
will continue as the Energy Information Administration projects a 26 percent increase in the
United States electricity demand from 2007 to 2030, with coal remaining the main fuel source.
1.1.3 Impurities inside Coal
Unfortunately, coal is not a perfect fuel. Trapped inside coal are trace impurities such as
nitrogen and sulfur. When coal burns, these impurities (NOx and SOx) are released into the air,
which can react with water vapor in the air and form droplets that fall to earth as weak forms of
sulfuric and nitric acid which are known as "acid rain." Similar with any other carbon-based fuel,
burning coal produces carbon dioxide. Carbon dioxide is a colorless, odorless gas, but in the
atmosphere, it is one of several gases that can trap the earth's heat, causing the "greenhouse
effect" which changes the earth's climate. In addition, burning coal also releases flying ashes that
add to the problem of air pollution.
1.1.4 Method of using Coal
The method of using coal can be divided into (a) combustion, (b) pyrolysis, (c)
liquefaction, and (d) gasification. In combustion, coal is directly burned to produce heat. In
pyrolysis, coal is decomposed through heating in the absence of oxygen. Volatile matters inside
the coal will be released when coal is heated, leaving only carbon (char) and tar. In liquefaction,
coal is converted into liquid fuel. In gasification, coal is converted into synthetic gas (syngas).
Gasification is a process that converts any carbon-based materials, such as coal, pet-coke,
biomass, or various wastes, into a synthetic gas (syngas) through an oxygen-limited reaction.
The clean syngas can be used as a fuel to produce electricity or valuable products such as
chemicals, fertilizers, and transportation fuels. In contrast to a combustion process that takes
3
conditions. Generally, the amount of O2 used is only 35% or less of the amount required for
complete combustion. The main differences between combustion and gasification are listed in
Table 1.1.
Table 1.1 Comparisons between Combustion and Gasification
Combustion Gasification
Occurs in excess-oxidant conditions
Releases heat (exothermic)
Produces heat
Occurs in oxidant-lean conditions
Less production of air pollutants gas
Absorbs heat (endothermic)
Produces syngas
Gasification has a lower environmental impact compared to traditional combustion
technologies because of the following reasons:
(a) Gasification can recover available energy from low-value materials, such as municipal solid
waste and pet-coke.
(b) Syngas is cleaned before combustion, thus reducing air pollutants such as NOx and SOx.
(c) By-products of gasification (sulfur and slag) are nonhazardous and marketable.
(d) High efficiency
(e) Low CO2 production per kW output due to higher efficiency.
(f) Carbon dioxide (CO2) can be captured prior to syngas combustion. It gives the least cost and
most efficient way of capturing CO2 from a fossil-fuel based power plant.
1.1.5 Brief Description of IGCC System
A very efficient way to use the syngas as fuel in electricity generation is by employing
the Integrated Gasification Combined Cycle (IGCC). Schematic of an IGCC system is presented
in Fig. 1.1. IGCC combines the gasification system with the gas clean-up system and the
combined power system. The syngas produced by the gasifier is cleaned and used as a fuel for
the gas turbines. The high pressure and hot gases produced in the combustor then expand
through the gas turbines to drive the air compressor and an electric generator. The hot exhaust
gases from the gas turbines are sent to HRSG (Heat Recovery Steam Generator), producing
4
Integrated Gasification Combined Cycle (IGCC) also provides a more efficient method of
capturing carbon dioxide (CO2) than in the conventional pulverized coal burning power plants.
IGCC demonstration plants have been operating since the early 1970’s and some of the plants
constructed in the 1990’s are now entering successful commercial services.
Figure 1.1 Schematic of an IGCC system (Source: Wikipedia, 2006).
1.2 Literature Review
1.2.1 Clean Coal Technology
Many years ago, people do not like to use coal as a fuel because it is dirty and produces
heavy pollutants during combustion. But things have changed in the last 20 years; ways have
been developed to capture the pollutants trapped in coal before the impurities can escape into the
atmosphere. Today, new technologies have been developed that can filter out 99 percent of the
tiny particles and remove more than 95 percent of the acid rain pollutants in coal. New
technologies also have been developed that can cut back on the release of carbon dioxide by
burning coal more efficiently. Many of these technologies belong to a family of energy systems
5
The Clean Coal Technology Program began in 1985 when the United States and Canada
decided to do something about the "acid rain" because acid rain is responsible for damaging
rivers, lakes, forests, and buildings in both countries. Since many of the pollutants that formed
"acid rain" were coming from big coal-burning power plants in the United States, the U.S.
Government took the lead in finding a solution. One of the steps taken by the U.S. Department of
Energy (DOE) was to create a partnership program between the government, several states, and
private companies to test new methods to make coal burning much cleaner. This became the
"Clean Coal Technology Program." There are several ways to make coal cleaner by removing
"acid rain" pollutants such as sulfuric acid and nitric acid (SOx and NOx) and "greenhouse gas"
such as carbon dioxide (CO2) gas.
1.2.1.1 Knocking of SOx out of coal
Sulfur is a yellowish substance that exists in tiny amounts in coal. In some coals found in
Ohio, Pennsylvania, West Virginia and other eastern states in the USA, sulfur makes up from 3
to 10 percent of the weight of coal. For some coals found in Wyoming, Montana and other
western states in the USA, the sulfur can be only 1 percent or less than 1 percent of the weight of
the coal. But still, it is important that most of this sulfur be removed before it goes up a power
plant's smokestack.
One way is to clean the coal from sulfur before it arrives at the power plant by simply
crushing the coal into "small chunks" and "washing" it. Some of the sulfur that exists in tiny
speck in coal called "pyritic sulfur" (because it is combined with iron to form iron pyrite) can be
washed out of the coal in this manner. Typically, in one washing process, the coal chunks are fed
into a large water-filled tank. The coal floats to the surface while the sulfur impurities sink.
Note that, not all of coal's sulfur can be removed by washing because some of the sulfur
in coal is actually chemically connected to coal's carbon molecules instead of existing as separate
particles. This type of sulfur is called "organic sulfur". Several processes have been tested to mix
the coal with chemicals that break the sulfur away from the coal molecules, but most of these
processes have proven too expensive. That's why most of modern power plants and all plants
built after 1978 are required to have special devices installed that clean the sulfur from the coal's
6
is "flue gas desulfurization units". Another name is "scrubbers" because they "scrub" the sulfur
out of the smoke released by coal-burning boilers.
Most scrubbers rely on a very common substance found in nature called "limestone."
Limestone can be made into a white powder by crushing and processing. Such as a sponge
absorbs water, limestone can be made to absorb sulfur gases under the right conditions.
In most scrubbers, limestone is mixed with water and sprayed into the coal combustion
gases (called "flue gases"). The limestone captures the sulfur and "pulls" it out of the gases. The
limestone and sulfur combine with each other to form either a wet paste (like toothpaste), or a
dry powder. In either case, the sulfur is trapped and prevented from escaping into the air. The
Clean Coal Technology Program tested several new types of scrubbers that proved to be more
effective, lower cost, and more reliable than older scrubbers.
1.2.1.2 Knocking of NOx out of coal
About 79% by volume of the air is nitrogen and 21% is oxygen. Normally, nitrogen
atoms float around joining each other like chemical couples. But when air is heated, for example
in a coal boiler's flame, these nitrogen atoms break apart and join with oxygen. This forms
"nitrogen oxides" or "NOx" . NOx can also be formed from the atoms of nitrogen that are trapped
inside coal. In the air, NOx is a pollutant. It is also one of the pollutants that forms "acid rain,"
and it can help form "ground level ozone," another type of pollutant that can make the air dingy.
NOx can be produced by any fuel that burns hot enough. For example, automobiles produce NOx
when they burn gasoline. But a lot of NOx comes from coal-burning power plants, so the Clean
Coal Technology Program developed new ways to reduce this pollutant.
One of the best ways to reduce NOx is to prevent it from forming in the first place.
Scientists have found ways to burn coal in burners where there is more fuel than air in the hottest
combustion chambers. Under these conditions, most of the oxygen in air combines with the fuel,
rather than with the nitrogen. The burning mixture is then sent into a second combustion
chamber where a similar process is repeated until all the fuel is burned. This concept is called
"staged combustion" because coal is burned in stages. A new family of coal burners called
"low-NOx burners" has been developed using this way of burning coal. These burners can reduce the
7
There is also a family of new technologies that work like "scrubbers" by cleaning NOx
from the flue gases (the smoke) of coal burners. Some of these devices use special chemicals
called "catalysts" that break apart the NOx into non-polluting gases. Although these devices are
more expensive than "low-NOx burners," they can remove up to 90 percent of NOx pollutants.
In the future, there may be an even cleaner way to burn coal in a power plant, or maybe,
there be a way that doesn't burn the coal at all.
1.2.2 History of Gasification
Gasification process has been used for hundreds of years, with the earliest practical
gasification process being reported to have taken place in 1792. Murdoch, a Scottish engineer,
pyrolyzed coal to produce gas which he then used to light his home. In 1812, the first gas
company was established in London to produce gas from coal to light the Westminster Bridge.
The first gas plant to manufacture syngas from coal was built in the United States in 1816 to light
the streets of Baltimore. Soon, more gas plants followed in Boston and New York. By 1875,
manufactured gas was being widely used for home lighting. More than 1200 gas plants were in
operation in the United States by the late 1920s as manufactured gas was used in domestic and
industrial applications. During the World War II, over 1 million air-blown gasifiers were in
operation to generate synthetic gas from wood and charcoal to power vehicles and generate
steam and electricity. Note that no gas clean up system was used in the above applications, so
the combusted gases are dirty under the standard of present day. However, the discovery of large
quantities of low-cost natural gas after World War II put an end to the synthetic gas
manufacturing industry. It wasn't until the 1960’s and 1970’s that the interest in gasification
technologies was renewed.
1.2.3 Coal Gasification
Figure 1.2 presents the typical processes undergoing by coal particles in gasification.
The gasification of coal particles involves two major steps: (a) thermal decomposition (pyrolysis
and devolatilization) and (b) combustion of solid residue from the first step. Coal particles
undergo pyrolysis when they enter the hot combustion environment. Moisture contained in the
particles boils and leaves the particles when the particle temperature reaches the boiling
8
The volatiles are then released as particle temperature continues to increase. This volatile
release process is called devolatilization. The volatiles are then thermally cracked into lighter
gases, such as H2, CO, C2H2, CH4, etc. These lighter gases can react with O2, releasing some of
the heat needed for the pyrolysis.
With only char and ash left, the particles undergo combustion to produce CO and CO2,
leaving only ash. The thermal decomposition occurs relatively slowly, while the combustion of
carbon is faster so the combustion heat can continuously support devolatilization and gasification
process.
C Moisture
Volatiles Ash
C Volatiles
Ash
C Ash
Volatiles Heat
Ash
CO, CO2
Heat
O2, H2O
Thermal Cracking
Lighter products, H2, CO, C2H2, etc.
Moisture
Devolatilization
Pyrolysis (no oxygen)
Gasification
Mild Gasification
Figure 1.2 Simplified global gasification processes of coal particles (sulfur and other minerals are not included in this figure). Heat can be provided externally or internally through combustion of char, volatiles, and CO.
1.2.3.1 Devolatilization
Devolatilization is a decomposition process of hydrocarbon material when they are
heated. Devolatilization rates are influenced by temperature, residence time, particle size, and
coal type. The heating causes bonds to rupture and both of coal's organic and mineral parts to
9
temperature reaches above 300 C (572 F), the released liquid hydrocarbon called tar becomes important. Gaseous hydrocarbons such as CO, CO2, and water steam are also releazed. Coal
particle is in a plastic state, where it undergoes drastic change in size and shape, when the
temperature is above 500 C (932 F). The coal particle then becomes hard again, and is called char, when temperature reaches around 550 C (1022 F). As heating continues, H2 and CO are
releazed.
Coal particles undergo swelling as they are heated. Small particles behave differently
than larger particles. Smaller particles expand at lower temperature than larger particles. Aside
from expanding, particles also change shape during swelling. Usually, the sharp edges of the
particles become rounded off. The structure of the coal particles at the end of de-volatilization is
influenced by the amount of volatiles contained in the coal. Intensive volatiles release in high
volatile coal results in larger particle porosity, while low volatile particles have smaller porosity
and burn on the surface.
The pyrolysis conditions affect the physical properties of coal chars. Experiment by Gale
et al. (1995), which was conducted at maximum particle temperatures between 570 C (1058 F) and 1355 C (2471 F) and heating rates between 104 and 2 x 10⁵ K/s, showed that micro-pore (CO2) surface area generally increases with increasing residence time and mass releases for
lignite and bituminous coals. It also showed that the micro-pore surface area of char increases
with increasing maximum particle temperature and heating rate.
The volatile matters generated during heating can significantly influence the temperature
distribution in the particle. The volatiles generated near the center of the particle travel to the
particle surface and escape. The flow of these volatiles from the particle center to the particle
surface can reduce the convective heat transfer from surroundings to the particles surface. It is
reported that the heat transfer coefficient decreases 10 times during fast heating of coal particles
mixed with hot solid heat carrier. This reduced heat transfer rate to the particle surface results in
a temperature plateau of the particle surface on the level of about 400 C (752 F) and lasts during the whole time of volatiles release. Another explanation for this temperature plateau
given by Davies and Brown (1969) is that this is due to a strong effect of de-volatilization.
In general, the larger the particle size, the smaller amount the volatile yields. This is
because in larger particles, more volatiles may crack, condense, or polymerize, with some carbon
10
pressure has similar effect on the de-volatilization rates. Anthony et al. (1975) reported that
devolatilization rates are higher at lower pressures. An increase in pressure increases the transit
time of volatiles to reach the particle surface.
Seebauer et al. (1997) investigated the effects of pressure, particle size and heating rate
on coal pyrolysis using thermogravimeteric analysis. The pressure used in the study ranged from
1 to 40 atm and heating rate from 0.03 to 0.1 K/s. Seebauer et al. found that the total volatiles
yield decreased with increasing pressure. Sun et al. (1997) studied the pyrolysis of two Chinese
coals under pressure ranging from 1 to 13 atm with a heating rate as low as 0.33 K/s. It was
reported that, at high pressure, the total volatiles yield decreases with increasing pressure. The
total weight loss is almost independent of pressure at low temperatures (about less than 837 K).
Fatemi et al. (1987) studied the pressure effects on de-volatilization of pulverized coal up
to temperature 1373 K and pressure 68 atm in an entrained-flow reactor. They indicated that the
tar yield decreases significantly with increasing pressure up to 13.8 atm. Weight loss and gas
yield decreases with increasing pressure up to 13.8 atm, and there is no significant effect above
this pressure.
Wall et al. (2002) reviewed the pressure effect on variety aspects of coal reactions
reported in open literature. In general, the total volatile and tar yields decrease with increasing
pressure. This effect is more pronounced at higher temperatures and is less pronounced at high
pressures. Increasing pressure improves fluidity of the coal melt and reduces char reactivity.
1.2.3.2 Carbon Particle Combustion/Gasification
The steps involved in a reaction between gas and a solid particle are as follow:
1. Transport of reactants to solid surface by convection and/or diffusion.
2. Adsorption of reactant molecule on the surface.
3. Reaction steps involving various combinations of adsorbed molecules, the surface, and
the gas-phase molecules.
4. Desorption of product molecules from the surface.
5. Transport of product molecules away from solid surface by convection and/or diffusion.
Due to the porous structure of char particles, chemical reactions between gases and the
solid occur both on the outer and the inner surfaces of the particles. Reacting gases diffuse from
11
structure. As the reaction proceeds, the size of the available pores increases, which increases the
inner particle surface. The particle active surface reaches a maximum at burnout of about 40%.
The total active surface area is then decrease as a result of connection of enlarging neighboring
pores.
1.2.3.3 Modeling Particle Combustion
(a) Kinetics/Diffusion Fixed-Core Model
The kinetics/diffusion fixed-core model takes into account the diffusion and kinetic rates
of the combustion. The size of the particle during the combustion is assumed to be constant.
The particle consumption rate is defined as follow,
0 s d g p A k 1 k 1 P dt dm (1.1)
Where mp is the particle mass, Pg is the partial pressure of the gas phase species, A0 is the
original particle surface area, kd is the diffusion rate constant and ks is the kinetics rate constant.
(b) Shrinking Core Model
The shrinking core model accounts for the reduction in the particle radius as the combustion
occurs. The effect of diffusion through the ash layer surrounding the particle is also taken into
account. The particle consumption rate is defined as follow,
1 r R k 1 R r k 1 k 1 A P dt dm p p dash 2 p p s d 0 g p (1.2)
Where mp is the particle mass, Pg is the partial pressure of the gas phase species, A0 is the initial
particle surface area, kd is the diffusion rate constant, ks is the kinetics rate constant, and kd,ash is
the ash diffusion constant, rp is the instantaneous radius of the particle, and Rp is initial radius of
the particle.
(c) Random Pore Model
The random pore model (Bhatia and Perlmutter, 1980) accounts for the evolution of the
particle reactive surface during the combustion. The rate of mass change of the particle is defined
12
o
po k p
A S m R dt dm
(1.3)
Where mp is the particle mass, mpo is the initial particle mass, Rk is the kinetic rate, and A0 is the
initial particle surface area. S is the instantaneous internal reactive surface area, which is defined
as follow,
1 x
ψln 1 x 1 S
S
o
(1.4)
Where So is the initial reactive area, x is the conversion factor, and is the structure parameter
for the particular char/coal type.
1.2.4 Gasification Global Reactions
Coal gasification occurs when the coal is heated in limited oxygen and steam in a
gasification reaction chamber. The gasification process is very complicated, A simplified main
global reactions involved in gasification process can be modeled as follows:
Heterogeneous reactions:
C(s) + ½ O2 → CO HR = -110.5 MJ/kmol (R1.1)
C(s) + CO2 → 2CO HR = +172.0 MJ/kmol (R1.2)
(Gasification, Boudouard reaction)
C(s) + H2O (g) → CO + H2 HR = +131.4 MJ/kmol (R1.3)
(Gasification)
Homogeneous reactions:
CO + ½ O2 → CO2 HR = -283.1 MJ/kmol (R1.4)
CO + H2O (g) → CO2 + H2 HR = -41.0 MJ/kmol (R1.5)
(Water-shift)
The gasification of char by CO2 and H2O, reactions (R1.2) and (R.1.3), respectively, are
endothermic reactions. The exothermic two-step char combustion, reactions (R1.1) and (R1.4)
are needed to supply the energy needed in the gasification reactions. The synthetic gas produced
13 1.2.5 Types of Gasifiers
There are four main gasifier types: (a) entrained-flow gasifier, (b) transport gasifier, (c)
moving-bed gasifier, and (d) fluidized-bed gasifier. Explanations of each type and its examples
are presented below. The comparisons of these gasifiers are summarized in Table 1.2.
1.2.5.1 Entrained-Flow Gasifier
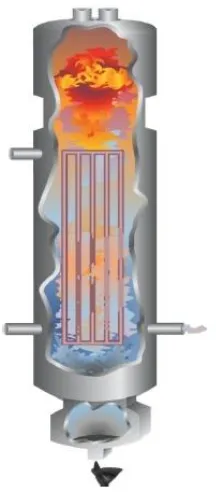
Figure 1.3 presents a simplified schematic the flow gasifier. In an
entrained-flow gasifier, very fine fuel particles (< 100 m) are suspended in a stream of oxygen/air and steam. Coal particles mix thoroughly with steam and oxygen, and the syngas produced exits
through the outlet. Entrained-flow gasifiers operate at very high temperature 1370-1650 C (2500-3000 F). Ash in the coal melts and is discharged as molten slag from the bottom of the gasifier. Entrained-flow gasifiers are available in larger capacities compared to other types. The
flow moves fast in the gasifier with a residence time typically about 3~5 seconds. The fast flow
rate and better mixing of fuel and oxidant in the entrained-flow gasifier when compared to
moving-bed and fluidized-bed gasifiers results in a higher carbon conversion efficiency and a
higher yield. However, an entrained-flow gasifier does have disadvantages as it requires the
highest amount of oxygen and produces the lowest heating value gas.
Figure 1.3 Schematic of a downdraft an entrained-flow gasifier [Holt (2004)]
14 (i) Shell Coal Gasification Process (SCGP)
The Shell gasifier is a high-pressure, dry-fed, oxygen-blown, entrained-flow gasifier.
Dry pulverized coal is fed into the high-pressure vessel with transport gas, which is usually
nitrogen, through a lock hopper system. Shell gasifier does not use refractory bricks for its wall,
but instead uses membrane walls. Steam and oxygen enter into the gasifier together with dry
coal particles. The gas temperature can reach 1370 C (2500 F). Because of the high temperature, no hydrocarbon volatiles and moisture will be left. At the high operating
temperature, ash in the coal melts and flows down the membrane wall. When the raw syngas at
the temperature of 1370-1650 C (2500-3000 F) leaves the vessel, it contains a small amount of unburned carbon as well as about half of the molten ash. To prevent the molten ash from
sticking to the wall, the raw syngas is partially cooled down to around 870 C (1600 F) by quenching it with cooled recycle product gas. The raw syngas goes through a further cooling
process in the syngas cooler unit for further clean up. The first commercial IGCC plant using the
Shell gasifier is Buggenum, Netherlands, which was built in 1993. The plant is able to achieve
an overall efficiency of 43%. It can process up to 2000 tons per day of coal.
15
(ii) General Electric Gasifier (Previously Texaco gasifier)
The General Electric (GE) gasifier (Fig. 1.5) operates in the temperature range of
1250-1450 C (2280-2650 F) and pressure of 3 MPa for power generation and 6-8 MPa for H2 and
chemical synthesis. Coal slurry and oxidant are introduced from the top of the gasifier. The
water in the slurry mixture replaces the steam which is normally injected into the system. The
hot raw gas produced during the gasification process flow toward the bottom of the gasifier. The
molten ash flows down the refractory-lined walls. The hot raw gas temperature is around 1400
C (2550 F). Two ways of raw syngas cooling are available: (a) cooling by water quenching, or
(b) cooling in a radiant cooler. When water quench is used, the raw syngas is also cleaned from
molten ash.
The first true IGCC demonstration technology was at the Southern California Edison
Cool Water Station in 1984 and used a GE (Texaco) gasifier. The Cool Water gasifier was
moved to a commercial installation at the Coffeyville refinery in Kansas after the completion of
the demonstration program in 1989. The gasifier is still in operation at the refinery, converting
petroleum coke into ammonia. There are currently 64 plants with GE gasifiers operating
worldwide with 10 more plants are in the planning.
16 (iii) Conoco-Phillips (E-Gas) Gasifier
The E-Gas gasifier is a two-stage, high-pressure, oxygen-blown, slurry-fed, slagging
gasifier. Coal is mixed with water to make coal-slurry. About 80% of the coal slurry and 100%
of the oxidant are injected into the first stage, while the remaining coal slurry is injected into the
second stage. The first stage is located at the bottom part of the gasifier, a horizontal cylinder
with one burner at each end. One is used for fresh coal slurry, and the other is for recycled
unburned char. Oxidation is dominant in the first stage, increasing the temperature to about
1316-1427 C (2400-2600 F). The ash melts and forms molten slag, which flows down and out of the vessel through a tap hole. The molten ash is quenched in a water bath and is removed.
The hot gas from the first stage flows up to the second stage where the remaining 20%
coal slurry is injected. The slow endothermic gasification reactions are dominant in the second
stage. Gas temperature reduces to around 1035 C (1900 F). The syngas and the unburned char leave the gasifier from the top. The unburned char is removed from the syngas in the gas
clean-up system and is recycled back into the gasifier's first stage.
17
(iv) PRENFLO (PREssurized ENtrained-FLOw) Gasifier
PRENFLO is a further development of Kopper-Totzek process developed in 1940s,
which operates at atmospheric pressure. PRENFLO was developed by Uhde, which later merged
with Krupp Koppers. PRENFLO is a one-stage, high pressure, dry-fed, oxygen-blown, slagging
gasifier. The gas temperature inside a PRENFLO gasifier can exceed 2000 C (3630 F) and uses membrane wall. PRENFLO gasifiers are used in the world's largest solid-feedstock-based
IGCC power plant in Puertolanno, Spain.
Figure 1.7a shows an illustration of a PSG (PRENFLO with Steam Generation) gasifier.
Coal is injected together with oxygen and steam through several injectors in the lower part of the
gasifier. Raw syngas is then sent through the waste heat boiler to cool down and produce steam.
The exit gas temperature is 1350-1600 C (2460-3910 F). In a PDQ (PRENFLOW with Direct Quench), illustrated in Fig. 1.7b, coal and oxygen/steam are injected in the upper part of the
gasifier. Raw syngas is directly quenched by water in the lower part of the gasifier. The syngas
18
(a) PSG (b) PDQ
Figure 1.7 (a) PRENFLO with Steam Generation (PSG) and (b) PRENFLO with Direct Quench (PDQ)
1. 2.5.2 Transport Gasifier
The Kellogg Brown & Root (KBR) transport gasifier, whose schematic is shown in Fig.
1.8, is a circulating-bed reactor that uses fine pulverized coal and limestone. The reactor consists
of a mixing zone, a riser, cyclones, and a standpipe. Oxidant and steam are fed at the bottom of
the gasifier in the mixing zone. The amount of oxidant fed is carefully controlled to limit char
combustion inside the gasifier. The steam added to the gasifier functions as a reactant and a
moderator to control the gas temperature. Oxidant reacts with the recycled unburned char. To
avoid premature combustion with oxygen, coal (and lime) is injected in the upper section of the
mixing zone. The endothermic char gasification primarily occurs in the riser. The gas and
particles flow up through the riser and into the cyclones, where the syngas and solids are
separated by gravity and/or centrifugal forces. The syngas exits the reactor and passed through
the gas cooler, while the solids are discharged back into the mixing zone through the standpipe.
The entrained-solids circulate the reactor through the riser, the cyclone, and the standpipe. The
KBR transport gasifier is a non-slagging gasifier. The moderate operating temperature (but
sufficiently high to thermally crack heavy volatiles and tar) and the use of dry coal means that
the syngas has low tar and oil contents. The exit syngas temperature is around 1000 C (1830
F). One of the advantages of the transport gasifier is that coal is injected in the relatively
low-temperature region (gasification region), so a typical problem related to fuel-injector's reliability
19
Figure 1.8 Kellog Brown & Root (KBR) transport gasifier
1. 2.5.3 Moving-Bed Gasifier
In a moving-bed gasifier, steam and air/oxygen flows through a fixed bed of solid fuel
particles as shown in Fig. 1.9. Fresh coal is fed from the top, while air or oxygen is injected
from the bottom. This configuration, the steam and oxygen/air feed is counter-current to the coal
feed, is referred to as "updraft" or counter-current moving-bed gasifier. Coal moves downward
slowly. Its residence time can reach 1 hour. The syngas exits from the upper part of the gasifier.
Ash and unreacted char are removed from the bottom. The depth of coal bed is kept constant by
adding fresh coal from the top. Another configuration is the "downdraft" or co-current
moving-bed gasifier, where steam and air/oxygen are fed from the top, co-current to the coal
feed.
A counter-current moving-bed gasifier can be divided into four zones (from top to
bottom): (i) the drying/preheating zone, (ii) the de-volatilization zone, (iii) the gasification zone,
and (iv) the combustion zone. The coal in the top zone is dried/preheated by hot gas that is
flowing from the bottom. The coals then moves down to the de-volatilization zone, where heat
from the hot gas drives volatiles out of coal particles. Gasification occurs in the next zone, and
20
moving-bed gasifier has high tar content because the tar released during the de-volatilization
process is carried away by the hot gas which is flowing up from gasification zone.
Ash can be removed from the bottom in the form of dry ash or slag. If dry ash is desired,
the gasifier temperature is usually kept below ash fusion temperature (1300 C or 2370 F). Moving-bed gasifiers have advantage of high char conversion, high thermal efficiency, and low
exit gas temperature (450-600 C or 840-1110 F). However, they have a disadvantage of low throughput (or yield).
Figure 1.9 Schematic of a counter-current moving-bed gasifier [Holt (2004)]
Examples of commercial moving-bed gasifier are:
(i) British Gas/Lurgi (BGL)
The British Gas/Lurgi (BGL) coal gasifier (Fig. 1.10) is a dry-fed, pressurized, fixed-bed,
and slagging gasifier. The reactor wall is water cooled and refractory lined. The coal mixture
enters from the top of the gasifier via a lock hopper system. Oxygen and steam enter through
injector on the sidewall. A motor-driven coal distributor/mixer stirs and evenly distributes the
incoming coal mixture inside the gasifier. The coal mixture descends gradually through several
process zones. The top layer of the bed is the pyrolysis and de-volatilization layer. The coal is
transformed into char and moves down the next zone, which is the gasification zone. Below the
gasification zone, any remaining carbon is oxidized, and the ash content melts and becomes slag.
The slag flows down through the opening on the bottom of the gasifier into a quench chamber.
The syngas leaves the reactor through the exit at the top of the gasifier at temperature
21
Figure 1.10 Schematic of the Britigh Gas Lurgi moving-bed gasifier
1. 2.5.4 Fluidized-Bed Gasifier
In a fluidized-bed gasifier, air or oxygen is injected upward at the bottom of solid fuel
bed, suspending the fuel particles. Schematic of a fluidized-bed gasifier is presented in Fig. 1.11.
The size (5-10mm) and weight of the particles prevent them from blowing out. The fuel feed
rate and the gasifier temperature are lower compared to those of entrained-flow gasifiers. The
operating temperature of a fluidized-bed gasifier is around 1000 C (1830 F), which is roughly only half of the operating temperature of a coal burner. This lower temperature has several
advantages:
Lower NOx emission. The temperature is not hot enough to break apart the nitrogen
molecules and cause the nitrogen atoms to join with oxygen atoms to form NOx.
No slag formation. The temperature is not hot enough to melt ash. It is suitable for coals
22
Lower syngas temperature, which means cheaper syngas cooling system prior to gas
clean up.
Figure 1.11 Schematic of fluidized-bed gasifier [Holt (2004)]
Fluidized-bed gasifiers require moderate supply of oxygen and steam. Examples of
commercial fluidized-bed gasifier are:
(i) High Temperature Wrinkler (HTW)
High Temperature Wrinkler (HTW) was developed by Rheinbraun in Germany to gasify
lignite's for the production of a reducing gas for iron ore. A schematic of an HTW gasifier is
presented in Fig. 1.12. The gasifier is of refractory-lined vessel equipped with water jacket.
Coal is dropped into the fluidized bed which consists of particles, semi-coke, and coal. The
gasifier is fluidized by the injection of air or oxygen/steam from the bottom. The temperature of
the bed is kept at around 800 C (1470 F), which is below the ash fusion temperature. An additional gasification gas is added at the freeboard to decompose undesirable byproducts
formed during gasification. The operating pressure can vary from 1 to 3 MPa. The raw syngas
exiting the top of gasifier is then passed through a cyclone to remove particulates and then
cooled. Particulates recovered in the cyclone are recycled back into the gasifier.
The HTW technology was successfully applied to produce methanol from lignite's at
Berrenrath, Germany, between 1986 and 1997. The plant was shut down at the end of 1997
because the process was no longer considered economically viable. In 1989, a 140 ton/day plant
was commissioned in Wesseling, Germany, to supplement research and development of the
23
Integrated Gasification Combined Cycle system (IGCC). There is presently a project to build a
400 MW IGCC plant in Czech Republic using the HTW technology developed at the Wesseling
plant.
Figure 1.12 Schematic of the High Temperature Wrinkler (HTW) Gasifier
(ii) Kellogg-Rust-Westinghouse (KRW)
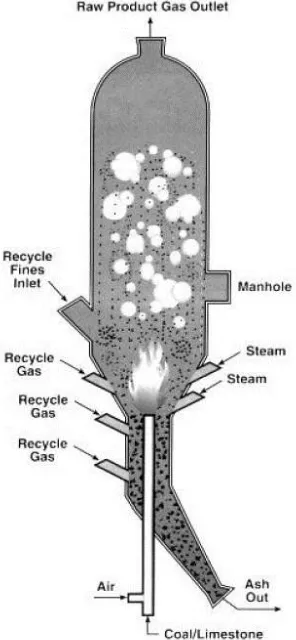
A schematic of a Kellogg-Rust-Westinghouse (KRW) gasifier is shown in Fig. 1.13. The
fuel and oxidant enter the bottom of the gasifier through concentric high-velocity jets, ensuring
thorough mixing of the fuel and oxidant and of the bed of char and limestone that collects in the
gasifier. Upon entering the gasifier, the coal releases its volatiles which then immediately burns,
releasing heat needed for the gasification. The combusted volatiles form large bubbles that rise
up to the center of the gasifier. This causes the char and the sorbent in the bed to move down the
sides of the gasifier and back into the central jet. The char in the bed reacts with the steam,
which is injected together with the oxidant and also through multiple other injections on the
bottom of the gasifier, to form syngas. The ash particles formed are denser than the coal, thus
24
the gasifier through the exit at the top is recaptured in the cyclone gas clean-up system and is
then injected back into the gasifier.
In 1997 through 2000, a 965MW Integrated Gasification Combined Cycle (IGCC)
demonstration plant using the KRW technology was carried out in Pinon Pine, Nevada, by Sierra
Pacific Resources and was sponsored by the US Department of Energy (DOE) as part of its
Clean Coal Technology Program. It was the only large-scale coal-base IGCC plant using the
KRW technology. Unfortunately, the plant faced numerous problems. It had 18 gasifier
start-ups and all of them failed due to equipment design.
25
Table 1.2 Summary of coal gasifier comparisons
Gasifier Type Entrained-flow Transport Moving-bed Fluidized-bed
Process Description Solid particles are mixed thoroughly with air and steam and are entrained by the flow.
Circulating-bed reactor consist of mixing zone, riser, cyclones, and stand pipe
Coal is fed from top and moves down by gravity. Air and steam are injected from bottom.
Solid particle bed is fluidized by air and steam.
Technology Providers Shell,GE,Conoco-Phillips (E-Gas), Future Energy, sSiemens
Kellogg-Brown Root (KBR)
BGL, Lurgi HTW, KRW
Size <100mm < 400mm 5-50mm 5-10mm
Caking coal No Yes Yes Yes
Coal rank Dry feed -- any Slurry feed -- high rank
Any Any Any
Syngas temperature High (1300-1600 ºC) Moderate (1000 ºC) Low (around 600 ºC) Moderate (1000 ºC)
Oxidant demand High Moderate Low Moderate
Steam demand Low Moderate High Moderate
Throughput High (residence time is 3-5 seconds)
High Low (residence time is 30 minutes to 1 hour)
Low Fuel feed:
Operating issues:
1.2.6 Mild Gasification Method
The method for obtaining gasification, partial gasification, and mild gasification are
different. One can distinguish them by knowing the definition of them. The definition of
gasification, partial gasification, and mild gasification are as follows:
Gasification or full gasification is the method in which the feedstock's goes through
complete de-volatilization, gasification, and the thermal cracking process into light composition
of CO, H2 and CH4 as the major combustible components of so called synthetic gas (or syngas).
Partial gasification only gasifies a portion of char.
Mild gasification emphasizes preserving the heavy volatiles without further gasifying
fixed carbon or thermally cracking the volatiles into lighter components.
To be specific, "Mild gasification" refers to the level of thermal cracking of volatiles by
controlling the temperature and residence time; while "Partial gasification" refers to the fraction
of char that is gasified by controlling the contact surface and time between CO2/H2O with the
char after de-volatilization.
There are two different conceptual designs of Mild gasifier are available: (a) Wormser
26 1.2.6.1 Wormser Mild Gasifier
Figure 1.14 illustrates the Wormser mild gasifier that was designed by Alex Wormser
(2008), Wormser Energy Solutions, Marblehead, MA, USA. Different from the full gasification
process, mild gasification is a process of devolatilizing a heavy carbonaceous fuel (biomass,
coal, petroleum bottoms, etc.) in an oxygen deficient environment to create a fuel gas out of the
volatile hydrocarbon components of the feedstock without thermally cracking further. The exit
gas can be cleaned and used in a gas turbine to generate electricity, while the char is combusted
in a conventional boiler to provide steam for power generation as well. The volatiles have
energy density about six times denser than fully-gasified syngas, so the flow volume is much less
resulting in smaller piping and clean up system. Since no additional energy is needed to fully
gasify the volatiles, the mild-gasification process requires less energy and thus less air for
combustion than the full char gasification of conventional gasify. This renders the Wormser mild
gasifier to be about 1/3rd the size of a full gasifier with the corresponding decrease in capital cost. By retaining the largest hydrocarbon molecules possible without risking condensation of the tars
on the clean-up equipment, the heating value of the syngas is higher than an air blown full
gasification cycle. Along with allowing the size of all the clean-up equipment to be smaller, the
higher heating value also makes it easier for the plant operator to select a gas turbine capable of
using this fuel.
By no means, the only option, Fig. 1.14 is one conceptual design of a mild gasifier that
contains the following: an inlet tube, burners, draft tube, deflector, distributor, char exit, syngas
cooler, syngas exit, and fluidized bed. Feedstock, such as coal, is injected from the bottom of the
draft tube via the inlet tube. As soon as the coal is introduced into the draft tube, it will be
instantly heated and pyrolyzed by the char circulating in the draft tube. The char leaving the draft
tube is diverted into the fluidized bed by the deflector. In this particular design, steam and air are
introduced into the bed to fluidize it and to provide reactants for some limited gasification
reactions. While the feedstock is not fully gasified, some of the carbon is converted to CO and
CO2 to provide the heat necessary for de-volatilization. There are burners, (in this case fueled by
recycle gas) for introducing more heat into the draft tube. The syngas exits from the top of the
gasifier, while the excess char is removed from the bottom to maintain a controlled bed level of
27
important to remember no chemical reactions need to take place to achieve mild gasification. As
long as a heat source is present, the coal volatiles will boil off and generate the syngas.
The concept of mild gasification can enable existing coal power plants nearing the end of
their service life to be retrofitted with a mild gasifier and gas turbine to increase their efficiency
by up to 18 percentage points (50% more) while decreasing emissions. By retrofitting old plants
we can increase power on the grid and decrease harmful emissions [Wormser, 2008].


![Figure 2.5 Schematic drawing of bubbling bed Atmospheric Fluidized Bed Combustor (AFBC) [Wen-Ching Yang (2003)]](https://thumb-us.123doks.com/thumbv2/123dok_us/8946137.1855505/60.612.172.477.404.653/figure-schematic-drawing-bubbling-atmospheric-fluidized-combustor-ching.webp)