R E S E A R C H
Open Access
Effects of plant essential oil supplementation
on growth performance, immune function
and antioxidant activities in weaned pigs
Guoqi Su
1†, Xuanwu Zhou
1†, Yu Wang
1, Daiwen Chen
1, Guang Chen
2, Yan Li
2and Jun He
1*Abstract
Background:The aim of this study was to determine the effects of plant essential oil supplementation on growth performance, immune function and antioxidant activities in weaned pigs.
Methods:In the study, 24 weaned pigs were used to explore the effects of plant essential oil (PEO) on growth performance, immune properties and antioxidant activities. Pigs were fed with a basal diet (CON) or basal diet containing different concentrations of PEO (PEO50: 50 ppm; PEO100: 100 ppm; PEO200: 200 ppm). After 3 weeks, all pigs were slaughtered and blood and tissue samples were collected for biochemical analysis.
Results:The results showed that PEO supplementation quadratically increased body weight gain (BWG) (P= 0.031), linearly (P< 0.05) and quadratically (P< 0.05) decreased F:G. In addition, IgG increased linearly (P< 0.05) and IgM increased linearly (P< 0.05) and quadratically (P< 0.05) as PEO supplementation. Similarly, MDA in serum, jejunal mucosa and pancreas were linearly decreased (P< 0.05) and GSH in serum (linear and quadratic,P< 0.05), duodenal mucosa (linear and quadratic,P< 0.05) and in ileal mucosa (linear and quadratic,P< 0.05) were notably increased. Futhermore, antioxidant-related genes expression levels ofGSTin spleen (linear and quadratic,P< 0.05),GPX1 (quadratic, P< 0.05) andSOD1 (linear,P< 0.05) in spleen and GST in liver (quadratic,P< 0.05) were markedly upregulated by PEO supplementation increasing.
Conclusions:These results suggest that PEO improves growth performance, immune function, and antioxidant activities in weaned pigs, and it may also relieve weaning stress if used as a feed additive in the livestock industry. And that supplementation 200 ppm PEO in diet would seem to be economically feasible.
Keywords:Antioxidant activities, Growth performance, Immunity, Plant essential oil, Weaned pigs
Background
Recent studies have indicated that weaning can induce oxidative stress in pigs, resulting in oxidative damage [1]. Weaning stress has been reported to disrupt intestinal health, cause diarrhea, and to reduce growth and immun-ity in pigs [2–4]. Over the past number of decades, antibi-otics, zinc oxide, and copper sulfate have been widely utilized in the swine industries for their effects in reducing diarrhea and improving immunity in weanling pigs [5–7]. However, the abuse of these additives has led to antibiotic resistance and heavy metal residues in livestock products.
The rising incidence of these serious problems has com-pelled research institutes and farmers alike to search for safe feed additives [8–10].
Many essential oils from plants, either extracted or in their natural form, are used for their antioxidative prop-erties, which are mainly due to phenolic compounds in the oil or in other phytochemical fractions [11, 12]. Some nonphenolic substances also exhibit considerable antimicrobial and antioxidative potential [13, 14]. Previ-ous studies have reported that essential oils may improve nutrient digestibility, as well as intestinal morphology and microflora [15–17]. Other studies have reported that essential oil supplementation improved the nutritional value and oxidative stability of fat, meat, and eggs, resulting in longer shelf-life [18–23]. These previous * Correspondence:[email protected]
†Guoqi Su and Xuanwu Zhou contributed equally to this work.
1Institute of Animal Nutrition, Sichuan Agricultural University, Chengdu,
Sichuan 611130, People’s Republic of China
Full list of author information is available at the end of the article
findings regarding animal products led us to hypothesize whether essential oils could improve systemic redox bal-ance and reduce oxidative injury induced by weaning stress in young pigs.
Cinnamaldehyde is an organic compound with the formula C6H5CH=CHCHO, and thymol is a natural
mono-terpene phenol with the formula C10H14O (Fig.1). Although
several studies have indicated that cinnamaldehyde and thy-mol can improve growth performance, nutrient digestibility, and intestinal morphology, and stabilize the microflora of weaned pigs and poultry [11,17,24,25], the effects of cin-namaldehyde and thymol on antioxidant activity and im-mune function in weaned pigs is still unclear. Therefore, the purpose of this study was to explore the effects of dietary supplementation with plant essential oil on both immune function and antioxidant activity in weaned pigs.
Methods
Animals and experimental design
A total of twenty-four commercial crossbred DLY (Duroc × Large White × Landrace) male pigs weaned at 35 d with average weight 9.19 kg (SEM 0.34) were ran-domly assigned to four groups (n= 6): 1) CON (control; a basal diet), 2) PEO50 (basal diet containing 50 ppm PEO), 3) PEO100 (basal diet containing 100 ppm PEO), 4) PEO200 (basal diet containing 200 ppm PEO). PEO was provided by Cheng Du Hua Luo Bio-Tech Col. and the active ingredient of PEO was 13.5% thymol and 4.5% cinnamyl aldehyde, carrier was dextrin.
Diets and feeding management
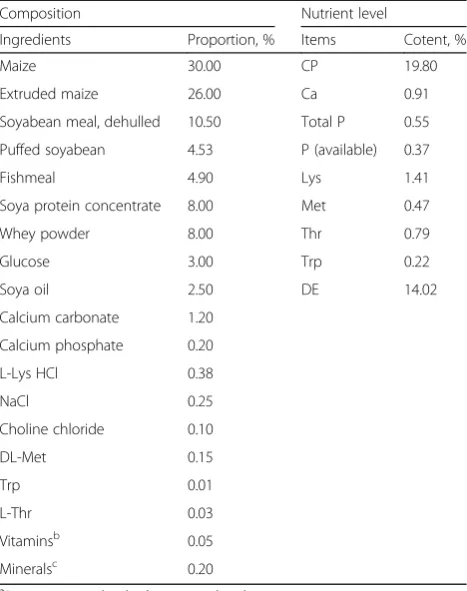
Diets were corn-soybean based diets and formulated ac-cording to National Research Council 2012 requirements [26]. Ingredients and nutrient composition of experi-mental diets are shown in Table 1. Diets were fed in mash form throughout the experiment.
The experiment was carried out at the Research Base of the Institute of Animal Nutrition of Sichuan Agricultural University. All the pigs were housed in an environmentally controlled nursery room in individual metabolism cages (1.5 m × 0.7 m × 1.0 m). The pigs had free access to diet
and water throughout the 2-week feeding trial, and were fed with the experimental diets 4 times daily at 08:00, 12:00, 16:00 and 20:00. Temperature was gradually re-duced from 28 °C to 23 °C, and the humidity was con-trolled between 50 and 60%. Pigs were weighed at 08:00 on an empty stomach on days 0 and 14.
Sample collection
Blood samples were collected from the portal vein precava into Vacuum pick blood vessels without anticoagulation (Axygen Biotechnology Co. Ltd) at 8:00 in the morning on day 14. From each sample, serum were collected by centri-fuging the blood (3500 g, 4 °C, 10 min) and immediately stored at−20 °C. All pigs were slaughtered by exsanguin-ation according to protocols approved by the Sichuan Agricultural University Animal Care Advisory Committee. Mucosa of duodenum, jejunum and ileum, spleen, liver and pancreas were collected and snap frozen in liquid N2
and then stored at−80 °C for assay.
Fig. 1Chemical structure of thymol (a) and cinnamaldehyde (b)
Table 1Compositions and nutrient levels of the basal diet (air-dried basis)a
Composition Nutrient level
Ingredients Proportion, % Items Cotent, %
Maize 30.00 CP 19.80
Extruded maize 26.00 Ca 0.91
Soyabean meal, dehulled 10.50 Total P 0.55
Puffed soyabean 4.53 P (available) 0.37
Fishmeal 4.90 Lys 1.41
Soya protein concentrate 8.00 Met 0.47
Whey powder 8.00 Thr 0.79
Glucose 3.00 Trp 0.22
Soya oil 2.50 DE 14.02
Calcium carbonate 1.20
Calcium phosphate 0.20
L-Lys HCl 0.38
NaCl 0.25
Choline chloride 0.10
DL-Met 0.15
Trp 0.01
L-Thr 0.03
Vitaminsb 0.05
Mineralsc 0.20
a
Dietary nutrient level value was analyzed b
The vitamin and mineral premix (maize powder as diluent) provided the following amounts per kg complete diet: retinol, 8.4 mg; cholecalciferol, 0.008 mg; vitamin E, 20 mg; menadione, 1 mg; vitamin B12, 0.03 mg; riboflavin, 5 mg; niacin, 20 mg; pantothenic acid, 15 mg; folic acid, 0.5 mg; thiamin, 1.5 mg; pyridoxine, 2 mg; biotin, 0.1 mg
c
Growth performance
Individual initial and final body weight were recorded on day 0 and day 14. Body weight gain (BWG) was calcu-lated as final body weight subtract initial body weight. Average daily gain (ADG) was calculated as weight (kg)/ number of days from initial to final weight.
Immunity parameters
The levels of total protein (TP), albumin (ALB), IgG and IgM in serum were examined using the Hitachi 7020 Automatic Analyzer (Tokyo, Japan). The level of IgA in serum was measured using an ELISA test kit (R&D Systems, Minneapolis, MN, USA) according to the man-ufacturer’s instructions, the absorbance was determined with a 96-well microtiter plate reader Spectramax M2 (Molecular Devices, Sunnyvale, CA).
Antioxidant indices in serum and tissues
Tissues of duodenum, jejunum, ileum, spleen, liver and pancreas were homogenized (1:10, w:v) in glass homogenizer with ice-cold 0.9% normal saline. Homogenate were collected by centrifuging 3500 g, 4 °C, 15 min. TP, glutathione (GSH), catalase (CAT), total anti-oxidant capacity (T-AOC), Malondialdehyde (MDA) and total superoxide dismutase (T-SOD) of serum and tissues were quantified by spectrophotometric methods using a spectrophotometer (Leng Guang SFZ1606017568, Shang-hai, China).
Total protein concentration analysis
Total protein assay kit BCA (A045–3) was purchased from Nanjing Jiancheng Bioengineering Institute (Nan-jing, China). Apple green BCA reacted with protein at 37 °C for 30 min and formed a purple compound featur-ing absorbance at 562 nm. TP results are expressed as aprot per litre (gprot/L) of tissues.
GSH content analysis
GSH content was measured according to previous report. [4] Reduced GSH assay kit (A006–2, Nanjing
Jiancheng Bioengineering Institute (Nanjing, China)) was used according manufacturer’s instructions. GSH con-tent was expressed in gGSH/L and mgGSH/gprot in serum and tissues respectively by using commercial GSH as a standard.
CAT activity analysis
CAT activity was measured according to previous report [27]. CAT assay kit (A007–1, Nanjing Jiancheng
Bioengineering Institute (Nanjing, China)) was used ac-cording manufacturer’s instructions. The reaction of CAT decomposing H2O2 was rapidly stopped reaction
after adding ammonium molybdate. The rest of H2O2
reacted with ammonium molybdate and formed a pale
yellow complex compound featuring absorbance at 405 nm. CAT results were expressed in U/mL and U/ gprot in serum and tissues respectively.
T-AOC activity analysis
T-AOC activity was measured according to previous re-port [28]. Total antioxidant capacity assay kit (A015–1,
Nanjing Jiancheng Bioengineering Institute (Nanjing, China)) was used according manufacturer’s instructions. T-AOC activity was expressed in U/mL and U/gprot in serum and tissues respectively.
MDA content analysis
MDA content was analyzed as described by previous re-port [29]. MDA assay kit (TBA method) (A003–1,
Nanjing Jiancheng Bioengineering Institute (Nanjing, China)) was used according manufacturer’s instructions. MDA reacted with thiobarbituric acid (TBA) formed a red-complex compound featuring absorbance at 532 nm. MDA results were expressed in nmol/mL in serum and tissues.
T-SOD activity analysis
T-SOD activity was analyzed as described by previous report [30]. Total Superoxide Dismutase (T-SOD) assay kit (Hydroxylamine method) (A001–1, Nanjing Jian-cheng Bioengineering Institute (Nanjing, China)) was used according manufacturer’s instructions. Superoxide ions reacted with 2-(4-iodophenyl)-3- (4-nitrophe-nol)-5-phenyltetrazolium chloride to form a red forma-zan dye featuring absorbance at 550 nm. T-SOD activity was expressed in U/mL in serum and tissues.
RNA isolation and real-time quantitative PCR
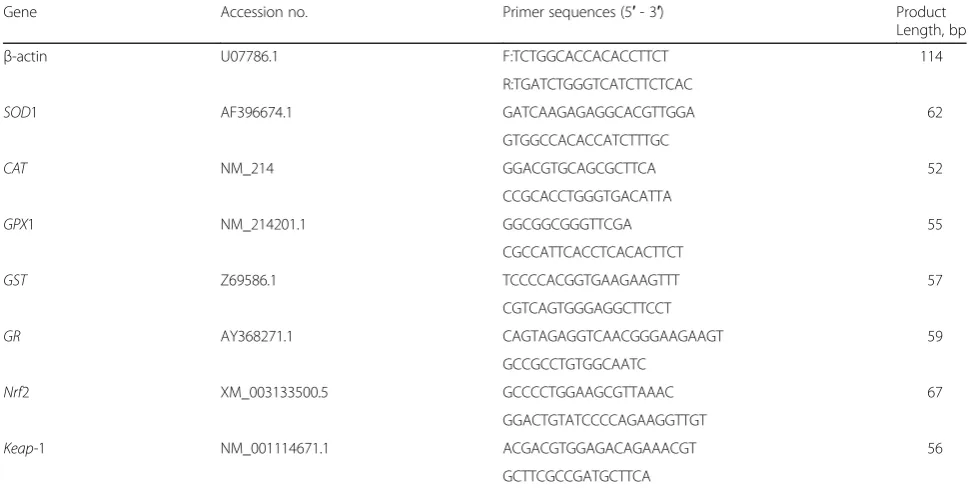
Total RNA from samples of spleen, liver and pancreas was extracted using TRIzol reagent (TaKaRa, Dalian, China) according to the manufacturer’s instructions. RNA con-centration was measured by Nanodrop 2000 (Thermo Fisher Scientific, Wilmington,DE, USA). The integrity of RNA was verified by eletrophoretic analysis. Complemen-tary DNA (cDNA) was achieved by reverse transcription with 2μg RNA sample using the PrimeScript™RT reagent Kit (TaKaRa, Dalian, China) according to the manufac-turer’s instructions. 20μL final reaction volume of cDNA was then diluted to 250μL using nuclease-free water and stored at−20 °C. The cDNA was used as the template for PCR. Real-time quantitative PCR was performed on cDNA using the ABI PRISM 7500 Fast Sequence Detec-tion System for ninety-sixwell plates (Applied Biosystems). The primers of β-actin, superoxide dismutase 1 (SOD1),
was used as an internal control. All the genes of each sam-ple were repeated in triplicate. For each reaction, 5μL of freshly SYBR® Premix Ex Taq™ II (Tli RNaseH Plus, 2×), 1 μL forward primers (4 mmol/L) and 1 μL reverse primers (4 mmol/L), 1 μL of cDNA and 2 μL nuclease-free water were added and made up to final vol-ume of 10μL. The PCR programme was as follow: a pre-degeneration at 95 °C for 10 min for one cycle, followed by denaturation at 95 °C for 5 s, annealing temperature at 60 °C for 45 s, extension temperature at 72 °C for 10 s for forty cycles. After amplification, the melting peaks of the amplification products were determined by melting curve which indicated only one expected amplification products had been generated. Melting curve conditions were as fol-lows: 1 cycle of denaturation at 95 °C for 10 s and then 65 °C changed to 95 °C with a temperature change vel-ocity of 0.5 °C/s. The standard curve of each gene was run in triplicate for obtaining reliable amplification efficiency values. The correlation coefficients of all the standard curves were > 0.99, and the amplification efficiency values were between 90 and 110%. Each primer pair used yielded a single peak in the melting curve and a single band with the expected size in agarose gel. The mean Ct values of duplicates of each sample were used for calculations. The relative gene expressions compared with the housekeeping gene b-actin were calculated by 2-CT[31].
Statistical analysis
All data were analysed using SPSS 20.0 software (SPSS, Inc.) by curve estimation model of regression procedure.
The effect of PEO supplementation was determined by linear and quadratic effects in individual pig unit. All data were expressed as mean ± standard error. The sig-nificance level for all analyses was set atP< 0.05, with a trend of 0.05≤P≤0.01.
Results
Effect of PEO on growth performance
As indicated in Table3, the BWG increased quadratically (P= 0.031), PEO200 increased the BWG 0.52 kg than CON. In addition, F:G also decreased linearly (P= 0.008) and quadratically (P= 0.007) as supplementation of PEO increased. PEO200 decreased 0.13 than CON in F: G.
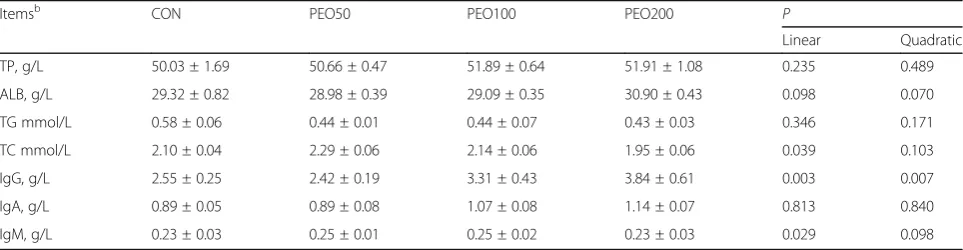
Effect of PEO on blood biochemical parameters and serum immunoglobulins
The effect of PEO supplementation on the level of serum TP, ALB, IgG, IgA and IgM were presented in Table 4. IgG increased linearly (P= 0.029) and IgM in-creased linearly (P= 0.003) and quadratically (P= 0.007) as supplementation of PEO increased. And then, supple-mentation of PEO tended quadratically (P= 0.098) increase IgM and linearly (P= 0.098) and quadratically (P= 0.070) increase ALB. Moreover, serum cholesterol was linearly (P= 0.039) as PEO supplementation.
Effect of PEO on serum antioxidant activity
There was a significant increase in serum GSH with increasing levels of PEO (linear, P< 0.01; quadratic,
Table 2Primers sequences used for quantitative RT-PCRa
Gene Accession no. Primer sequences (5′- 3′) Product
Length, bp
β-actin U07786.1 F:TCTGGCACCACACCTTCT 114
R:TGATCTGGGTCATCTTCTCAC
SOD1 AF396674.1 GATCAAGAGAGGCACGTTGGA 62
GTGGCCACACCATCTTTGC
CAT NM_214 GGACGTGCAGCGCTTCA 52
CCGCACCTGGGTGACATTA
GPX1 NM_214201.1 GGCGGCGGGTTCGA 55
CGCCATTCACCTCACACTTCT
GST Z69586.1 TCCCCACGGTGAAGAAGTTT 57
CGTCAGTGGGAGGCTTCCT
GR AY368271.1 CAGTAGAGGTCAACGGGAAGAAGT 59
GCCGCCTGTGGCAATC
Nrf2 XM_003133500.5 GCCCCTGGAAGCGTTAAAC 67
GGACTGTATCCCCAGAAGGTTGT
Keap-1 NM_001114671.1 ACGACGTGGAGACAGAAACGT 56
GCTTCGCCGATGCTTCA
a
P< 0.01) (Table 5). Serum MDA increased linearly (P= 0.030) as supplementation of PEO increased.
Effect of PEO on intestinal mucosal antioxidant activity The effect of PEO supplementation on the level of intes-tinal mucosa TP, GSH, T-AOC, T-SOD, MDA and CAT were presented in Table6. There was a significant increase in GSH with increasing levels of PEO in duodenal mucosa (linear,P= 0.007; quadratic,P= 0.029) and in ileal mucosa (linear, P= 0.011; quadratic, P= 0.032). MDA in jejunal mucosa decreased linearly (P= 0.042) as supplementation of PEO increased.
Effect of PEO on splenic, hepatic and pancreatic antioxidant activity
The levels of GSH, CAT, T-AOC, T-SOD and MDA in spleen, liver and pancreas were measured (Table7). GSH in pancreas increased linearly (P= 0.007) and quadratically (P= 0.032) as supplementation of PEO increased. There was a decrease at 100 ppm (linear,P= 0.032) in MDA of pancreas with no further decrease at 200 ppm.
Effect of PEO on the expression of critical antioxidant-related genes
Gene expression of GR, GST, GPX1, CAT, SOD1, Nrf1 and Keap1 was measured (Table 8). Expression of GST in spleen increased linearly (P= 0.012) and quadratically (P= 0.007) as supplementation of PEO increased. There was a tendency to increase expression level ofKeap1 with increasing levels of PEO in spleen (quadratic, P= 0.085). An increased in GPX1 (quadratic, P= 0.029), CAT (quadratic,P= 0.051) andSOD1(linear,P= 0.029) was ob-served in the spleen of pigs supplemented with 200 ppm PEO. Moreover, the expression of GSTin liver increased quadratically (P= 0.049) as supplementation of PEO in-creased. However, the expression of Nrf2 in liver de-creased linearly (P= 0.023) and quadratically (P= 0.029) as supplementation of PEO increased. Furthermore, there was no effect on the expression of GR,GST,GPX1,CAT,
SOD1,Nrf1 andKeap1 in pancreas with increasing dietary inclusion level of PEO.
Discussion
Weaning stress syndrome was an inevitable problem, which could lead weaning stress, oxidative stress, and Table 3Growth performance of weaned pigs fed different levels of PEOa
Itemsb CON PEO50 PEO100 PEO200 P
Linear Quadratic
IBW 9.25 ± 0.41 9.18 ± 0.24 9.16 ± 0.61 9.17 ± 0.49 0.977 0.294
FBW 15.53 ± 0.28 15.52 ± 0.20 15.55 ± 0.76 16.00 ± 0.54 0.922 0.895
BWG, kg 6.41 ± 0.55 6.33 ± 0.23 6.39 ± 0.71 6.83 ± 0.33 0.657 0.031
ADG, kg/d 0.45 ± 0.04 0.45 ± 0.02 0.46 ± 0.05 0.50 ± 0.03 0.114 0.099
ADFI, kg/d 0.67 ± 0.07 0.70 ± 0.03 0.67 ± 0.19 0.66 ± 0.04 0.770 0.829
F:G 1.47 ± 0.05 1.55 ± 0.07 1.43 ± 0.38 1.34 ± 0.09 0.008 0.007
Treatments: CON means basal diet; PEO50 means basal diet with 50 ppm PEO; PEO100 means basal diet with 100 ppm PEO; PEO200 means basal diet with 200 ppm PEO a
Values are means ± S.E, n = 6 b
IBWinitial body weight,FBWfinal body weight,BWGbody weight gain,ADGaverage daily gain
Table 4immune function of weaned pigs fed different levels of PEOa
Itemsb CON PEO50 PEO100 PEO200 P
Linear Quadratic
TP, g/L 50.03 ± 1.69 50.66 ± 0.47 51.89 ± 0.64 51.91 ± 1.08 0.235 0.489
ALB, g/L 29.32 ± 0.82 28.98 ± 0.39 29.09 ± 0.35 30.90 ± 0.43 0.098 0.070
TG mmol/L 0.58 ± 0.06 0.44 ± 0.01 0.44 ± 0.07 0.43 ± 0.03 0.346 0.171
TC mmol/L 2.10 ± 0.04 2.29 ± 0.06 2.14 ± 0.06 1.95 ± 0.06 0.039 0.103
IgG, g/L 2.55 ± 0.25 2.42 ± 0.19 3.31 ± 0.43 3.84 ± 0.61 0.003 0.007
IgA, g/L 0.89 ± 0.05 0.89 ± 0.08 1.07 ± 0.08 1.14 ± 0.07 0.813 0.840
IgM, g/L 0.23 ± 0.03 0.25 ± 0.01 0.25 ± 0.02 0.23 ± 0.03 0.029 0.098
Treatments: CON means basal diet; PEO50 means basal diet with 50 ppm PEO; PEO100 means basal diet with 100 ppm PEO; PEO200 means basal diet with 200 ppm PEO
a
Values are means ± S.E, n = 6 b
adversely affects intestinal health, leads to diarrhea, and reduces growth and immunity in pigs [2–4]. Oxidative stress is caused by excess oxidative radicals, including
reactive oxygen species, which damage DNA,
bio-membrane lipids, and proteins, and also impair tis-sue function [32,33]. This may be the reason that wean-ing stress syndrome reduces growth performance and economic benefit in pig production. Thymol and cinna-maldehyde are concentrated hydrophobic liquids con-taining volatile aromatic compounds extracted from
plants, which have unique chemical structures (Fig. 1) and could be used as natural antioxidants [11,34].
In this study, dietary supplementation of PEO at a dose of 200 ppm quadratically improved BWG of pigs after weaning. As well as, ADG tended to increase qua-dratically as 200 ppm PEO supplementation increased. Because of there was no effect on average daily feed intake (ADFI) with the increasing PEO addition. So the most important reason for growth performance im-provement was feed efficiency. F:G decreased linearly Table 5Antioxidant in serum of weaned pigs fed different levels of PEOa
Itemsb CON PEO50 PEO100 PEO200 P
Linear Quadratic
CAT, U/mL 18.89 ± 1.26 19.62 ± 1.22 20.22 ± 0.52 20.18 ± 0.53 0.248 0.456
T-AOC, U/mL 2.10 ± 0.10 2.13 ± 0.12 2.16 ± 0.24 2.32 ± 0.13 0.451 0.642
MDA, nmol/mL 3.68 ± 0.40 3.21 ± 0.24 3.08 ± 0.47 2.67 ± 0.28 0.030 0.100
T-SOD, U/mL 18.15 ± 0.37 18.34 ± 0.18 18.67 ± 0.42 18.27 ± 0.13 0.721 0.388
GSH, mgGSH/L 3.12 ± 0.58 2.94 ± 0.38 3.98 ± 0.56 4.44 ± 0.39 < 0.01 < 0.01
total superoxide dismutase; GSH, glutathione
Treatments: CON means basal diet; PEO50 means basal diet with 50 ppm PEO; PEO100 means basal diet with 100 ppm PEO; PEO200 means basal diet with 200 ppm PEO a
Values are means ± S.E,n= 6 b
CATcatalase,T-AOCtotal antioxidant capacity,MDAmethane dicarboxylic aldehyde,T-SODTotal superoxide dismutase
Table 6Antioxidant in intestinal mucosa of weaned pigs fed different levels of PEOa
Itemsb CON PEO50 PEO100 PEO200 P
Linear Quadratic
Duodenal mucosa
TP, gprot/L 77.09 ± 7.06 78.38 ± 11.38 78.30 ± 6.59 76.29 ± 11.63 0.960 0.981
GSH, mgGSH/gprot 5.22 ± 0.93 5.73 ± 1.35 10.97 ± 0.80 12.02 ± 2.30 0.007 0.029
T-AOC, U/mgprot 0.21 ± 0.06 0.23 ± 0.02 0.28 ± 0.02 0.27 ± 0.01 0.157 0.369
T-SOD, U/mL 24.37 ± 1.83 24.79 ± 3.97 24.08 ± 1.71 24.90 ± 0.31 0.921 0.992
MDA, nmol/mL 36.93 ± 4. 50 26.64 ± 4.24 24.62 ± 6.15 19.37 ± 6.43 0.166 0.397
CAT, U/gprot 16.32 ± 2.15 17.73 ± 0.71 17.78 ± 1.83 18.55 ± 2.72 0.380 0.676
Jejunal mucosa
TP, gprot/L 83.91 ± 10.41 85.10 ± 10.95 83.61 ± 10.58 84.48 ± 10.08 0.992 1.000
GSH, mgGSH/gprot 1.95 ± 0.47 2.48 ± 1.29 3.87 ± 1.35 2.80 ± 0.84 0.562 0.121
T-AOC, U/mgprot 0.23 ± 0.03 0.27 ± 0.01 0.28 ± 0.06 0.27 ± 0.07 0.381 0.600
T-SOD, U/mL 13.95 ± 0.97 16.16 ± 1.79 19.14 ± 3.02 20.12 ± 2.22 0.069 0.199
MDA, nmol/mL 37.60 ± 12.01 33.60 ± 3.27 32.90 ± 8.40 14.00 ± 2.79 0.042 0.076
CAT, U/gprot 4.63 ± 0.83 5.05 ± 0.39 5.35 ± 0.32 6.13 ± 1.13 0.254 0.528
Ileal mucosa
TP, gprot/L 138.13 ± 6.15 160.16 ± 9.18 131.34 ± 10.15 149.74 ± 16.24 0.974 0.999
GSH, mgGSH/gprot 1.15 ± 0.11 1.98 ± 0.26 2.01 ± 0.29 2.35 ± 0.16 0.011 0.032
T-AOC, U/mgprot 0.14 ± 0.01 0.18 ± 0.03 0.19 ± 0.02 0.19 ± 0.03 0.126 0.210
T-SOD, U/mL 9.16 ± 0.80 9.11 ± 0.44 9.66 ± 0.17 9.68 ± 0.55 0.509 0.812
MDA, nmol/mL 91.41 ± 6.66 87.18 ± 13.15 83.04 ± 3.93 71.57 ± 4.29 0.246 0.506
CAT, U/gprot 5.36 ± 0.31 5.25 ± 0.83 6.64 ± 0.73 7.46 ± 1.03 0.114 0.279
Treatments: CON means basal diet; PEO50 means basal diet with 50 ppm PEO; PEO100 means basal diet with 100 ppm PEO; PEO200 means basal diet with 200 ppm PEO a
Values are means ± S.E,n= 6 b
and quadratically as PEO supplementation and 200 ppm PEO supplementation obtained the best F:G. In agree-ment with our results, previous studies have docu-mented similar positive effects of PEO supplementation on growth performance in weaned pigs [17,24]. The im-provement in nutrient absorption may be partly explained by increased secretions of saliva, bile and en-hanced enzyme activity [35–38].
Moreover, PEO supplementation has been reported to improve the immune status of pigs after weaning, as indicated by increased serum immunoglobulin levels [15, 17]. Our results indicated that PEO supplementation increased the levels of ALB, IgA, and IgG in serum, and 200 ppm PEO addition got the highest levels. It is well known that IgG offers newborn pigs extended systemic protection, while IgA and IgM offer transient luminal pro-tection [39]. During the first few days after weaning, pig-lets often experience low feed intake or starvation issues that can represent a major challenge for the producer. Therefore, the administration of 200 mg/kg PEO to piglets during this time probably improve their immune status and prevent oxidative stress.
Oxidative stress is caused by excess oxidative radicals, in-cluding reactive oxygen species (ROS) and reactive nitrogen species (RNS), which damage DNA, bio-membrane lipids, proteins, and other macromolecules [32]. However, excess
oxidative radicals can be eliminated by antioxidants, in-cluding nonenzymatic components and a series of enzymes. Within the enzymatic antioxidant system, super-oxide dismutase and glutathione peroxidase are the most important compounds [21], working together to detoxify superoxide anions and hydrogen peroxide in cells [33]. Superoxide dismutase catalyzes superoxide anions to produce hydrogen peroxide and molecular oxygen. Glutathione peroxidase normally converts H2O2to water
[21]. The capabilities of the non-enzymatic antioxidant defense system are often measured as the total antioxidant capacity [40]. Furthermore, the level of malondialdehyde, a major product of lipid peroxidation, is an effective marker of oxidative stress in sepsis [21].
In the present study, we measured GSH, CAT, MDA, and T-SOD levels, as well as T-AOC, in serum, intestinal mucosa, spleen, liver, and pancreas. Present results indi-cated that PEO supplementation significantly increased GSH levels in serum, duodenal and ileal mucosa and pancreas, T-SOD activity in jejunal mucosa and spleen, and significantly decreased MDA levels in serum, jejunal mucosa and pancreas. The results of this study were consistent with previous reports that T-AOC was im-proved and plasma MDA level was decreased in pigs re-ceiving supplemental PEO [15, 41, 42]. Previous study have confirmed that PEO could save the depletion of Table 7Antioxidant in spleen, liver and pancreas of pigs fed different levels of PEOa
Itemsb CON PEO50 PEO100 PEO200 P
Linear Quadratic
Spleen
GSH, mgGSH/gprot 1.85 ± 0.51 1.65 ± 0.24 1.88 ± 0.04 2.19 ± 0.15 0.431 0.546
CAT, U/gprot 9.87 ± 0.71 9.33 ± 1.13 11.34 ± 0.68 10.49 ± 1.08 0.334 0.635
T-AOC, U/mgprot 0.21 ± 0.04 0.21 ± 0.05 0.22 ± 0.02 0.22 ± 0.02 0.812 0.963
T-SOD, U/mL 255.62 ± 10.52 247.22 ± 26.99 302.45 ± 8.38 291.02 ± 9.06 0.076 0.219
MDA, nmol/mL 146.00 ± 8.86 175.07 ± 26.70 128.41 ± 5.08 117.84 ± 7.44 0.132 0.190
Liver
GSH, mgGSH/gprot 1.84 ± 0.30 1.35 ± 0.10 2.59 ± 0.30 2.53 ± 0.48 0.113 0.256
CAT, U/gprot 200.89 ± 19.50 204.58 ± 6.33 210.14 ± 19.42 206.30 ± 12.45 0.788 0.949
T-AOC, U/mgprot 0.52 ± 0.06 0.43 ± 0.11 0.49 ± 0.08 0.55 ± 0.13 0.489 0.238
T-SOD, U/mL 1127.18 ± 59.43 1132.51 ± 58.80 1161.75 ± 97.09 1200.82 ± 99.96 0.562 0.837
MDA, nmol/mL 273.32 ± 29.23 280.04 ± 26.55 266.00 ± 60.44 263.64 ± 21.62 0.835 0.974
Pancreas
GSH, mgGSH/gprot 2.23 ± 0.30 2.41 ± 0.43 4.47 ± 0.66 4.52 ± 1.08 0.007 0.032
CAT, U/gprot 4.99 ± 0.79 5.14 ± 0.39 5.22 ± 0.12 6.40 ± 0.81 0.230 0.404
T-AOC, U/mgprot 0.14 ± 0.02 0.12 ± 0.02 0.13 ± 0.03 0.14 ± 0.01 0.906 0.804
T-SOD, U/mL 232.93 ± 16.47 207.09 ± 12.92 276.46 ± 25.64 257.91 ± 9.82 0.131 0.299
MDA, nmol/mL 45.52 ± 1.12 61.65 ± 9.02 28.64 ± 5.58 29.96 ± 3.40 0.032 0.068
aldehyde; T-SOD, total superoxide dismutase
Treatments: CON means basal diet; PEO50 means basal diet with 50 ppm PEO; PEO100 means basal diet with 100 ppm PEO; PEO200 means basal diet with 200 ppm PEO a
Values are means ± S.E, n = 6 b
SOD and GSH-Px or enhance their capabilities [21]. The increased GSH and decreased MDA levels in serum in-dicated that whole-body antioxidant status was im-proved, and lipid peroxidation was reduced. In addition, the reduced MDA levels and improvements in GSH levels and T-SOD activity suggested that PEO could enhance both the non-enzymatic and enzymatic reactions of the antioxidant defense system. Various natural antioxidant extracts have been used to protect pigs from weaning stress in intensive pig production [1]. Our results suggests that dietary PEO supplementation may reduce oxidative stress and have the potential to ameliorate the adverse effects of early weaning syndrome.
In order to elucidate the mechanism of PEO antioxi-dant activity in weaned pigs, we measured the expres-sion ofSOD1,CAT,GPX1,GST,GR,Nrf2, andKeap-1 in the spleen, liver, and pancreas. Keap-1 is the cytosolic protein with which the transcription factor Nrf2 is
associated, and which functions to protect against oxidative stress. Oxidative stress modifies Keap-1 at redox-sensitive SH groups, leading to the liberation and nuclear translocation of Nrf2. Subsequently, Nrf2 binds to the ARE promoter sequence of antioxidant enzymes. In this way, Nrf2 coordinates cytoplasmic responses to oxidative stress [43]. A previous study reported that es-sential oils increased the mRNA expression of jejunal
GPx1 and SOD1, ileal GST, and colonic GPX1, SOD1, and Keap-1 [44]. Similarly, the present results indicated that PEO supplementation upregulated the expression of
GST,GPX,CAT, andSOD1 in the spleen and the expres-sion of GSTand Nrf2 in the liver. It can be speculated that the different terpene compounds in PEO can modify Keap 1 at sensor –SH groups through chemical reactions [45]. Oxidative stress modifies Keap1 at redox-sensitive -SH groups, which leads to Nrf2 liber-ation and its nuclear translocliber-ation. Subsequently, Nrf2 Table 8The levels of the gene expression of antioxidant enzymes in spleen, liver and pancreas of weaned pigs fed diets with different levels of PEOa
Itemsb CON PEO50 PEO100 PEO200 P
Linear Quadratic
Spleen
GR 1.00 ± 0.18 0.79 ± 0.11 0.81 ± 0.04 1.12 ± 0.16 0.746 0.250
GST 1.00 ± 0.20 1.11 ± 0.25 1.12 ± 0.43 2.92 ± 0.42 0.012 0.007
GPX1 1.00 ± 0.21 0.81 ± 0.07 0.75 ± 0.07 1.42 ± 0.14 0.236 0.029
CAT 1.00 ± 0.15 0.63 ± 0.22 0.86 + 0.11 1.23 ± 0.07 0.366 0.051
SOD1 1.00 ± 0.18 0.76 ± 0.08 0.80 ± 0.08 1.31 ± 0.08 0.287 0.029
Nrf2 1.00 ± 0.21 0.94 ± 0.11 0.94 ± 0.07 1.13 ± 0.12 0.565 0.600
Keap1 1.00 ± 0.13 1.00 ± 0.07 1.04 ± 0.14 1.31 ± 0.07 0.085 0.129
Liver
GR 1.00 ± 0.10 1.08 ± 0.27 1.18 ± 0.23 0.90 ± 0.15 0.867 0.602
GST 1.00 ± 0.22 0.71 ± 0.03 0.75 ± 0.18 1.16 ± 0.37 0.314 0.049
GPX1 1.00 ± 0.35 0.76 ± 0.30 0.94 ± 0.36 1.50 ± 0.43 0.421 0.456
CAT 1.00 ± 0.10 0.84 ± 0.19 0.81 ± 0.05 1.28 ± 0.14 0.373 0.114
SOD1 1.00 ± 0.13 1.16 ± 0.33 1.01 ± 0.15 1.08 ± 0.09 0.865 0.956
Nrf2 1.00 ± 0.07 1.07 ± 0.22 0.75 ± 0.27 0.16 ± 0.02 0.023 0.029
Keap1 1.00 ± 0.14 0.86 ± 0.17 0.93 ± 0.11 0.80 ± 0.11 0.354 0.658
Pancreas
GR 1.00 ± 0.07 1.09 ± 0.22 1.15 ± 0.11 1.43 ± 0.39 0.342 0.628
GST 1.00 ± 0.31 0.94 ± 0.23 0.93 ± 0.24 1.06 ± 0.23 0.935 0.957
GPX1 1.00 ± 0.25 0.88 ± 0.04 1.34 ± 0.22 1.19 ± 0.27 0.402 0.714
CAT 1.00 ± 0.19 1.11 ± 0.23 1.07 ± 0.18 0.77 ± 0.13 0.502 0.569
SOD1 1.00 ± 0.10 0.66 ± 0.09 0.85 ± 0.16 1.03 ± 0.13 0.842 0.316
Nrf2 1.00 ± 0.12 0.91 ± 0.16 0.96 ± 0.14 0.95 ± 0.19 0.858 0.975
Keap1 1.00 ± 0.21 0.96 ± 0.08 1.24 ± 0.18 1.23 ± 0.16 0.326 0.629
Treatments: CON means basal diet; PEO50 means basal diet with 50 ppm PEO; PEO100 means basal diet with 100 ppm PEO; PEO200 means basal diet with 200 ppm PEO a
Values are means ± S.E, n = 6 b
binds to the ARE promoter sequence of antioxidant en-zymes. In this way, Nrf2 coordinates cytoplasmic re-sponses to oxidative stress [43]. The changes in the expression of genes associated with oxidation and anti-oxidant compounds may explain the findings in serum and tissue samples. The spleen is a vital part of the im-mune system and the liver is important in detoxification and metabolism in pigs [46, 47]. The improved splenic and hepatic antioxidant capacities may be reflected in the immunity and health of weaned pigs. Although the PEO used in our study has been confirmed to improve the antioxidant capacities of serum and other tissues, the molecular mechanisms through which PEO impacts the upstream Nrf2 pathways and then modulates anti-oxidant capacity remains to be further investigated.
Conclusions
In conclusion, our results suggest that dietary PEO sup-plementation improved growth performance, immune function, and antioxidant status in weaned pigs. The benefits observed may be mediated by upregulation of antioxidant-related genes in the spleen and liver. And that supplementation of the PEO preparation at the levels of 200 mg/kg diet would seem to be economically feasible. This study not only provides new insights into the role of PEO in improving growth performance, im-mune function, and antioxidant capacity in weaned pigs, but also reveals a potential candidate to replace the anti-biotics conventionally used in the livestock industry.
Abbreviations
ALB:Albumin; CAT: Catalase; GPX1: Glutathione peroxidase 1; GR: Glutathione reductase; GSH: Glutathione; GST: Glutathione transferase; Keap-1: Kelch-like ECH-associated protein 1; MDA: Methane dicarboxylic aldehyde; Nrf2: Nuclear factor E2-related factor 2; PEO: Plant essential oil;SOD1: Superoxide dismutase 1; T-AOC: Total antioxidant capacity; TP: Total protein; T-SOD: Total superoxide dismutase
Funding
This work was supported by the Special Fund for Agro-scientific Research in the Public Interest (201403047) and the Fok Ying Tung Education Foundation (141027).
Availability of data and materials
The dataset supporting the conclusions of this article is included within the article.
Authors’contributions
JH, DC, GC and YL were involved in the study design; XZ participated in data analysis, interpretation, XZ and YW performed the animal management; GS drafted the manuscript. All authors read and approved the final manuscript.
Ethics approval
The animal experiment followed the actual law of animal protection and was approved by the Animal Care and Use Committee of the Sichuan Agricultural University and was performed in accordance with the National Research Council’s Guide for the Care and Use of Laboratory Animals.
Competing interests
The authors declare that they have no competing interests.
Publisher’s Note
Springer Nature remains neutral with regard to jurisdictional claims in published maps and institutional affiliations.
Author details
1Institute of Animal Nutrition, Sichuan Agricultural University, Chengdu,
Sichuan 611130, People’s Republic of China.2Cheng Du Hua Luo Bio-Tech
Col., Ltd, Chengdu, Sichuan 610062, People’s Republic of China.
Received: 29 January 2018 Accepted: 23 May 2018
References
1. Zhu LH, Zhao KL, Chen XL, Xu JX. Impact of weaning and an antioxidant blend on intestinal barrier function and antioxidant status in pigs. J Anim Sci. 2012;90:2581.
2. Lallès JP, Boudry G, Favier C, NL F'H, Huêrou-Luron IL, Montagne L, Oswald IP, Pié S, Piel C, Sève B. Gut function and dysfunction in young pigs: physiology. Anim Res. 2004;53:301–16.
3. Pluske JR, Hampson DJ, Williams IH. Factors influencing the structure and function of the small intestine in the weaned pig: a review. Livest Prod Sci. 1997;51:215–36.
4. Wan J, Jiang F, Xu Q, Chen D, Yu B, Huang Z, He J. New insights into the role of chitosan oligosaccharide in enhancing growth performance, antioxidant capacity, immunity and intestinal development of weaned pigs. RSC Adv. 2017;7(16):9669–79.
5. Williams BA, Mwa V, Tamminga S. Fermentation in the large intestine of single-stomached animals and its relationship to animal health. Nutr Res Reviews. 2001;14:207–28.
6. Smith J, Tokach M, Goodband R, Nelssen J, Richert B. Effects of the interrelationship between zinc oxide and copper sulfate on growth performance of early-weaned pigs. J Anim Sci. 1997;75:1861–6. 7. Kim WK, Patterson PH. Effects of dietary zinc supplementation on broiler
performance and nitrogen loss from manure. Poult Sci. 2004;83:34. 8. Hancock RE, Sahl HG. Antimicrobial and host-defense peptides as new
anti-infective therapeutic strategies. Nat Biotechnol. 2006;24:1551–7. 9. Walsh AM, Sweeney T, O'Shea CJ, Doyle DN, O'Doherty JV. Effect of dietary
laminarin and fucoidan on selected microbiota, intestinal morphology and immune status of the newly weaned pig. Br J Nutr. 2013;110:1630–8. 10. Smith AG, O'Doherty JV, Reilly P, Ryan MT, Bahar B, Sweeney T. The effects of
laminarin derived from Laminaria digitata on measurements of gut health: selected bacterial populations, intestinal fermentation, mucin gene expression and cytokine gene expression in the pig. Br J Nutr. 2011;105:669–77. 11. Attia YA. Nigella seed oil as an alternative to antibiotic growth promoters
for broiler chickens. Archiv Fur Geflugelkunde. 2015;79:1–12. 12. Attia YA, Bakhashwain AA, Bertu NK. Thyme oil (Thyme vulgaris L.) as a
natural growth promoter for broiler chickens reared under hot climate. Ital J Anim Sci. 2017;16:275–82.
13. Franz C, Baser KHC, Windisch AW, Figueiredo AC, Miguel MG. Essential oils and aromatic plants in animal feeding - a European perspective. A review. Flav Fragr J. 2010;25:327–40.
14. Vardarunlü G, Candan F, Sökmen A, Daferera D, Polissiou M, Sökmen M, Dönmez E, Tepe B. Antimicrobial and antioxidant activity of the essential oil and methanol extracts of Thymus pectinatus Fisch. Et Mey. Var. pectinatus (Lamiaceae). J Agric Food Chem. 2003;51:63–7.
15. Zeng Z, Xu X, Zhang Q, Li P, Zhao P, Li Q, Liu J, Piao X. Effects of essential oil supplementation of a low-energy diet on performance, intestinal morphology and microflora, immune properties and antioxidant activities in weaned pigs. Anim Sci J. 2015;86:279–85.
16. Maenner K, Vahjen W, Simon O. Studies on the effects of essential-oil-based feed additives on performance, ileal nutrient digestibility, and selected bacterial groups in the gastrointestinal tract of piglets. J Anim Sci. 2011;89:2106–12.
17. Li SY, Ru YJ, Liu M, Xu B, Péron A, Shi XG. The effect of essential oils on performance, immunity and gut microbial population in weaner pigs. Livest Sci. 2012;145:119–23.
18. Zhang HY, Piao XS, Zhang Q, Li P, Yi JQ, Liu JD, Li QY, Wang GQ. The effects of Forsythia suspensa extract and berberine on growth performance, immunity, antioxidant activities, and intestinal microbiota in broilers under high stocking density. Poult Sci. 2013;92:1981–8.
20. Zeng ZK, Li QY, Piao XS, Liu JD, Zhao PF, Xu X, Zhang S, Niu S. Forsythia suspensa extract attenuates corticosterone-induced growth inhibition, oxidative injury, and immune depression in broilers. Poult Sci. 2014;93:1774–81. 21. Lu T, Piao XL, Zhang Q, Wang D, Piao XS, Kim SW. Protective effects of
Forsythia suspensa extract against oxidative stress induced by diquat in rats. Food Chem Toxicol. 2010;48:764–70.
22. Simitzis PE, Symeon GK, Charismiadou MA, Bizelis JA, Deligeorgis SG. The effects of dietary oregano oil supplementation on pig meat characteristics. Meat Sci. 2010;84:670.
23. Janz JA, Morel PC, Wilkinson BH, Purchas RW. Preliminary investigation of the effects of low-level dietary inclusion of fragrant essential oils and oleoresins on pig performance and pork quality. Meat Sci. 2007;75:350–5. 24. Li P, Piao X, Ru Y, Han X, Xue L, Zhang H. Effects of adding essential oil to
the diet of weaned pigs on performance, nutrient utilization, immune response and intestinal health. Asian-Australas J Anim Sci. 2012;25:1617. 25. Manzanilla EG, Perez JF, Martin M, Kamel C, Baucells F, Gasa J. Effect of plant
extracts and formic acid on the intestinal equilibrium of early-weaned pigs. J Anim Sci. 2004;82:3210–8.
26. USA, National Council. Nutrient requirements of swine. Nutr Requir Swine. 2012;44(3).
27. Fang T, Liu G, Cao W, Wu X, Jia G, Zhao H, Chen X, Wu C, Wang J. Spermine: new insights into the intestinal development and serum antioxidant status of suckling piglets. RSC Adv. 2016;6:31323–35.
28. Wei M, Wu Y, Chen D, Gu Y. Changes of free radicals and digestive enzymes in saliva in cases with deficiency in spleen-yin syndrome. J Biomed Res. 2010;24:250–5.
29. Zhu C, Hu W, Wu H, Hu X. No evident dose-response relationship between cellular ROS level and its cytotoxicity–a paradoxical issue in ROS-based cancer therapy. Sci Rep. 2014;4:5029.
30. Zhang JQ, Shen M, Zhu CC, Yu FX, Liu ZQ, Ally N, Sun SC, Li K, Liu HL. 3-Nitropropionic acid induces ovarian oxidative stress and impairs follicle in mouse. PLoS One. 2014;9:e86589.
31. Livak KJ, Schmittgen TD. Analysis of relative gene expression data using real-time quantitative PCR and the 2(−Delta Delta C(T)) method. Methods. 2001;25:402–8.
32. Zhao R, Shen GX. Functional modulation of antioxidant enzymes in vascular endothelial cells by glycated LDL. Atherosclerosis. 2005;179:277–84. 33. Zhang Q, Piao XL, Piao XS, Lu T, Wang D, Kim SW. Preventive effect of
Coptis chinensis and berberine on intestinal injury in rats challenged with lipopolysaccharides. Food Chem Toxicol. 2011;49:61.
34. Placha I, Takacova J, Ryzner M, Cobanova K, Laukova A, Strompfova V, Venglovska K, Faix S. Effect of thyme essential oil and selenium on intestine integrity and antioxidant status of broilers. Br Poult Sci. 2014;55:105–14. 35. Jang IS, Ko YH, Yang HY, Ha JS, Kim JY, Kim JY, Kang SY, Yoo DH, Nam DS,
Kim DH. Influence of essential oil components on growth performance and the functional activity of the pancreas and small intestine in broiler chickens. Asian-Australas J Anim Sci. 2004;17:394–400.
36. Lee KW, Everts H, Kappert HJ, Frehner M, Losa R, Beynen AC. Effects of dietary essential oil components on growth performance, digestive enzymes and lipid metabolism in female broiler chickens. Brit Poultry Sci. 2003;44:450–7.
37. Platel K, Srinivasan K. Influence of dietary spices and their active principles on pancreatic digestive enzymes in albino rats. Food. 2000;44:42–6. 38. Platel K, Srinivasan K. Stimulatory influence of select spices on bile secretion
in rats. Nutr Res. 2000;20:1493–503.
39. Bureau FJ. Half-lives of immunoglobulins IgG, IgA and IgM in the serum of new-born pigs. Immunology. 1973;24:147.
40. Wang YZ, Xu CL, An ZH, Liu JX, Feng J. Effect of dietary bovine lactoferrin on performance and antioxidant status of piglets. Anim Feed Sci Technol. 2008;140:326–36.
41. Zhang HJ, Jiang XR, Mantovani G, Lumbreras AEV, Comi M, Alborali G, Savoini G, Dell'Orto V, Bontempo V. Modulation of plasma antioxidant activity in weaned piglets by plant polyphenols. Ital J Anim Sci. 2014;13:424–30. 42. Rossi R, Pastorelli G, Corino C. Application of KRL test to assess total
antioxidant activity in pigs: sensitivity to dietary antioxidants. Res Vet Sci. 2013;94:372.
43. Surh YJ. NF-kappa B and Nrf2 as potential chemopreventive targets of some anti-inflammatory and antioxidative phytonutrients with anti-inflammatory and antioxidative activities. Asia Pac J Clin Nutr. 2008;17(S1):269–72.
44. Mizumoto R, Kawarada Y. Effects of broccoli extract and various essential oils on intestinal and faecal microflora and on xenobiotic enzymes and the antioxidant system of piglets. Open J Anim Sci. 2012;2:78–98.
45. Hong F, Freeman ML, Liebler DC. Identification of sensor cysteines in human Keap1 modified by the cancer chemopreventive agent sulforaphane. Chem Res Toxicol. 2005;18:1917–26.
46. Eibl M. Immunological consequences of Splenectomy. Prog Pediatr Surg. 1985;18:139–45.