Open Access
Research article
KIDMAP, a web based system for gathering patients' feedback on
their doctors
Tsair-Wei Chien
†1,2, Weng-Chung Wang
†3, Sho-Be Lin
2, Ching-Yih Lin
4,
How-Ran Guo
5and Shih-Bin Su*
5,6,7Address: 1Department of Management, Chi-Mei Medical Center, Tainan, Taiwan, 2Department of Hospital and Health Care Administration,
Chia-Nan University of Pharmacy and Science, Tainan, Taiwan, 3Department of Educational Psychology, Counseling and Learning Needs, Hong Kong
Institute of Education, Hong Kong, PR China, 4Department of Internal Medicine, Chi-Mei Medical Center, Tainan, Taiwan, 5Department of
Environmental and Occupational Health, National Cheng Kung University, Tainan, Taiwan, 6Department of Biotechnology, Southern Taiwan
University, Tainan, Taiwan and 7Tainan Science Industrial Park Clinic, Chi-Mei Medical Center, Tainan, Taiwan
Email: Tsair-Wei Chien - [email protected]; Weng-Chung Wang - [email protected]; Sho-Be Lin - [email protected]; Ching-Yih Lin - [email protected]; How-Ran Guo - [email protected]; Shih-Bin Su* - [email protected]
* Corresponding author †Equal contributors
Abstract
Background: The gathering of feedback on doctors from patients after consultations is an important part of patient involvement and participation. This study first assesses the 23-item Patient Feedback Questionnaire (PFQ) designed by the Picker Institute, Europe, to determine whether these items form a single latent trait. Then, an Internet module with visual representation is developed to gather patient views about their doctors; this program then distributes the individualized results by email.
Methods: A total of 450 patients were randomly recruited from a 1300-bed-size medical center in Taiwan. The Rasch rating scale model was used to examine the data-fit. Differential item functioning (DIF) analysis was conducted to verify construct equivalence across the groups. An Internet module with visual representation was developed to provide doctors with the patient's online feedback.
Results: Twenty-one of the 23 items met the model's expectation, namely that they constitute a single construct. The test reliability was 0.94. DIF was found between ages and different kinds of disease, but not between genders and education levels. The visual approach of the KIDMAP module on the WWW seemed to be an effective approach to the assessment of patient feedback in a clinical setting.
Conclusion: The revised 21-item PFQ measures a single construct. Our work supports the hypothesis that the revised PFQ online version is both valid and reliable, and that the KIDMAP module is good at its designated task. Further research is needed to confirm data congruence for patients with chronic diseases.
Published: 17 June 2009
BMC Medical Research Methodology 2009, 9:38 doi:10.1186/1471-2288-9-38
Received: 25 October 2008 Accepted: 17 June 2009 This article is available from: http://www.biomedcentral.com/1471-2288/9/38
© 2009 Chien et al; licensee BioMed Central Ltd.
Background
The consumerist approach to health care [1] requires doc-tors to be more accountable to their patients [2-4]. Patient-centered care is widely recognized and has become a key aim of hospitals and healthcare systems in recent years. Accordingly, healthcare service assessment at a general level, namely within a hospital, or within a par-ticular kind of healthcare service, is needed and the patient feedback survey is an important component of this quality monitoring [5]. However, mechanisms for assessing patient views on performance and practice at the physician level are not as widely established as the sys-tems for gathering feedback from patients at the organiza-tion level [6]. The purpose of this study was (a) to establish a valid and reliable instrument for the measure-ment of physicians' performance, and (2) to develop an effective way to quickly gather feedback on doctors from patients after a consultation.
Increasing importance of patient evaluation of physician performance
Physicians play a key role in the overall quality of patient care. Feedback after consultations helps identify strengths and weaknesses at the level of the doctor's practice, and directs them to areas where improvement is required [7]. Many hospital initiatives use questionnaires to assess sat-isfaction with doctors' performance as part of routine management [8]. These questionnaires draw attention to issues such as the doctor's communication skills in order to improve the quality of medical practice effectively [9,10]. The assessment of individual doctor performance has thus gained increasing prominence worldwide [11].
Web- KIDMAP to gather feedback efficiently from patients
Two new modes of administration, using automated tech-nology to complete questionnaires over telephone through interactive voice response (IVR) and using the Internet-like visualization to complete questionnaires on-line, make surveys more easily accessible to those who do not read or write [12]. Rodriguez et al. [13] and Leece et al. [14] observed that a Web survey produces an approxi-mately equal response rate to a mail survey. Ritter et al. [12] also observed that not only is Web survey participa-tion at least as good as mail survey participaparticipa-tion, but Internet questionnaires require less follow-up to achieve a slightly, but non-significantly higher completion rate than mailed questionnaires [15].
Web surveys have the advantage that respondents can remain anonymous [16]. In addition, patients benefit from the Internet as it is being used [17]. They can acquire additional information, advice and social support from the Internet. Furthermore, Internet information can be directly stored in a database and is immediately accessible for analysis. Undoubtedly, web-based feedback will begin
to prevail in the era of the Internet [18]. A simpler, faster and cheaper way of gathering feedback from patients is thus encouraged by caregivers.
In the past, however, most patient questionnaires are gen-erally of a paper-and-pencil format. Questionnaires are usually distributed using either a consecutive sample or a random sample and the respondents usually return ques-tionnaires either in person or by mail. These traditional methods do not allow for simultaneous data processing and analysis.
Furthermore, most data analysis of patient questionnaires is based on the classic test theory (CTT). In recent years, the CTT has been gradually replaced by the item response theory (IRT) [19,20]. This study shows how to apply IRT to fit questionnaire data from patients and develops a web version of KIDMAP [21,22] to help doctors easily and quickly summarize individual patient satisfaction levels and identity aberrant responses.
Reasons for the use of the IRT 1-parameter Rasch model for KIDMAP
IRT was developed to describe the relationship between a respondent's latent trait (namely performance by the serv-ice provider or satisfaction with the servserv-ice provider in this study) and the response to a particular item. A variety of models have been proposed, including the 1-, 2- and 3-parameter logistic models, of which the 1-3-parameter model is also referred to as the Rasch model. All three models assume a single underlying continuous unbounded variable designated as ability for the respond-ents, but which varies in the characteristics they ascribe to items. All three models have an item difficulty parameter, which is the point of inflection on the latent trait scale.
The Rasch model has some advantages over the 2- and 3-parameter models [19-22]. The Rasch model lends itself to a total summed score as a sufficient statistic for ability estimation, and the summed score of respondents to an item as a sufficient statistic for difficulty estimation. Thus, the model fits nicely with total summed scoring. In addi-tion, respondents with the same raw score will always have the same estimated latent trait level, which is not the case with the 2- and 3-parameter models. Accordingly, the Rasch model was applied to fit the dataset collected in this study, and used to develop the Web-KIDMAP [23,24].
The Patient Feedback Questionnaire
Patient Feedback Questionnaire (PFQ) was analyzed to show whether they measure a single construct and fit the Rasch model's expectation. After checking model-data fit, we developed the Web-KIDMDAP to summarize individ-ual patient results and implemented it using email.
Methods
Participants and Procedure
The study sample was recruited from outpatient visitors to a 1300-bed medical center in Taiwan. During each inter-val period in the morning, afternoon, and at night from Monday through Friday in the last week of November 2007, 30 patients who had just finished a consultation with a doctor were selected randomly. A total of 450 respondents either self-completed the questionnaire or had a face-to-face interview if they were unable to person-ally complete the questionnaire; no proxies were allowed. This study was approved and monitored by the Research and Ethical Review Board of the Chi-Mei Medical Center.
Instrument and measures
The 23-item PFQ [26] consists of five domains: interper-sonal skills (5 items), communication of information (4 items), patient engagement and enablement (7 items), overall satisfaction (3 items), and technical competence (4 items) [see Additional file 1]. Each item is assessed using a 5-point Likert scale (ranging from strongly disa-gree to strongly adisa-gree). The WINSTEPS computer program [27] was used to fit the Rasch rating scale model [28], in which all items shared the same rating scale structure [29].
Data Analysis
The analysis was composed of two parts. The model-data fit was assessed by item fit statistics and analysis of differ-ential item functioning [30,31] across the subgroups of patients. An illustration of the Web-KIDMAP showing vis-ual representations of the respondent's views about the doctor performance is also provided.
Model-data fit
There are two kinds of item fit statistics, un-weighted Out-fit and weighted InOut-fit mean square error (MNSQ), which can be used to examine whether items meet the Rasch model's requirement. The Outfit MNSQ directly squares and averages standardized residuals; while the Infit MNSQ averages standardized residuals with weights [19,21]. The MNSQ statistics are Chi-squared statistics divided by their degrees of freedom. The Outfit and Infit MNSQ statistics have an expected value of unity when the data meet the model's expectation [29]. Two major assumptions must hold to yield interval measures. For the assumption of unidimensionality, all items must measure the same latent trait, for example the doctor's perform-ance; a value of MNSQ greater than 1.4 indicates too much noise. For the assumption of conditional (local)
independence, item responses must be mutually inde-pendent and conditional on the respondent's latent trait. A value of MNSQ less than 0.6 suggests too much redun-dancy.
For rating scales a range of 0.6 to 1.4 is often recom-mended as the critical range for MNSQ statistics [21,32]. Items with an Outfit or Infit MNSQ beyond this range are regarded as having a poor fit. It has been argued that the Rasch model is superior to factor analysis in terms of con-firming factor structure [33]. When poor-fitting items are identified and removed from the test, unidimensionality is guaranteed and interval measures can be produced.
Assessment of differential item functioning (DIF)
In order to make a comparison across different groups of respondents, the test construct must remain invariant across groups. DIF analysis is a way of verifying construct equivalence over groups [31]. If construct equivalence does not hold over groups, meaning that different groups respond to individual questions differently after holding their latent trait levels constant, then the estimated meas-ures should not be compared directly over the groups. All items ought to be DIF-free or at least DIF-trivial in order to obtain comparable measures over the groups [31].
An item is deemed to display DIF if the response probabil-ities for that item cannot be fully explained by the latent trait. DIF analysis identifies items that appear to be unex-pectedly too difficult or too easy for a particular group of respondents. Four demographic characteristics were tested for DIF in this study, namely gender (two groups), education (classified into three groups: elementary, sec-ondary, and higher education), age (classified into five groups: 20–29, 30–39, 40–49, 50–59, and over 60), and the type of disease prompting consultation (classified into five categories: internal medicine, surgical medicine, obstetrics & gynecology, pediatric medicine, and others). A difference larger than 0.5 logits (equal to an odds ratio of 1.65) in the difficulty estimates between any of the groups was treated as a substantial DIF [31]. Once found, DIF items were removed from further analysis. The analy-ses stopped when all the Outfit and Infit MNSQ statistics were located within the (0.6, 1.4) critical range and no fur-ther DIF items could be identified.
Difference between DIF and item misfit
If an item is found to have a poor fit as a whole or within any group of respondents, it should be removed from the data set. This process ensures that item parameter calibra-tions obtained from each group are meaningful and com-parable. Otherwise, it would be inappropriate to compare the latent trait levels within and between groups.
KIDMAP development
KIDMAP, developed within the context of Rasch measure-ment [22], is a method of displaying academic perform-ance. Four quadrants are used: harder items not achieved (i.e., under expectation when the responded score is less than the expected value on the respective items), harder items achieved, easier items not achieved, and easier items achieved. Additionally, respondent errors that require more attention are plotted on the bottom right quadrant. A complete KIDMAP highlights a patient's satisfaction level and pinpoints the strengths and weaknesses of the evaluated doctor performance [34,35].
Results
Participants
There were 450 eligible participants of whom five received a perfect or zero total score. They were representative of a national large-size hospital outpatient population in terms of gender, education, age and disease, as shown in Table 1.
Model-data fit
All but items 22 and 23 had a fit MNSQ in the range between 0.6 and 1.4. These two items were removed. Table 2 shows that the assumption of unidimensionality held for these 21 polytomous items when assessed across the 445 patients. The two items that were removed, which were related to offering chronic and preventive services, were inappropriate to acute patients examined in the study. Difficulty values for the remaining 21 items dif-fered slightly from one another (M = 0, SD = 0.30).
Fur-thermore, the ordered natures of the category boundary threshold parameters were estimated as -3.06, -2.36, 0.44, and 4.97 under the rating scale model, indicating that no item exhibited disordering of the step difficulty and the 5-point rating scale was appropriate [36,37].
The person measures (ranging from -7.35 to 9.24) had a mean of 3.06 logits and a SD of 2.63, indicating that the items were easily satisfied for respondents with an aver-aged odds ratio of 21.33 (= e3.06) compared to the average
item difficulty with zero logit and that the items were able to group into five strata [19]. The person separation relia-bility (similar to Cronbach's α) was 0.94, indicating that these items yielded very precise estimates for the patients.
DIF assessment
DIF analysis was conducted to assess the model-data fit for item-difficulty hierarchy that was invariant across groups. Table 2 lists the maximum differences in the esti-mates of item difficulty across groups. We took a differ-ence greater than 0.5 logits as a sign of substantial DIF [31]. None of the 21 items for the gender and education groups displayed DIF, but several items displayed DIF for the age and disease groups. These results mean that people from different groups in terms of age or disease with the same latent trait level (ability/satisfaction) have a differ-ent probability of giving a certain response on some items. For example, item 6 (giving clear understandable explana-tions about diagnosis and treatment) had DIF across the age groups. Hence, it is not appropriate using the summed scores or the estimated satisfaction levels to compare age groups against each other.
KIDMAP demonstration
The KIDMAP output is very intelligible to the patient, his/ her doctor or the doctor's staff. It indicates whether the patient's response is reasonable as well as which areas the doctor need to improve and does this by referring to the
Table 1: Demographic background of the 445 patients
Characteristics Number % Characteristics Number %
Gender Education
female 239 54% elementary 303 68%
male 189 42% secondary 85 19%
none or missing 17 4% higher 46 10%
none or missing 11 3%
Age Disease
20–29 17 4% internal medicine 109 24%
30–39 28 6% surgical medicine 97 22%
40–49 121 27% O & G* 41 9%
50–59 243 55% pediatric medicine 25 6%
over 60 14 3% others 129 29%
none or missing 22 5% none or missing 44 10%
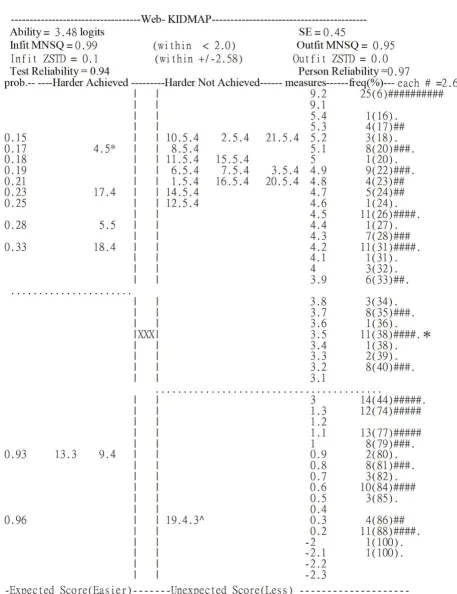
item scatter on the map. The probability of success on an item is shown on the farthest left-hand side of the map. In the center column "XXX" locates the satisfaction estimate of the patient. Percentile ranks, frequencies and the distri-bution of the norm-reference from the 445 patients are shown on the right-hand side, but some are omitted for space-saving reasons. Item difficulties and person meas-ures are depicted on an interval continuum scale on the right-hand side. A fit MNSQ larger than 2.0 indicates that the segments of the data may not support useful measure-ment and that there is more unexplained noise than explained noise. In other words, there is more misinfor-mation than informisinfor-mation in the observation [36].
Figures 1 and figure 2 present two KIDMAPs, which were generated from the responses of two patients on the web-site right after the completion of their consultation with a doctor. Patient 1 (Figure 1) had an Infit and Outfit MNSQ of 2.35 and 2.37, respectively, suggesting the response pattern was too aberrant to reveal useful information. For example, there were many items located in the 2nd quad-rant (hard items that were unexpectedly achieved) and the
4th quadrant (easy items that were unexpectedly not
achieved). Patient 2 (Figure 2) had an Infit and Outfit MNSQ of 0.99 and 0.95, respectively, indicating the response pattern was reliable. Most items were located in the 1st quadrant (hard items were not achieved) and the
3rd quadrant (easy items were achieved).
Discussions
Findings
After removing the two miss-fitting items, the remaining 21-item PFQ met the Rasch model's requirements. The test reliability was 0.94. No DIF was found in relation to gender and education; however, there was DIF in relation to both age and disease. The Web-KIDMAP is an effective approach to collecting patient opinions and providing vis-ual and useful feedback information to doctors. Although the use of Internet surveys of patients requires less follow-up in order to achieve the same completion rate as a mailed survey [14], most Internet surveys fail to render instant feedback for doctors. The Web-KIDMAP devel-oped in this study is able to release visual summary imme-diately after the completion of the consultation with his/ Table 2: Difficulty, SE, DIF and fit statistics for the 21-item Patient Feedback Questionnaire
Difficulty SE Classified groups for DIF MNSQ
Logits Logits Gender Education Age Disease Outfit Infit
Interpersonal skills
2 0.27 0.10 0.05 0.08 0.36 0.63* 1.05 1.05
4 0.17 0.11 0.00 0.04 0.50 0.35 0.82 0.80
3 -0.01 0.10 0.06 0.01 1.46* 0.38 1.11 1.09
1 -0.11 0.10 0.06 0.08 0.95* 0.34 0.98 1.01
5 -0.52 0.10 0.04 0.08 0.70* 0.34 0.85 0.85
Communication of information
9 0.51 0.10 0.10 0.08 0.73* 0.14 0.81 0.84
8 0.22 0.10 0.08 0.13 1.09* 0.44 0.90 0.86
6 0.01 0.10 0.13 0.05 0.60* 0.15 0.95 0.90
7 0.00 0.10 0.08 0.06 0.33 0.36 0.88 0.84
Patient engagement and enablement
9 0.52 0.10 0.06 0.03 0.76* 0.50 1.24 1.24
6 0.3 0.10 0.06 0.09 0.74* 0.75* 0.83 0.80
7 0.1 0.10 0.04 0.04 0.57* 0.34 1.05 1.10
15 0.03 0.10 0.04 0.17 1.25* 0.65* 1.18 1.11
16 -0.13 0.10 0.24 0.09 0.54* 0.31 0.76 0.69
14 -0.21 0.10 0.23 0.19 1.07* 0.77* 1.30 1.22
8 -0.3 0.10 0.00 0.12 0.36 0.19 1.00 0.89
Overall satisfaction
19 -0.06 0.10 0.11 0.10 0.47 0.24 1.22 1.10
17 -0.26 0.10 0.14 0.02 0.80* 0.33 1.04 1.10
18 -0.69 0.11 0.09 0.05 0.37 0.59* 0.83 0.76
Technical competence
21 0.27 0.10 0.08 0.08 0.84* 0.59* 1.14 1.12
20 -0.13 0.10 0.03 0.05 0.21 0.85* 1.02 0.95
MEAN 0.00 0.10 0.08 0.08 0.70 0.44 1.00 0.97
S.D. 0.30 0.00 0.06 0.05 0.33 0.21 0.16 0.15
KIDMAP for patient 1 showing an inadequate fit to the model
Figure 1
KIDMAP for patient 2 showing a good fit to the model
Figure 2
her doctor. Furthermore, the fit MNSQ in the Web-KID-MAP allows the user to assess the reliability of the response pattern. A fit MNSQ greater than 2 suggests too much unexplained noise for the survey to be useful [36]. Note that all of the benefits ascribed to the Web-KIDMAP visual representation are subject to the fact that the Rasch model's requirement holds.
Unfortunately, the traditional non-Web KIDMAP is avail-able only from the computer programs Quest [38] and ConstructMap [39], which were developed mainly for researchers and professionals. Given the popularity and familiarity of the Internet for non-academics, there is a great need for a Web-based KIDMAP generator. In this study we invented a computer program that ran on the Internet and yielded a Web-KIDMAP. Details of the esti-mation methods for item difficulties, person abilities and fit statistics in KIDMAP can be found in Linacre & Wright [40], Wright & Masters [19] and Chien & Wang et al. [41].
Strengths of the study
The Picker Institute Europe recently reviewed a selection of ten questionnaires and identified 23 items that can be clas-sified into five domains [26]. The PFQ has been assessed using methods derived from CTT. However, there are many shortcomings in CTT, including the mutual dependence of
item measure and person measure, ordinal raw score rather than interval data, and difficulty in handling missing data. In this study, we applied the Rasch model to analyzing the Patient Feedback Questionnaire. With the use of Rasch analysis, we were able to detect aberrant responses and DIF, and to produce linear measures. In addition, KIDMAP, which is available with Rasch analysis, allows a doctor to self-rate his/her expected performance across items and then compare it with the average scores of each item responded by all patients; this allows them to attain an "always comparing, always improving quality of service" at the physician level through the three steps of feedback process shown in Figure 3.
Another issue worthy of mention is the appropriateness of the scaling level in the PFQ. All category boundary parameters of the PFQ items are ordered, as in the sequence, -3.06, -2.36, 0.44 and 4.97, under the rating scale model, which share the same threshold difficulties. These thresh-old difficulties are congruent with the guidelines for the rating scales [42] in which calibrations increase monoton-ically with category number [37,43]. This means that the questionnaire assessing the doctors' performance from the patient viewpoint is appropriate to a 5-point rating scale.
Limitations of the study
High quality patient feedback is important; clearly further work is still needed to improve the administration of an effective patient feedback tool for a clinical setting. In this study, we explore the questionnaire as a tool to collect an individual's perception using a visual representation like KIDMAP [35]. However, users may need some training in order to interpret a KIDMAP correctly.
There are a number of questionnaires that survey a patient's views of their doctor. Patient-doctor interaction, which may reflect the quality of care delivery at the organ-izational level, is a key component in these question-naires. However, in this study we merely focus on the process of patient feedback at the physician level.
Applications
In this study we transplanted the estimates from the WIN-STEPS software into the Web-KIDMAP module http:// www.webcitation.org/5VWkRosJn and used this to create a 3-step assessment of doctor performance. First, a doctor
Table 3: Summary statistics for Patients 1 and 2
No. Actual Score Maximum Score logits SE Infit MNSQ Outfit MNSQ Infit t Outfit t
1 66 105 -0.48 0.36 2.35 2.37 2.94 2.99
2 87 105 3.48 0.45 0.99 0.95 0.10 0.00
Steps in the feedback process
Figure 3
completes the self-assessment survey and stores each item response in a database. Second, each patient is invited to fill out the online survey and our system then sends the KIDMAP to their doctor. Finally, the doctor or their staff receives the feedback email that describes Outfit MNSQ and this links with the visual KIDMAP of each patient as well as the grouped results of the whole sample.
Patient 2 (Figure 2) had a very good fit, whereas patient 1 (Figure 1) had a poor fit. The segments for those two patients in the Figures are outlined in Table 3, which shows the various fit statistics, raw scores and measures. In this study, patients with both Infit and Outfit t beyond ± 2.58 (p < .01) and with a MNSQ greater than 2.0[36] were deemed to be possibly careless, mistaken, awkward when using the system or deceptive when responding to the questionnaire.
The MNSQ value is high for Patient 1, but not for patient 2, which is explained by the large number of unexpected (Z-score beyond ± 1.96) response items in the 2nd and 4th
quadrants (11 and 5 items in Figures 1 and 2, respec-tively). This is obvious from even a quick glance at the unexpected response items above or beneath the dotted line and far from the "XXX" sign in the center column of the KIDMAP. The dotted lines indicate the upper and lower boundaries (ability estimate minus one standard error) of the patient's satisfaction level with a 50% proba-bility of success. Readers may be both surprised and delighted that the MNSQ value can alert those considering a case on quantitative grounds are able to easily differen-tiate a meaningless (e.g., Figure 1) or a meaningful (e.g., Figure 2) feedback using the KIDMAP, before examining specific items for significance using a Z-score from the patient point of view.
Further studies and suggestions
Two items that pertained to chronic and preventive serv-ices were removed from the PFQ data because they did not meet the Rasch model's expectations and were thus inap-propriate for the acute patients used in this study. Further consideration should be given to investigate whether these two items are appropriate for other groups of pat-ents.
Patient questionnaires need to be more attuned to patient-centered healthcare. Rasch analysis should be applied to questionnaires in order to assess their psycho-metric properties and this should improve the administra-tion and interpretaadministra-tion of patient feedback surveys in a clinical setting.
The revised 21-item PFQ was able to discriminate five strata. Furthermore, the person separation reliability was 0.94. In this context, the latter is positively related to the
strata by [= (4 × seperation_index + 1) ÷ 3] [19,37], in which the separation index assesses the degree to which the questionnaire is able to discriminate between individ-uals. A high discrimination indicates a good quality of measurement [44]. It is clear that researchers are able to present test reliability and person conditional reliability using KIDMAP as seen in Figure 2. In addition, in this con-text, they will also able to use the Rasch separation index when evaluating and designing new questionnaires
Conclusion
The developed Web-KIDMAP can be used as an easy, fast and simple way to help patients email feedback on their doctors' performance. Our work supports the hypotheses that the psychometric properties of the revised PFQ online version are valid and reliable, and that the KIDMAP mod-ule is worthy of its task.
List of abbreviations
DIF: differential item functioning; MNSQ: mean square error; IRT: item response; theory; CTT: classic test theory; IVR: interactive voice response
Competing interests
The authors declare that they have no competing interests.
Authors' contributions
TW and SB provided concept/ideas/research design, writ-ing, data analysis, facilities/equipment and fund procure-ment. SB and CY collected data from survey and provided institutional liaisons and project management. WW and HR provided consultation (including English revision and review of the manuscript before submission). All authors read and approved the final manuscript.
Additional material
Acknowledgements
We are grateful to the Picker Institute Inc. for its permission to use their questionnaire in this study. This study was supported by Grant
CMFHR9624 from Chi-Mei Medical Center, Taiwan.
References
1. Davies A, Ware J: Involving consumers in quality of care assess-ment. Health Affairs 1988, 7:33-48.
2. Levine A: Medical professionalism in the new millenium: A physician char-ter 2002, 136:243-226.
3. Epstein R, Hundert E: Defining and assessing professional com-petence. Journal of the American Medical Association 2002,
287:226-235.
Additional file 1
The 23-item Patient Feedback Questionnaire and its five domains.
Click here for file
Publish with BioMed Central and every scientist can read your work free of charge "BioMed Central will be the most significant development for disseminating the results of biomedical researc h in our lifetime."
Sir Paul Nurse, Cancer Research UK
Your research papers will be:
available free of charge to the entire biomedical community
peer reviewed and published immediately upon acceptance
cited in PubMed and archived on PubMed Central
yours — you keep the copyright
Submit your manuscript here:
http://www.biomedcentral.com/info/publishing_adv.asp
BioMedcentral
4. Maudsley R, Wilson D, Neufield V, Hennen B, DeVillaer M, Wakefield J: Educating future physicians for Ontario: phase II. Academic Medicine 2000, 75:113-126.
5. Cleary PD: The increasing importance of patient surveys. Brit-ish Medical Journal 1999, 319(7212):720-721.
6. Coulter A: What do patients and the public want from pri-mary care? BMJ 2005, 331:1199-1201.
7. Delbanco T: Enriching the doctor-patient relationship by invit-ing the patient's perspective. Annals of Internal Medicine 1992,
116:414-418.
8. Greco M, Brownlea A, McGovern J: Impact of patient feedback on the interpersonal skills of GP Registrars: results of a lon-gitudinal study. Medical education 2001, 36:336-376.
9. Hall W, Violato C, Lewkonia R, Lockyer J, Fidler H, Toews J, Jennett P, Donoff M, Moores D: Assessment of physician performance in Alberta: the Physician Achievement Review. Canadian Med-ical Association Journal 1999, 161:52-57.
10. Hearnshaw H, Baker R, Cooper A, Eccles M, Soper J: The costs and benefits of asking patients their opinions about general prac-tice. Family Practice 1996, 13:52-58.
11. Violato C, Lockyer J, Fidler H: Multisource feedback: a method of assessing surgical practice. British Medical Journal 2003,
326:546-548.
12. Ritter P, Lorig K, Laurent D, Matthews K: Internet versus mailed questionnaires: a randomized comparison. J Med Internet Res
2004, 6(3):e29.
13. Rodriguez H, von Glahn T, Rogers W, Chang H, Fanjiang G, Safran D:
Evaluating patients' experiences with individual physicians: A randomized trial of mail, internet, and interactive voice response telephone administration of surveys. Medical Care
2006, 44(2):167-174.
14. Leece P, Bhandari M, Sprague S, Swiontkowski MF, Schemitsch EH, Tornetta P, et al.: Internet versus mailed questionnaires: a ran-domized comparison (2). J Med Internet Res 2004, 6(3):e30. 15. Schonlau M: Will Web surveys ever become part of
main-stream research? J Med Internet Res 2004, 6(3):e31.
16. Eysenbach G, Wyatt J: Using the internet for surveys and health research. J Med Internet Res 2002, 4(2):e13.
17. Potts HWW, Wyatt JC: Survey of doctors' experience of patients using the Internet. J Med Internet Res 2002, 4(1):e5. 18. O'Toole J, Sinclair M, Leder M: Maximising response rates in
household telephone surveys. BMC Med Res Methodol 2008, 8:71. 19. Wright BD, Masters GN: Rating Scale Analysis Chicago, Ill: MESA Press;
1982.
20. Wright BD, Mok M: Understanding Rasch Measurement: Rasch Models Overview. J Appl Meas 2000, 1:83-106.
21. Bond TG, Fox CM: Applying the Rasch model: Fundamental measurement in the human sciences Mahwah, NJ: Erlbaum; 2001:179.
22. Wright BD: Rasch vs. Birnbaum. Rasch Measurement Transactions 1992,
5(4):178.
23. Wright BD, Mead RJ, Ludlow LH: KIDMAP: Person-by-item interaction mapping. Research Memorandum No. 29 MESA Psychometric Labora-tory, Department of Education, University of Chicago; 1980. 24. Rasch G: Probabilistic Models for Some Intelligent and Attainment Tests
Copenhagen, Denmark: Institute of Educational Research; 1960. 25. Picker (Picker Institute Europe): What do you think of your doctor?
[http://www.pickereurope.org/]. [accessed 2008 Jan. 25]
26. Chisholm A, Askham J: What do you think of your doctor?
Oxford: Picker Institute Europe; 2006.
27. Linacre JM: WINSTEPS [computer program], Chicago, IL 2008 [http:// www.WINSTEPS.com].
28. Andrich D: A rating scale formulation for ordered response categories. Psychometrika 1978, 43:561-573.
29. Smith AB, Rush R, Fallowfield LJ, Velikova G, Sharpe M: Rasch fit sta-tistics and sample size considerations for polytomous data.
BMC Med Res Methodol 2008, 8:33.
30. Embretson SE, Reise SP: Item Response Theory for Psychologists
Mahwah, NJ: Lawrence Erlbaum Associates, Inc.; 2000.
31. Holland PW, Wainer H: Differential Item Functioning Hillsdale, NJ: Erl-baum; 1993.
32. Wright BD, Linacre JM, Gustafson J-E, Martin-Lof P: Reasonable mean-square fit values. Rasch Meas Trans 1994, 8:370.
33. Waugh RF, Chapman ES: An analysis of dimensionality using fac-tor analysis (true-score theory) and Rasch measurement: What is the difference? Which method is better? J Appl Meas
2005, 6:80-99.
34. Doig B: Rasch Down down. Rasch Meas Trans 1990, 4(1):96-100. 35. Masters GN: KIDMAP – a history. Rasch Meas Trans 1994, 8(2):366. 36. Linacre JM: Optimizing rating scale category effectiveness. J
Appl Meas 2002, 3(1):85-106.
37. Chien T-W, Hsu S-Y, Tai C, Guo H-R, Su S-Bin: Using Rasch Anal-ysis to Validate the Revised PSQI to Assess Sleep Disorders in Taiwan's Hi-tech Workers. Community Mental Health Journal
2008, 44:417-425.
38. Adams RJ, Khoo ST: QUEST (Version 2.1): The interactive test analysis system. Rasch Meas Trans 1998, 11(4):598.
39. Wilson M, Kennedy C, Draney K: ConstructMap (Version 4.0) [compu-ter program], Berkeley: CA 2008.
40. Linacre JM, Wright BD: A user's guide to WINSTEPS Chicago: MESA Press; 1998.
41. Chien T-W, Wang W-C, Chen N-S, Lin H-J: Improving Hospital Indicator Management with the Web-KIDMAP Module: THIS as an Example. Journal of Taiwan Association for Medical Infor-matic 2006, 15(4):15-26.
42. Smith EV Jr, Wakeky MB, de Kruif REL, Swartz CW: Optimizing Rating Scales for Self-Efficacy (and Other) Research. Educa-tional and Psychological Measurement 2002, 63(3):69-91.
43. Linacre JM: Comparing "Partial Credit" and "Rating Scale" Models. Rasch Meas Trans 2000, 14(3):768.
44. Hankins M: Questionnaire discrimination: (re)-introducing coefficient . BMC Med Res Methodol 2007, 7:19.
Pre-publication history
The pre-publication history for this paper can be accessed here: