R E S E A R C H
Open Access
Application of highly sensitive saturation labeling
to the analysis of differential protein expression
in infected ticks from limited samples
Margarita Villar
1*, Alessandra Torina
2, Yolanda Nuñez
3, Zorica Zivkovic
4, Anabel Marina
3, Angela Alongi
2,
Salvatore Scimeca
2, Giuseppa La Barbera
2, Santo Caracappa
2, Jesús Vázquez
3, José de la Fuente
1,5*Abstract
Background:Ticks are vectors of pathogens that affect human and animal health worldwide. Proteomics and genomics studies of infected ticks are required to understand tick-pathogen interactions and identify potential vaccine antigens to control pathogen transmission. One of the limitations for proteomics research in ticks is the amount of protein that can be obtained from these organisms. In the work reported here, individual naturally-infected and unnaturally-infectedRhipicephalusspp. ticks were processed using a method that permits simultaneous extraction of DNA, RNA and proteins. This approach allowed using DNA to determine pathogen infection, protein for proteomics studies and RNA to characterize mRNA levels for some of the differentially expressed proteins. Differential protein expression in response to natural infection with different pathogens was characterized by two-dimensional (2-D) differential in gel electrophoresis (DIGE) saturation labeling in combination with mass
spectrometry analysis. To our knowledge, this is the first report of the application of DIGE saturation labeling to study tick proteins.
Results:Questing and feedingRhipicephalusspp. adult ticks were collected in 27 farms located in different Sicilian regions. From 300 collected ticks, only 16 were found to be infected:R. sanguineuswithRickettsia conoriiand Ehrlichia canis;R. bursawithTheileria annulata; andR. turanicuswithAnaplasma ovis. The proteomic analysis conducted from a limited amount of proteins allowed the identification of host, pathogen and tick proteins differentially expressed as a consequence of infection.
Conclusion:These results showed that DIGE saturation labeling is a powerful technology for proteomics studies in small number of ticks and provided new information about the effect of pathogen infection in ticks.
Background
Ticks are ectoparasites of wild and domestic animals and humans, and are considered to be the most impor-tant arthropod vector of pathogens in some regions of the world [1]. In particular, Rhipicephalusspp. ticks transmit pathogens of the generaAnaplasma,Ehrlichia, Rickettsia, Babesia and Theileria that impact both human and animal health [1,2]. The ticks and the patho-gens that they transmit have co-evolved molecular inter-actions involving genetic traits of both the tick and the
pathogen that mediate their development and survival [3-5].
Due to complexities of working with ticks and despite great advances in proteomics technologies during the last decades, proteomics studies to characterize protein expression in ticks are difficult to conduct [5-17]. Most of these studies have focused on the sialome (salivary gland secretory proteome) analysis of ticks [6,7,9,13-15] and the analysis of host-tick-pathogen interactions in an attempt to identify potential candidates for vaccine development against vector-borne diseases [5,8,10-12,16,17].
One of the limitations for proteomics research in ticks is the amount of protein that can be obtained from these organisms. The saturation difference in gel * Correspondence: [email protected]; [email protected]
1
Instituto de Investigación en Recursos Cinegéticos IREC (CSIC-UCLM-JCCM), Ronda de Toledo s/n, 13005 Ciudad Real, Spain
Full list of author information is available at the end of the article
electrophoresis (DIGE) technology recently developed has emerged as a useful method for protein analysis from scarce amounts of protein [18,19]. Protein labeling in saturation DIGE is based on dyes that have a malei-mide reactive group that form a covalent bond with the thiol group of cysteine residues via a thioether linkage, whereas the reactive group of dyes for the minimal DIGE labeling is a NHS ester that react with the epsilon amino group of lysine residues in proteins via an amide linkage. Moreover, as its name suggests, in saturation labeling the dyes are added to the protein under such conditions that all available cysteine residues of a pro-tein are labeled, in contrast to minimal DIGE labeling technology in which only 1-3% of lysine residues are labeled [20]. This new strategy results in a strongly enhanced sensitivity when compared to minimal DIGE methodology, with a detection limit established at 0.1 ng of albumin [18]. Thereby, saturation DIGE labeling appears to be a highly suitable strategy for proteome studies using small amounts of protein samples provid-ing results from sample quantities 10-fold lower than those required to carry out the minimal labeling approach.
In the work reported herein, individual infected and uninfected Rhipicephalus spp. ticks were processed using a method that permits simultaneous extraction of DNA, RNA and protein to characterize differential pro-tein expression in response to natural infection with dif-ferent pathogens by two-dimensional DIGE saturation labeling in combination with mass spectrometry analy-sis. The results showed that DIGE saturation labeling is a powerful technology for proteomics studies in small number of ticks, even when proteins are extracted by methods that allow simultaneous analysis of DNA and RNA samples. To our knowledge, this is the first report of the application of DIGE saturation labeling to study tick proteins.
Material and methods
Ticks and DNA/RNA/protein extraction
Questing and feeding Rhipicephalus spp. adult female ticks were collected in 27 farms located in different Sici-lian regions (Palermo, Enna, Messina, Siracusa and Tra-pani). A total of 300 ticks were collected and analyzed for this study. Of them, 12 were questing ticks and 288 were fully engorged ticks collected from sheep, goats or dogs. These ticks were collected from adult animals liv-ing in pathogen endemic areas, thus likely to have chronic infections. Ticks were identified using morpho-logical keys for the Italian Ixodidae [21]. The ticks were incubated for three days in the laboratory prior to dis-section and RNA/DNA/protein extraction. Individual ticks were dissected and whole internal organs extracted and used for DNA, RNA and protein extraction using
TriReagent (Sigma, St. Louis, MO, USA) following man-ufacturers recommendations. Animal experiments were conducted with the approval and supervision of the Inti-tuto Zooprofilattico Sperimentale della Sicilia Institu-tional Animal Care and Use Committee (project IZS SI 10-06).
Identification of pathogen infection in naturally infected ticks
The DNA was resuspended in sterile distilled water and stored at -20°C until used. For the initial screening, PCR analyses for Anaplasma,Ehrlichia and Rickettsiaspp. were performed as described previously [22] with 1 μl (0.1-10 ng) DNA using 10 pmol of each primer and the Ready-To-Go PCR beads (Amersham, Piscataway, NJ, USA). Reactions were performed in an automated DNA thermal cycler for 35 cycles. PCR products were electro-phoresed on 1% agarose gels to check the size of ampli-fied fragments by comparison to a DNA molecular weight marker (1 Kb DNA Ladder, Promega, Madison, WI, USA). Control reactions were done without the addition of DNA to the reaction to rule out contamina-tions during PCR. Reverse line blot (RLB) was used for detection ofBabesiaandTheileriaspp. as described pre-viously [23].
To confirm pathogens in ticks, PCR and sequence analysis of cloned amplicons were performed for Ana-plasma, Ehrlichia and Rickettsia spp. Amplified frag-ments were resin purified (Promega), cloned into pGEM-T vector (Promega) and sequenced in an accre-dited service laboratory (BaseClear, Leiden, The Nether-lands) using vector specific primers. The BLAST tool was used to search the NCBI databases in order to iden-tify sequences reported previously with identity to sequences obtained herein. Gene sequences were depos-ited in the GenBank with accession numbers GQ857075-GQ857078. RLB was used to confirm T. annulatainfection.
Two-Dimensional Difference in Gel Electrophoresis (2-D DIGE)
Following protein extraction with TriReagent (Sigma), protein samples were purified using a 2-D Clean-Up Kit (GE Healthcare, Madrid, Spain) according to the manu-facturer’s instructions to remove any contaminant sub-stances that could interfere with the 2-D DIGE procedure. The protein pellet was resuspended in 25μl of 2-D lysis buffer (7 M urea, 2 M thiourea, 4% w/v CHAPS, 25 mM Tris-HCl, pH 8.0) and protein concen-tration was determined using the 2D-Quant Kit (GE Healthcare).
experimental group were pooled. Consequently, a total of 8 different samples were analyzed by 2D-DIGE, four infected with R. conorii,E. canis,T. annulataor A. ovis and their respective uninfected controls of the same tick species and collected from the same type of host or off-host.
CyDye DIGE fluor labeling kit for scarce protein sam-ples (GE Healthcare) was used to label tick proteins according to the manufacturer’s protocol. Briefly, for cysteine reduction before labeling, 5 μg of protein of each sample were incubated with 2 nmol Tris (2carbox-yethyl) phosphine hydrochloride (TCEP; Sigma) at 37°C for 1 hour in the dark and, for labeling, 4 nmol of Cy5 dye in 2μl of anhydrous DMF (Sigma) were added and the samples were incubated at 37°C for 30 min in the dark. For internal standardization, a pool of equal amounts of all samples (5μg per sample) was created and labeled with Cy3 dye with the same procedure but scaling adjusting the quantities of reagents according to the amount of protein (40 μg). The reaction was quenched by adding and equal volume of 2 × sample buffer (7 M urea, 2 M thiourea, 4% w/v CHAPS, 1% v/v IPG buffer pH 3-11, 0.2% w/v DTT). Before 2-D separa-tion, 5 μg of the Cy3-pool was mixed with 5μg of each sample.
For the first dimension, 24-cm 3-11 NL pH range IPG strips were rehydrated overnight in 450μL of DeStreak Rehydration Solution (GE Healthcare) supplemented with 0.5% IPG buffer pH 3-11 (GE Healthcare) using a reswelling tray. IEF was performed at 20°C using an Ettan IPGphor 3 (GE Healthcare). Samples were applied using anodic cup loading and the isoeletrofocusing was carried out using the following conditions: 300 V for 3 h, 300-1000 V for 6 h, 1000-10000 V for 3 h, 10000 V for 3 h and 500 V for 3 h. Prior to second dimension, focused IPG strips were incubated for 10 min equilibra-tion buffer containing 50 mM Tris-HCl pH 8.8, 6 M urea, 30% v/v glycerol, 2% w/v SDS, 0.5% w/v DTT and traces of bromophenol blue. Equilibrated IPG strips were placed onto 12% homogeneous SDS-polyacryla-mide gels casted in low fluorescence glass plates using an Ettan-DALT Six System (GE Healthcare). Electro-phoresis was carried out at 20°C and 0.5 W/gel for 30 min followed by a second step at 15 W/gel for 4 hours.
Image acquisition and data analysis
Proteins were visualized using an Ettan DIGE Imager (GE Healthcare) following the manufacturer’s instruc-tions. Image analysis was performed with DeCyder 2 D Software, version 7.0 (GE Healthcare). Sixteen images were considered for the analysis, 8 corresponded to the different samples labeled with Cy5 and 8 corresponded to sample pool labeled with Cy3 and acquired individu-ally with each gel. Spot co-detection, normalization of
each spot against the corresponding value of the internal pool and volume ratios calculation were carried out using Differential In-Gel Analysis (DIA) module. In the Biological Variation Analysis (BVA) module, the 16 spot maps were distributed in 9 groups, that is, standard, and the 8 different samples (4 controls and 4 infected) and the standard image most representative with average quality was assigned as the master image. After match-ing of images, average ratios between groups were calcu-lated. Protein spots with 5-fold as threshold in the average ratio were considered as differentially expressed between the samples under comparison.
Selection and preparation of protein samples for mass spectrometry
For preparative gels, equal amounts of all samples were pooled. Due to sample limitation, only 8 μg of each sample were mixed obtaining 64μg of total proteins. 2-D electrophoresis was carried out in the same condi-tions as described above for CyDye labeled samples, but in this case, after second dimension, the gel was stained with Sypro Ruby (Molecular Probes, Invitrogen, Eugene, OR, USA) following the protocol recommended by the manufacturer. Proteins were visualized by fluorescence using an Ettan DIGE Imager (GE Healthcare) selecting 100μm as pixel size and channel Sypro Ruby 1 with 0.4 of exposure to acquire the gel image. The gel was matched automatically in the BVA module of DeCyder software with the DIGE images. Of all spots matching with this gel, only those spots that were identified as dif-ferentially expressed and appeared at least in two of the four tick-pathogen groups under comparison were selected for mass spectrometry analysis. The 2-D elec-trophoresis stained gel was washed twice for 10 min with distilled water. Selected protein spots were visua-lized with an UV benchtop transilluminator (UVP, Cam-bridge, UK), manually excised from the gels, dehydrated with acetonitrile and vacuum-dried (Savant Speed Vac, mod SPD, 121 P, equipped with a vacuum pump OFP-400). After drying, spots were re-hydrated and digested in situ with trypsin (Promega) as described by Shev-chenko et al. [24] with minor modifications. Stained protein gel spots were incubated in 50 mM NH4HCO3 with trypsin (5 ng/μl) for 1 hr in an ice-bath. The diges-tion buffer was removed and gels were covered again with 50 mM NH4HCO3 and incubated at 37°C for 12 hr. Whole supernatants were allowed to dry and then stored at 20°C until mass spectrometry analysis.
Matrix-assisted laser desorption/ionization-time of flight mass spectrometry (MALDI-TOF MS) analysis
reflector mode employing 2, 5-dihydroxybenzoic acid as matrix and an AnchorChip™surface target (Bruker Dal-tonics). Peak identification and monoisotopic peptide mass assignation were performed automatically using Flexanalysis™software, version 2.2 (Bruker Daltonics). Database searches were performed using MASCOT http://matrixscience.com[26] against the NCBI non-redundant protein sequence database http://www.ncbi. nih.gov. The selected search parameters were as follows: tolerance of two missed cleavages, carbamidomethyla-tion (Cys) and oxidacarbamidomethyla-tion (Met) as fixed and variable modifications, respectively, and setting peptide tolerance to 100 ppm after close-external calibration. A significant MASCOT probability score (p <0.05) was considered as condition for successful protein identification.
Reverse phase-liquid chromatography (RP-LC)-MS/MS analysis
When peptide mass fingerprinting failed to identify a spot, the protein digest was dried, resuspended in 7 ul of 0.1% formic acid and analyzed by RP-LC-MS/MS in a Surveyor HPLC system coupled to an ion trap Deca XP mass spectrometer (Thermo Fisher Scientific, Waltham, MA, USA). The peptides were separated by reverse phase chromatography using a 0.18 mm × 150 mm Bio-Basic C18 RP column (Thermo Fisher Scientific), oper-ating at 1.8μl/min. Peptides were eluted using a 50-min gradient from 5 to 40% solvent B (Solvent A: 0,1% for-mic acid in water, solvent B 0,1% forfor-mic acid, 80% acet-onitrile in water). ESI ionization was done using a microspray“metal needle kit”(Thermo Fisher Scientific) interface. Peptides were detected in survey scans from 400 to 1600 amu (8 μscans), followed by three data-dependent MS/MS scans, using an isolation width of 3 amu, normalized collision energy of 30%, and dynamic exclusion, applied during 3-min periods.
Peptide identification from raw data was carried out using the SEQUEST algorithm (Bioworks Browser 3.2, Thermo Fisher Scientific) and the PHENYX 2.6 search engine (GENEBIO, Switzerland). Database search was performed against the Apicomplexa, a-proteobacteria and metazoa databases downloaded from the Protein Knowledgebase (UniProtKB) http://www.uniprot.org. The following constraints were used for the searches: tryptic cleavage after Arg and Lys, up to two missed cleavage sites, and tolerances of 2 Da for precursor ions and 0.8 Da for MS/MS fragment ions and the searches were performed allowing optional Met oxidation and fixed Cys carbamidomethylation.
If the SEQUEST and PHENYX searches did not yield any positive results, high-quality spectra that had not been assigned to any protein identification were selected and manual de novo interpretation was conducted. These results were confirmed with PEAKS Studio 4.5
software (Bioinformatics Solutions Inc., Waterloo, ON, Canada).
Analysis of mRNA levels by real-time RT-PCR in naturally infected ticks
The genes encoding for differentially expressed unknown larval (Genbank accession number EF675686) and guanine nucleotide-binding (DQ066296) proteins were selected for mRNA analysis by real-time RT-PCR. mRNA levels were characterized in individual whole ticks naturally-infected with different pathogens using sequence-specific oligonucleotide primers (unknown lar-val protein, UNLP-F: 5′-TCATCCTCTGTGTGCTCGTC and UNLP-R: 5′-TCTCGAGGCAAGTGTCAATG; gua-nine nucleotide-binding protein, GNBP-F: 5′
-GGGACTTGGAGGGCAAGAG and GNBP-R: 5′
-ACACCTGCCAGACCCTGAT) as described previously [27]. In all cases, matching groups of uninfected tick samples were analyzed concurrently for comparison. Real-time RT-PCR was done using the QuantiTec SYBR Green RT-PCR kit (Qiagen, Valencia, CA, USA) and a Bio-Rad iQ5 thermal cycler (Hercules, CA, USA) follow-ing manufacturer’s recommendations. mRNA levels were normalized against tick 16 S rRNA using the com-parative Ct method [27].
Results and discussion
In this work, a 2-D DIGE saturation labeling approach in combination with MS was used to characterize differen-tial protein expression inRhipicephalusspp. ticks natu-rally infected with different pathogens. Each particular tick species infected with a pathogen was compared with its respective uninfected control of the same tick species and collected from the same host or off-host. Individual infected and uninfected control ticks were processed using a method that permits simultaneous extraction of DNA, RNA and protein. This approach allowed using DNA to determine pathogen infection, protein for pro-teomics studies and RNA to characterize mRNA levels for some of the differentially expressed proteins.
2-D DIGE analysis of tick protein profiles
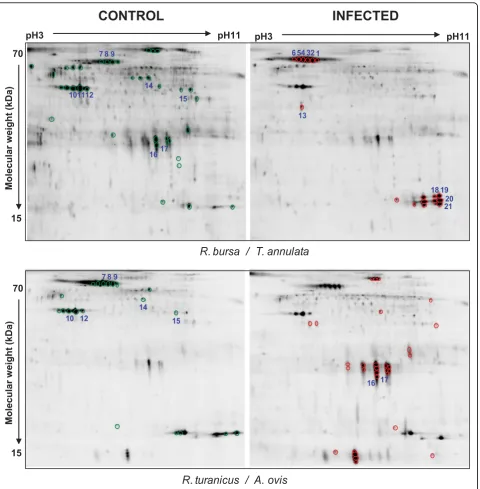
Proteins obtained from the four different groups of infectedRhipicephalus spp. ticks and their respective uninfected controls were labeled with Cy5 saturation dye while the pooled internal standard was labeled with Cy3 saturation dye. Saturation labeling technology only employs two fluorochromes and it is not possible to include control and infected samples within the same gel, as in case of minimum labeling approach. Here, each sample mixed with the pooled internal standard was run separately in a gel. Thus, as shown in figure 1, this study comprised eight 2-D gels representing each individual group of samples. Two experiments were conducted with similar results.
Evaluation of protein patterns of 16 spot maps obtained were performed with the DeCyder software. Between 1853 and 2484 spots were automatically detected, of which, an average of 1365 spots (SD = 63) were matched with the master gel. The group to group comparisons between control and infected spot maps were done and the differences obtained were considered significant when the calculated average ratio (infected vs. control samples) showed a value lower than -5 or higher than +5 (Figure 2 and 3; Table 2). Due to the limitation in protein sample quantity obtained from each tick group, it was necessary to mix samples from the same group. Pooled protein samples have the advan-tage of reducing variance from individual-to-individual variation, but it required the application of restrictive selection criteria due to the absence of statistical analy-sis. Tick proteins under-expressed after infection accounted for around 70% of differentially expressed proteins in all groups analyzed except in R. turanicus/A. oviswhere 60% of differentially expressed proteins were over-expressed in infected ticks (Table 2).
Protein identification by mass spectrometry
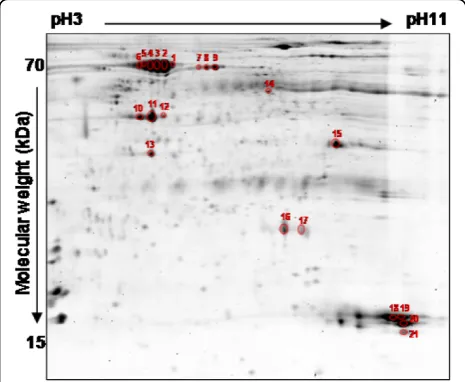
A Sypro Ruby image of the preparative gel was devel-oped for mass spectrometry analysis of differentially expressed proteins (Figure 4). After DeCyder analysis of
the preparative gel, 21 spots with an average ratio of ± 5-fold and that appeared at least in two of the four groups under comparison were selected for MS identification.
Excised spots were trypsin-digested and analyzed by MALDI-TOF MS. Fourteen proteins were identified by peptide mass fingerprinting (PMF) (Table 3). The pro-teins that could not be identified by PMF were analyzed by LC-MS/MS and 6 new spots were identified (Table 3). Of the 21 spots analyzed, only two could not be identified by any of the MS techniques employed, prob-ably due to the limitation in the quantity of sample used.
Many of the identified spots corresponded to different isoforms to the same protein, which resulted in the identification of 9 unique proteins. Of these 9 proteins, 4 corresponded to host proteins (haptoglobin, albumin and alpha and beta hemoglobin) and the rest were assigned to tick or pathogen proteins (Table 3).
The host proteins identified are highly abundant plasma proteins. The higher levels of haptoglobin detected in all infected ticks (spot 13) could be explained by an increase in the circulating plasma levels of this stress/inflammatory acute-phase protein (APP) in the host caused by pathogen infection, a fact that has already been shown in bovine tropical theileriosis [30-32]. Albumin and alpha and beta hemoglobin levels varied between different tick species.
Increased haptoglobin, albumin and hemoglobin levels in questing R. sanguineusinfected with R. conorii sug-gested that these proteins (or protein fragments) may be stored and transmitted intrastadially in infected ticks [16]. These results suggested that infection could modify tick digestion process, thus resulting in increased con-centration of some plasma proteins ingested with blood meal in infected ticks. Additionally, proteins such hemo-globin fragments may have a role in tick immune defense mechanisms [33-36]. However, T. annulata infection could cause a reorganization of the different albumin isoforms without changes in the global quantity
Table 1 Rhipicephalus spp. ticks naturally infected with Rickettsia, Ehrlichia, Theileria or Anaplasma species
Tick species Collection Pathogen infection Na) Total proteins extracted (μg) b)
R. sanguineus questing R. conorii 3 57.9
R. sanguineus dog E. canis 2 40.1
R. bursa sheep T. annulata 9 92.2
R. turanicus sheep A. ovis 2 18.5
Questing and feedingRhipicephalusspp. adult female ticks were collected in Sicilian farms and analyzed for pathogen infection by PCR or RLB. To define pathogen species infecting ticks, PCR and sequence analysis of cloned amplicons were performed forAnaplasma,EhrlichiaandRickettsiaspp. ForTheileriaspp., RLB results were confirmed at the species level. For proteomics analysis, sex and collection-matching uninfected controls were used. Uninfected ticks were negative for all pathogens analyzed.
a)
Number of ticks comprising the sample pool for 2-DE.
b)
of the protein. More studies are needed in order to test these hypotheses.
Tick proteins differentially expressed in infected ticks included actin, enolase, guanine nucleotide-binding pro-tein and an unknown larval propro-tein (Table 3). Actin is a cytoskeleton component that appeared under-expressed in all infectedRhipicephalusspp. ticks except inR. san-guineus infected with E. canis were actin was over-expressed. Rickettsia, Theileria, Ehrlichia and Anaplasma infections cause rearrangements of actin
cytoskeleton in mammalian [37-40] and invertebrate host cells [5,41]. The remodeling of the actin cytoskele-ton by pathogen infection could explain the changes in actin detected in infected ticks. Differences in actin dif-ferential expression between different groups of infected ticks may be due to differences in pathogen infection and/or development mechanisms [5,42,43].
Host lipid metabolism including enolase function is affected in host-pathogen interactions [24,44-50]. Therefore, under-expression of enolase in infected
CONTROL INFECTED
R. sanguineus / R. conorii
R. sanguineus / E. canis
R. bursa / T. annulata
R. turanicus / A. ovis
Rhipicephalus spp. ticks could reflect changes in lipid metabolism induced by pathogen infection.
The other two tick proteins differentially expressed in response to infection, guanine nucleotide-binding pro-tein and the unknown larval propro-tein, are difficult to relate to infection and exhibited different expression profiles depending on the tick/pathogen tested. These differences could arise from both the tick and the
pathogen. In this respect,R. turanicusinfected with A. ovisshowed some distinctive features in protein expres-sion profiles when compared to other tick/pathogen tested (Figure 2 and 3; Table 2).
Although feeding ticks were incubated for three days in the laboratory to complete blood meal digestion prior to dissection and RNA/DNA/protein extraction, host proteins identified were highly abundant blood proteins
pH3 pH11 pH3 pH11
70
Molecula
r w
eight (kDa)
15
CONTROL
INFECTED
70
Molecular w
eight (kDa)
15
18 19 20 13
16
21 14
15 101112
18 19 20 13
11 5432 1 6
R. sanguineus / R. conorii
R. sanguineus / E. canis
that were probably masking proteins with lower abun-dance but perhaps more biologically relevant. Spot over-lapping in 2-D electrophoresis is a problem described by different investigators [51-53]. In this work, pathogen proteins co-migrated with host haptoglobin and hemo-globins (spots 13, 18 and 19). For example, a bacterial ATPase was identified in spot 19 by peptide mass fin-gerprinting (table 3). Additionally, a-proteobacteria
peptides IGYVSGMSGR (peptidase M2; GenBank acces-sion number 220905421) and PIVYSAETQR (predicted protein; 227819201) were sequenced in spots 13 and 18, respectively, afterde novointerpretation of non-assigned high-quality spectra.
Recently, Wickramasekara et al. [16] detected by MS host blood proteins in different tick species several months after feeding and molting. In our experiments,
pH3 pH11 pH3 pH11
70
Molecular w
eight (kDa)
15
CONTROL
INFECTED
70
Molecular w
eight (kDa)
15
R. bursa / T. annulata
R. turanicus / A. ovis
54 32 1 6
101112
13
18 19 20 21 7 8 9
14
15
1617
7 8 9
10 12
14
16 15
17
differences in protein profiles were found when compar-ing the two groups of uninfected R. sanguineuscontrol ticks analyzed (Figure 2, left images), those suggesting that some of the tick differentially expressed proteins may be affected by tick feeding while other were masked by more abundant host proteins in feeding ticks. In future studies, it may be necessary to increase the time between tick collection and analysis to reduce the quan-tity of host blood proteins present in the tick.
Analysis of mRNA levels for selected differentially expressed tick proteins
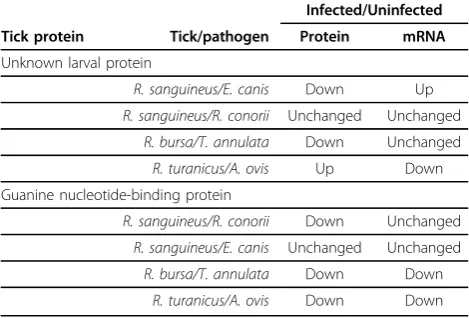
To correlate differential expression of tick guanine nucleotide-binding and unknown larval protein mRNA levels, the RNAs from individual infected and uninfected ticks were analyzed by real-time RT-PCR (Figure 5). The results showed at the mRNA level differences in differen-tial protein expression between tick/pathogen groups (Table 4). In most cases mRNA and protein levels were
unchanged or down-regulated, differences that were regarded as not significant due to the lack of statistical analysis in proteomics data. In most cases, a good corre-lation was obtained between mRNA and protein levels, thus suggesting that gene expression was regulated at the transcriptional level. However, for the unknown larval protein opposite results were obtained forR. sanguineus/ R. conoriiandR. turanicus/A. ovis(Table 4). These differ-ences suggested that the unknown larval protein levels may be regulated at different levels in different Rhipice-phalusspp. and/or in response to different pathogens infection. Additionally, these results suggested that at least in some cases the expression of the unknown larval protein might be regulated at the post-transcriptional level. These results reinforced the importance of con-ducting proteomics and transcriptomics studies together to fully characterize host response to infection [5,25].
Technical considerations
Herein tick proteins were extracted with TriReagent (Sigma) to allow for simultaneous extraction and analy-sis of DNA, RNA and proteins from the same sample. This procedure resulted in low protein amounts which could have been improved by using more suitable meth-ods employed for 2-D analysis [54-56]. However, DNA and RNA were required to determine pathogen infection and to characterize mRNA levels for some of the differ-entially expressed proteins, respectively. Moreover, after analysis of 300 collected ticks, only 16 were infected with a pathogen, and in some cases experimental groups positive for the same pathogen contained only 2 ticks. These facts made the amount of proteins available for analysis the principal limitation in the development of this study and even using a highly sensitive technique such as saturation DIGE labeling, it was necessary to mix protein samples from different individuals of the same tick species to carry out the experiments. Protein mixing was not required for the saturation labeling, but to run a preparative gel for identification of differentially expressed proteins by mass spectrometry.
Under some circumstances with naturally (and not experimentally) infected ticks, it may be difficult to
Table 2 Summary of differentially expressed proteins in the comparative analysis ofRhipicephalusspp. adult female ticks naturally infected with different pathogens
Tick/pathogen Total numberof differentially expressed protein spots
Under expressedin infected ticks
Over expressedin infected ticks
R. sanguineus/R. conorii
65 48 17
R. sanguineus/E. canis 59 41 18
R. bursa/T. annulata 54 37 17
R. turanicus/A. ovis 50 20 30
Ticks infected with different pathogens were compared with their respective uninfected controls and the proteins that were differentially expressed with an average ratio of ± 5-fold after DeCyder software analysis of DIGE gels were considered. Two experiments were conducted with similar results.
Figure 4 Preparative 2-D gel of pooled proteins from
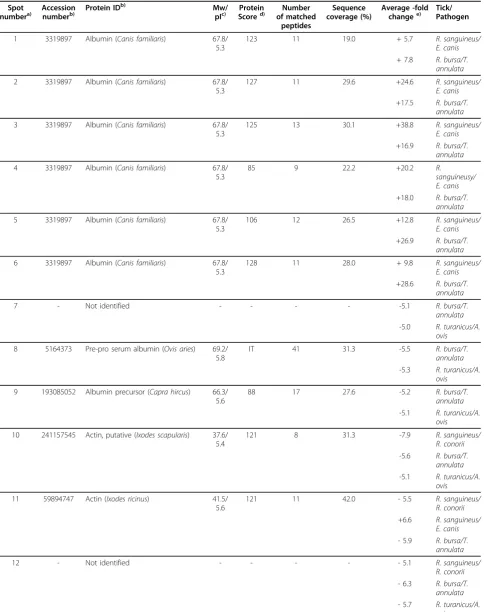
Table 3Rhipicephalusspp. tick differentially expressed proteins identified by MALDI-TOF MS and LC-MS/MS after saturation 2-D DIGE analysis
Spot
numbera) Accessionnumberb) Protein ID b)
Mw/
pIc) ScoreProteind) of matchedNumber
peptides
Sequence coverage (%)
Average -fold
changee) Tick/Pathogen
1 3319897 Albumin (Canis familiaris) 67.8/ 5.3
123 11 19.0 + 5.7 R. sanguineus/
E. canis
+ 7.8 R. bursa/T. annulata
2 3319897 Albumin (Canis familiaris) 67.8/ 5.3
127 11 29.6 +24.6 R. sanguineus/
E. canis
+17.5 R. bursa/T. annulata
3 3319897 Albumin (Canis familiaris) 67.8/ 5.3
125 13 30.1 +38.8 R. sanguineus/
E. canis
+16.9 R. bursa/T. annulata
4 3319897 Albumin (Canis familiaris) 67.8/ 5.3
85 9 22.2 +20.2 R.
sanguineusy/ E. canis
+18.0 R. bursa/T. annulata
5 3319897 Albumin (Canis familiaris) 67.8/ 5.3
106 12 26.5 +12.8 R. sanguineus/
E. canis
+26.9 R. bursa/T. annulata
6 3319897 Albumin (Canis familiaris) 67.8/ 5.3
128 11 28.0 + 9.8 R. sanguineus/
E. canis
+28.6 R. bursa/T. annulata
7 - Not identified - - - - -5.1 R. bursa/T.
annulata
-5.0 R. turanicus/A. ovis
8 5164373 Pre-pro serum albumin (Ovis aries) 69.2/ 5.8
IT 41 31.3 -5.5 R. bursa/T. annulata
-5.3 R. turanicus/A. ovis
9 193085052 Albumin precursor (Capra hircus) 66.3/ 5.6
88 17 27.6 -5.2 R. bursa/T. annulata
-5.1 R. turanicus/A. ovis
10 241157545 Actin, putative (Ixodes scapularis) 37.6/ 5.4
121 8 31.3 -7.9 R. sanguineus/ R. conorii
-5.6 R. bursa/T. annulata
-5.1 R. turanicus/A. ovis
11 59894747 Actin (Ixodes ricinus) 41.5/ 5.6
121 11 42.0 - 5.5 R. sanguineus/
R. conorii
+6.6 R. sanguineus/ E. canis
- 5.9 R. bursa/T. annulata
12 - Not identified - - - 5.1 R. sanguineus/
R. conorii
- 6.3 R. bursa/T. annulata
Table 3Rhipicephalusspp. tick differentially expressed proteins identified by MALDI-TOF MS and LC-MS/MS after saturation 2-D DIGE analysis(Continued)
13 258499 Haptoglobin heavy chain, HpH chain (Canis familiaris)
27.3/ 5.8
104 7 37.1 +36.7
+28.3 +12.4
R. sanguineus/ R. conorii R. sanguineus/ E. canis R. bursa/T. annulata
14 215497327 Enolase (Ixodes scapularis) 21.5/ 8.9
IT 4 18.1 - 8.2 R. sanguineus/
R. conorii
- 6.7 R. bursa/T. annulata
- 5.5 R. turanicus/A. ovis
15 67083997 Guanine nucleotide-binding protein (Ixodes scapularis)
36.0/ 7.1
IT 2 9.4 -28.7
- 7.9 - 5.1
R. sanguineus/ R. conorii R. bursa/T. annulata R. turanicus/A. ovis
16 157399341 Unknown larval protein (Rhipicephalus annulatus)
19.1/ 6.16
IT 3 17.5 -25.6
-7.3 +18.5
R. sanguineus/ R. conorii R. bursa/T. annulata R. turanicus/A. ovis
17 157399341 Unknown larval protein (Rhipicephalus annulatus)
19.1/ 6.16
IT 5 11.1 - 12.4
+17.8
R. bursa/T. annulata R. turanicus/A. ovis
18 44887976 Full hemoglobin subunit beta (Chrysocyon brachyurus)
16.1/ 8.0
112 10 59.6 +38.6 R. sanguineus/
R. conorii
+ 9.5 R. sanguineus/ E. canis
+17.0 R. bursa/T. annulata
19 (mix) 116618139 Conjugal transfer protein, ATPase (Leuconostoc mesenteroides)
95.8/ 5.8
86 16 17.1 +62.4 R. bursa/T.
annulata
44887976 Full hemoglobin subunit beta (Chrysocyon brachyurus)
16.1/ 8.0
75 8 56.2 +13.1 R. sanguineus/
E. canis
+38.6 R. sanguineus/ R. conorii
20 44888810 Full hemoglobin subunit alpha (Canis familiaris)
15.3/ 8.0
111 7 63.8 +66.7
+ 7.0 +35.9
R. sanguineus/ R. conorii R. sanguineus/ E. canis R. bursa/T. annulata
21 44888810 Full hemoglobin subunit alpha (Canis familiaris)
15.3/ 8.0
IT 7 29.3 +41.5 R. sanguineus/
R. conorii
+30.7 R. bursa/T. annulata
a)
Spot numbers refer to the 2 D gel proteins of interest that were analyzed by mass spectrometry (Figure 3).
b)
Accession number and protein identity are listed according to the NCBInr database for the best match.
c)
Abbreviations: Mw, molecular weight (kDa); pI, isoelectrical point.
d)
Protein score is-10*Log(P), wherePis the probability that the observed match is a random event, it is based on NCBInr database using MASCOT Peptide Mass Fingerprinting searching program. When IT appears, it means that these proteins were identified by LC-MS/MS.
e)
obtain a large number of infected ticks in order to per-form the protein isolation with optimized methods for further proteomics analysis independently of DNA and RNA extractions, which would improve the quantity and quality of protein samples. Using optimized methods for protein extraction would allow analysis of individual samples and thus increase the statistical power of results. Another important issue to be considered for further studies is the high proportion of host proteins
that were identified. Whereas this work focused on dif-ferentially expressed tick proteins, to improve the sensi-tivity of proteomics analysis in feeding ticks and detect proteins with low abundance it would be useful to reduce the concentration of highly-abundant host pro-teins before protein profiling by using different commer-cial strategies developed for the depletion of these proteins in different complex biological samples [57-59].
Conclusions
The results reported here proved that saturation DIGE technology in combination with MS analysis is a power-ful tool for the study of host-tick-pathogen interactions using a small number of ticks. Herein, host, tick and pathogen proteins were identified and shown to be pre-sent in different amounts in infected and uninfected ticks. These results supported that pathogen infection affect tick protein expression. However, these results should be considered preliminary due to the limitations imposed by technical consideration discussed above. Therefore, more comprehensive analyses are required with optimized protein extraction methods to allow ana-lysis of individual tick samples and by removing most abundant host proteins from tick samples in an attempt to identify a larger number of tick differentially expressed proteins through multi-dimensional LC-MS/ MS and correlating transcriptomics and proteomics data to characterize the regulatory networks at the tick-pathogen interface.
Figure 5mRNA levels of genes coding for selected differentially expressed proteins. The genes encoding for differentially expressed unknown larval and guanine nucleotide-binding proteins were selected for mRNA analysis by real-time RT-PCR. mRNA levels were characterized in individual whole ticks naturally-infected with different pathogens using sequence-specific oligonucleotide primers. In all cases, matching groups of uninfected tick samples were analyzed concurrently for comparison. The graph depicts the infected to uninfected mRNA ratio (+SD) calculated by dividing normalized mRNA levels in infected ticks by the average of the normalized mRNA level in uninfected control ticks. Normalized mRNA levels were compared between infected and uninfected ticks by Student’s t-Test (*P < 0.05). Abbreviations:R.s/E.c,R. sanguineus/E. canis;R.s/R.c,R. sanguineus/R. conorii;R.b/T.a,R. bursa/T. annulata;R.t/A.o,R. turanicus/A. ovis.
Table 4 Comparative analysis between protein and mRNA levels for selected differentially expressed tick proteins
Infected/Uninfected
Tick protein Tick/pathogen Protein mRNA
Unknown larval protein
R. sanguineus/E. canis Down Up
R. sanguineus/R. conorii Unchanged Unchanged
R. bursa/T. annulata Down Unchanged
R. turanicus/A. ovis Up Down Guanine nucleotide-binding protein
R. sanguineus/R. conorii Down Unchanged
R. sanguineus/E. canis Unchanged Unchanged
R. bursa/T. annulata Down Down
Acknowledgements
This research was supported by the Ministerio de Ciencia e Innovación, Spain (project BFU2008-01244/BMC) and the CSIC intramural project PA1002025 to JF, and the Ministry of Health, Italy (project IZS SI 10-06). M. Villar was funded by the JAE-DOC program (CSIC-FSE), Spain.
Author details 1
Instituto de Investigación en Recursos Cinegéticos IREC (CSIC-UCLM-JCCM), Ronda de Toledo s/n, 13005 Ciudad Real, Spain.2Intituto Zooprofilattico
Sperimentale della Sicilia, Via G. Marinuzzi n°3, 90129 Palermo, Sicily, Italy.
3Centro de Biología Molecular“Severo Ochoa”(CSIC-UAM), 28049
Cantoblanco, Madrid, Spain.4Utrecht Centre for Tick-borne Diseases (UCTD), Department of Infectious Diseases and Immunology, Faculty of Veterinary Medicine, Utrecht University, Yalelaan 1, 3584CL, Utrecht, The Netherlands.
5Department of Veterinary Pathobiology, Center for Veterinary Health
Sciences, Oklahoma State University, Stillwater, OK 74078, USA.
Authors’contributions
MV and JF conceived and designed the experiments. JF, MV, AT, SC and JV coordinated the experiments. MV, AT, YN, ZZ, AM, AA, SS and GLB performed the experiments. MV, YN, AM, and JF analyzed the data. MV and JF drafted the manuscript. All authors read and approved the final manuscript.
Competing interests
The authors declared that they have no competing interests.
Received: 3 June 2010 Accepted: 12 August 2010 Published: 12 August 2010
References
1. de la Fuente J, Estrada-Pena A, Venzal JM, Kocan KM, Sonenshine DE:
Overview: Ticks as vectors of pathogens that cause disease in humans and animals.Front Biosci2008,13:6938-6946.
2. Dumler JS, Barbet AF, Bekker CP, Dasch GA, Palmer GH, Ray SC, Rikihisa Y, Rurangirwa FR:Reorganization of genera in the familiesRickettsiaceae
andAnaplasmataceaein the orderRickettsiales: unification of some species ofEhrlichiawithAnaplasma,CowdriawithEhrlichiaandEhrlichia
withNeorickettsia, descriptions of six new species combinations and designation ofEhrlichia equiand‘HGE agent’as subjective synonyms of
Ehrlichia phagocytophila.Int J Syst Evol Microbiol2001,51:2145-2165. 3. Kocan KM, de la Fuente J, Blouin EF, Garcia-Garcia JC:Anaplasma
marginale(Rickettsiales: Anaplasmataceae): recent advances in defining host-pathogen adaptations of a tick-borneRickettsia.Parasitology2004,
129(Suppl):S285-300.
4. Zivkovic Z, Blouin EF, Manzano-Roman R, Almazán C, Naranjo V, Massung RF, Jongejan F, Kocan KM, de la Fuente J:Anaplasma phagocytophilumandA. marginaleelicit different gene expression responses in ticks and cultured tick cells.Comp Funct Genomics2009, 9. 5. de la Fuente J, Blouin EF, Manzano-Roman R, Naranjo V, Almazán C, Pérez de la Lastra JM, Zivkovic Z, Jongejan F, Kocan KM:Functional genomic studies of tick cells in response to infection with the cattle pathogen,
Anaplasma marginale.Genomics2007,90:712-722. 6. Madden RD, Sauer JR, Dillwith JW:A proteomics approach to
characterizing tick salivary secretions.Exp Appl Acarol2002,28:77-87, Erratum in: Exp Appl Acarol 2004, 32:129. Corrected and republished in: Exp Appl Acarol 2004, 32:77-87.
7. Valenzuela JG:High-throughput approaches to study salivary proteins and genes from vectors of disease.Insect Biochem Mol Biol2002,
32:1199-1209.
8. Alarcon-Chaidez FJ, Wikel SK:Comparative aspects of the tick-host relationship: immunobiology, genomics and proteomics.Symp Soc Exp Biol2004,55:185-209, discussion 243-245.
9. Oleaga A, Escudero-Población A, Camafeita E, Pérez-Sánchez R:A proteomic approach to the identification of salivary proteins from the argasid ticksOrnithodoros moubataandOrnithodoros erraticus.Insect Biochem Mol Biol2007,37:1149-1159.
10. Rachinsky A, Guerrero FD, Scoles GA:Differential protein expression in ovaries of uninfected and Babesia-infected southern cattle ticks,
Rhipicephalus (Boophilus) microplus.Insect Biochem Mol Biol2007,
37:1291-1308.
11. Rachinsky A, Guerrero FD, Scoles GA:Proteomic profiling ofRhipicephalus (Boophilus) microplusmidgut responses to infection withBabesia bovis.
Vet Parasitol2008,152:294-313.
12. Vennestrøm J, Jensen PM:Ixodes ricinus: the potential of two-dimensional gel electrophoresis as a tool for studying host-vector-pathogen interactions.Exp Parasitol2007,115:53-58.
13. Francischetti IM, Mans BJ, Meng Z, Gudderra N, Veenstra TD, Pham VM, Ribeiro JM:An insight into the sialome of the soft tick,Ornithodorus parkeri.Insect Biochem Mol Biol2008,38:1-21.
14. Francischetti IM, Meng Z, Mans BJ, Gudderra N, Hall M, Veenstra TD, Pham VM, Kotsyfakis M, Ribeiro JM:An insight into the salivary transcriptome and proteome of the soft tick and vector of epizootic bovine abortion,Ornithodoros coriaceus.J Proteomics2008,71:493-512. 15. Mans BJ, Andersen JF, Francischetti IM, Valenzuela JG, Schwan TG,
Pham VM, Garfield MK, Hammer CH, Ribeiro JM:Comparative sialomics between hard and soft ticks: implications for the evolution of blood-feeding behavior.Insect Biochem Mol Biol2008,38:42-58.
16. Wickramasekara S, Bunikis J, Wysocki V, Barbour AG:Identification of residual blood proteins in ticks by mass spectrometry proteomics.Emerg Infect Dis2008,14:1273-1275.
17. Stopforth E, Neitz AW, Gaspar AR:A proteomics approach for the analysis of hemolymph proteins involved in the immediate defense response of the soft tick, Ornithodoros savignyi, when challenged with Candida albicans.Exp Appl Acarol2010,51:309-325.
18. Shaw J, Rowlinson R, Nickson J, Stone T, Sweet A, Williams K, Tonge R:
Evaluation of saturation labelling two-dimensional difference gel electrophoresis fluorescent dyes.Proteomics2003,3:1181-1195. 19. Kondo T, Seike M, Mori Y, Fujii K, Yamada T, Hirohashi S:Application of
sensitive fluorescent dyes in linkage of laser microdissection and two-dimensional gel electrophoresis as a cancer proteomic study tool.
Proteomics2003,3:1758-1766.
20. Unlü M, Morgan ME, Minden JS:Difference gel electrophoresis: a single gel method for detecting changes in protein extracts.Electrophoresis
1997,18:2071-2077.
21. Manilla G:Fauna d’Italia. Acari: IxodidaBologna: Edizioni Calderini 1998. 22. Torina A, Vicente J, Alongi A, Scimeca S, Turlá R, Nicosia S, Di Marco V,
Caracappa S, de la Fuente J:Observed prevalence of tick-borne pathogens in domestic animals in Sicily, Italy during 2003-2005.
Zoonoses Public Health2007,54:8-15.
23. Schnittger L, Yin H, Qi B, Gubbels MJ, Beyer D, Niemann S, Jongejan F, Ahmed JS:Simultaneous detection and differentiation ofTheileriaand
Babesiaparasites infecting small ruminants by reverse line blotting.
Parasitol Res2004,92:189-96.
24. Shevchenko A, Wilm M, Vorm O, Mann M:Mass spectrometric sequencing of proteins silver-stained polyacrylamide gels.Anal Chem1996,
68:850-858.
25. Naranjo V, Villar M, Martín-Hernando MP, Vidal D, Höfle U, Gortazar C, Kocan KM, Vázquez J, de la Fuente J:Proteomic and transcriptomic analyses of differential stress/inflammatory responses in mandibular lymph nodes and oropharyngeal tonsils of European wild boars naturally infected withMycobacterium bovis.Proteomics2007,7:220-231. 26. Perkins DN, Pappin DJ, Creasy DM, Cottrell JS:Probability-based protein
identification by searching sequence databases using mass spectrometry data.Electrophoresis1999,20:3551-3367.
27. de la Fuente J, Blouin EF, Manzano-Roman R, Naranjo V, Almazán C, Pérez de la Lastra JM, Zivkovic Z, Massung RF, Jongejan F, Kocan KM:Differential expression of the tick protective antigen subolesin inAnaplasma marginale-and A.phagocytophilum-infected host cells.Ann N Y Acad Sci
2008,1149:27-35.
28. Torina A, Alongi A, Naranjo V, Estrada-Peña A, Vicente J, Scimeca S, Marino AM, Salina F, Caracappa S, de la Fuente J:Prevalence and genotypes ofAnaplasmaspecies and habitat suitability for ticks in a Mediterranean ecosystem.Appl Environ Microbiol2008,74:7578-7584. 29. Torina A, Alongi A, Scimeca S, Vicente J, Caracappa S, de la Fuente J:
Prevalence of tick-borne pathogens in ticks in Sicily.Transbound Emerg Dis2010,57:46-48.
30. Gabay C, Kushner I:Acute-phase proteins and other systemic responses to inflammation.N Engl J Med1999,340:448-454.
32. Nazifi S, Razavi SM, Esmailnejad Z, Gheisari H:Study on acute phase proteins (haptoglobin, serum amyloid A, fibrinogen, and ceruloplasmin) changes and their diagnostic values in bovine tropical theileriosis.
Parasitol Res2009,105:41-46.
33. Fogaça AC, da Silva PI Jr, Miranda MT, Bianchi AG, Miranda A, Ribolla PE, Daffre S:Antimicrobial activity of a bovine hemoglobin fragment in the tickBoophilus microplus.J Biol Chem1999,274:25330-25334.
34. Nakajima Y, Ogihara K, Taylor D, Yamakawa M:Antibacterial hemoglobin fragments from the midgut of the soft tick,Ornithodoros moubata (Acari: Argasidae).J Med Entomol2003,40:78-81.
35. Sforça ML, Machado A, Figueredo RC, Oyama S Jr, Silva FD, Miranda A, Daffre S, Miranda MT, Spisni A, Pertinhez TA:The micelle-bound structure of an antimicrobial peptide derived from the alpha-chain of bovine hemoglobin isolated from the tickBoophilus microplus.Biochemistry2005,
44:6440-6451.
36. Sonenshine DE, Hynes WL, Ceraul SM, Mitchell R, Benzine T:Host blood proteins and peptides in the midgut of the tickDermacentor variabilis
contribute to bacterial control.Exp Appl Acarol2005,36:207-223. 37. Mota MM, Rodriguez A:Invasion of mammalian host cells byPlasmodium
sporozoites.Bioessays2002,24:149-156.
38. Stich RW, Olah GA, Brayton KA, Brown WC, Fechheimer M, Green-Church K, Jittapalapong S, Kocan KM, McGuire TC, Rurangirwa FR, Palmer GH:
Identification of a novelAnaplasma marginaleappendage-associated protein that localizes with actin filaments during intraerythrocytic infection.Infect Immun2004,72:7257-7264.
39. Stevens JM, Galyov EE, Stevens MP:Actin-dependent movement of bacterial pathogens.Nat Rev Microbiol2006,4:91-101.
40. Chan YG, Cardwell MM, Hermanas TM, Uchiyama T, Martinez JJ:Rickettsial outer-membrane protein B (rOmpB) mediates bacterial invasion through Ku70 in an actin, c-Cbl, clathrin and caveolin 2-dependent manner.Cell Microbiol2009,11:629-644.
41. Suzuki S, Oshima K, Kakizawa S, Arashida R, Jung HY, Yamaji Y, Nishigawa H, Ugaki M, Namba S:Interaction between the membrane protein of a pathogen and insect microfilament complex determines insect-vector specificity.Proc Natl Acad Sci USA2006,103:4252-4257.
42. Rikihisa Y, Zhang Y, Park J:Inhibition of infection of macrophages with
Ehrlichia risticiiby cytochalasins, monodansylcadaverine, and taxol.Infect Immun1994,62:5126-5132.
43. Heussler VT, Stanway RR:Cellular and molecular interactions between the apicomplexan parasitesPlasmodiumandTheileriaand their host cells.
Parasite2008,15:211-218.
44. Pancholi V:Multifunctional alpha-enolase: its role in diseases.Cell Mol Life Sci2001,58:902-920.
45. Lin M, Rikihisa Y:Ehrlichia chaffeensisandAnaplasma phagocytophilum
lack genes for lipid A biosynthesis and incorporate cholesterol for their survival.Infect Immun2003,71:5324-5331.
46. de la Fuente J, Ayoubi P, Blouin EF, Almazán C, Naranjo V, Kocan KM:Gene expression profiling of human promyelocytic cells in response to infection withAnaplasma phagocytophilum.Cell Microbiol2005,7:549-559. 47. Manzano-Roman R, Almazán C, Naranjo V, Blouin EF, Kocan KM, de la
Fuente J:Expression of perilipin in human promyelocytic cells in response toAnaplasma phagocytophiluminfection results in modified lipid metabolism.J Med Microbiol2008,57:159-163.
48. Candela M, Biagi E, Centanni M, Turroni S, Vici M, Musiani F, Vitali B, Bergmann S, Hammerschmidt S, Brigidi P:Bifidobacterial enolase, a cell surface receptor for human plasminogen involved in the interaction with the host.Microbiology2009,155:3294-3303.
49. Donofrio FC, Calil AC, Miranda ET, Almeida AM, Benard G, Soares CP, Veloso SN, Soares CM, Mendes Giannini MJ:Enolase fromParacoccidioides brasiliensis: isolation and identification as a fibronectin-binding protein.J Med Microbiol2009,58:706-713.
50. Kesimer M, Kiliç N, Mehrotra R, Thornton DJ, Sheehan JK:Identification of salivary mucin MUC7 binding proteins fromStreptococcus gordonii.BMC Microbiol2009,9:163.
51. Gygi SP, Corthals GL, Zhang Y, Rochon Y, Aebersold R:Evaluation of two-dimensional gel electrophoresis-based proteome analysis technology.
Proc Natl Acad Sci USA2000,97:9390-9395.
52. Campostrini N, Areces LB, Rappsilber J, Pietrogrande MC, Dondi F, Pastorino F, Ponzoni M, Righetti PG:Spot overlapping in two-dimensional maps: a serious problem ignored for much too long.Proteomics2005,
5:2385-2395.
53. Yang Y, Thannhauser TW, Li L, Zhang S:Development of an integrated approach for evaluation of 2-D gel image analysis: impact of multiple proteins in single spots on comparative proteomics in conventional 2-D gel/MALDI workflow.Electrophoresis2007,28:2080-2094.
54. Rabilloud T:Solubilization of proteins for electrophoretic analyses.
Electrophoresis1996,17(5):813-829.
55. Rabilloud T, Adessi C, Giraudel A, Lunardi J:Improvement of the solubilization of proteins in two-dimensional electrophoresis with immobilized pH gradients.Electrophoresis1997,18:307-316. 56. 2-D Electrophoresis. Principles and MethodsBuckinghamshire, UK: GE
Healthcare Limited, Ed 2007.
57. Björhall K, Miliotis T, Davidsson P:Comparison of different depletion strategies for improved resolution in proteomic analysis of human serum samples.Proteomics2005,5:307-317.
58. Keidel EM, Ribitsch D, Lottspeich F:Equalizer technology - Equal rights for disparate beads.Proteomics2010,10:2089-2098.
59. Marco-Ramell A, Bassols A:Enrichment of low-abundance proteins from bovine and porcine serum samples for proteomic studies.Res Vet Sci
2010.
doi:10.1186/1477-5956-8-43
Cite this article as:Villaret al.:Application of highly sensitive saturation
labeling to the analysis of differential protein expression in infected ticks from limited samples.Proteome Science20108:43.
Submit your next manuscript to BioMed Central and take full advantage of:
• Convenient online submission
• Thorough peer review
• No space constraints or color figure charges
• Immediate publication on acceptance
• Inclusion in PubMed, CAS, Scopus and Google Scholar • Research which is freely available for redistribution