https://doi.org/10.3926/jiem.2780
A Maturity Model for the Information-Driven SME
Xileidys Parra1 , Xavier Tort-Martorell1 , Carmen Ruiz-Viñals2 , Fernando Álvarez-Gómez3 1Universitat Politécnica de Catalunya (Spain)
2Universitat Abat Oliba CEU (Spain) 3Universitat Oberta de Catalunya (Spain)
[email protected], [email protected], [email protected], [email protected]
Received: November 2018 Accepted: January 2019
Abstract:
Purpose: This article presents a maturity model for the evaluation of the information-driven decision-making process (DMP) in small and medium enterprises. This model is called “Simplified Holistic Approach to DMP Evaluation (SHADE)”. The SHADE model is based in the “Circumplex Hierarchical Representation of the Organization Maturity Assessment” (CHROMA) framework for characterizing the information-driven DMP in organizations
Design/methodology/approach: The CHROMA-SHADE provides a competency evaluation methodology regarding the SME’s use of data for making better-informed decisions. This model groups the main factors influencing the information-driven DMP and classifies them into five dimensions: data availability, data quality, data analysis and insights, information use and decision-making. It addresses these dimensions systematically, delivering a framework for positioning the organization from an uninitiated to a completely embedded stage. The assessment consists of interviews based on a standardized open-ended questionnaire performed to key company personnel followed by an analysis of the answers and their scoring performed by an expert evaluator.
Findings:The results of its application indicate this model is well adapted to the SMEs resulting useful for identifying strengths and weaknesses, thereby providing insights for prioritizing improvement actions.
Originality/value: The CHROMA-SHADE model follows a novel, holistic approach that embraces the complexities inherent in a multiplicity of factors that, at the technological and management level, converge to enable more objective and better-supported decisions to be made through the intelligent use of information.
Keywords: Maturity model, Information-driven decision-making process, assessment tool, small and medium enterprises, management
To cite this article:
1. Introduction
In a previous work, the “Circumplex Hierarchical Representation of the Organization Maturity Assessment” (CHROMA) model for information-driven decision-making process (DMP) was proposed for evaluating the organization’s proficiency in the use of information to support decision-making. This model considers the complexities inherent in a multiplicity of factors that at the technological and management level converge for making more objective and better-supported decisions through the intelligent use of information (Parra, Tort-Martorell, Ruiz-Viñals & Álvarez-Gómez, 2017). The CHROMA model gathers those factors (attributes) into the following dimensions: data availability, data quality, data analysis and insights, information use and decision-making. Recently, several other independent publications have reinforced the relevance of the aforementioned five aspects to better-informed decision-making. (Hartmann, Zaki & Feldmann, 2014; Henke, Bughin, Chui, Manyika, Saleh, Wiseman et al., 2016; Jernigan, Ransbotham & Kiron, 2016; Ransbothan, Kiron & Prentice, 2016, 2017; Repenning, Kieffer & Astor, 2017; Schoemaker & Tetlock, 2017).
A test conducted on three family-owned small/medium-sized (SME) (Parra, Tort-Martorell, et al., 2017) confirmed the ability of the CHROMA model and its associated assessment tool to collect key information. The characterization delivered to the companies that participated in this early stage study led to the identification of strengths and weaknesses that became a useful feedback for improving their DMP. Likewise, this model proved to be useful in establishing the maturity of information-driven DMPs in the SMEs analyzed without causing them significant disruption.
However, the high level of detail provided by the CHROMA model is better suited to medium-to-large sized companies which have their information transformation and decision-making processes distributed across the several levels of the organization hierarchy. Conversely, in SMEs the information-driven DMP tend to be concentrated in senior level management. Hence, the CHROMA model had to be simplified in order to fit this intrinsic SMEs nature. Our hypothesis was that a derived maturity model having a reduced set of attributes, in comparison with to CHROMA model, would facilitate the interpretation and the bound between the assessment output and the reality. Moreover, it was foresaw that a summarized assessment tool that merged the questionnaires previously addressed to different representatives of the organization in a single and more straightforward one was required for facilitating the interview process and the analysis corresponding as well as the interpretation and implementation of the model’s result (Parra, Tort-Martorell, et al., 2017).
In line with those findings, a simplified and enhanced version of the CHROMA model was then developed. This model proposes a holistic methodology for consistently evaluating how SMEs use the data and information to support decision-making, categorizing them in a maturity reference model aimed to help them to improve. Such improvement is achieved by following the DMP information-driven excellence roadmap, a framework that describes the aspects that must be addressed in order to help them become information-driven companies.
In this regard, this article starts describing the big picture that underpins the need to focus on SMEs. Then a “Simplified Holistic Approach to DMP Evaluation (SHADE) of the CHROMA model” for information-driven SME is presented. Next, the work methodology and the results of the application of the proposed model are detailed. Finally, we present the conclusions of this study.
2. Background
Despite this, many organizations claim they do not know what the key information is, where to find it and/or how to process their data to support the different types of decisions and processes involved. This is especially critical in situations involving non-routine decisions, as they present a greater challenge for organizations who may not have the appropriate technology platforms and/or experience required to support decisions made under unusual conditions (Citroen, 2009, 2011; Frishammar, 2003).
In line with the above, it is still often the case that organizations find themselves unable to fully understand how to use analytics to take advantage of their data (Kiron et al., 2015; LaValle, Lesser, Shockley, Hopkins & Kruschwitz, 2011). The experience of managers struggling with enormous amounts of data and sophisticated analytics is a frequent issue (Ransbothan et al., 2016). In the same manner, the effort required to understand the data available and generate good quality data while improving data usefulness for decision-making is an unsolved challenge (Ransbothan et al., 2016).
This problem has been addressed in previous research that identified different problems and barriers that hinder the effective use of an organization’s data (Davenport 2006, 2009; Davenport, Harris & Morison, 2010; LaValle et al., 2011; Lim, Chen & Chen, 2013; Florez & González, 2013; Cöster & Petri, 2014; Rosenzweig, 2014; Kiron et al., 2015). These studies agree that the main difficulty lies in addressing the situation holistically considering the inherent complexity of the problem.
However, a recent study has found a growing trend in the use of data and analytical insights for organizations’ strategic purposes such as to innovate business functions or entire business models (Ransbothan et al., 2017). Companies at the forefront of those trends have been successful in the use of their analytical capabilities to address business problems with a broader mindset. In this regard, improving the organization’s information-driven DMP has contributed to the expansion of their capabilities to innovate, identify business opportunities, improve performance and achieve greater competitive differentiation. Moreover, data and analytics insights can help in harnessing the organization’s streamline internal processes and in creating novel experimentation mechanisms for continuous learning and feedback (Henke et al., 2016).
Nonetheless, it is important to remember that large companies are the ones predominantly reporting such success stories. This, to a certain extent, is because these corporations have specialist data scientists and the technology required for addressing the challenges in the improvement of their information-driven DMP.
Conversely, for SMEs such resources might be inaccessible, making it unfeasible for them to embrace commercially available business analytics solutions. In 2012, the adoption rate of business and big data analytics among UK SMEs was only 0.2 per cent, compared to 25 per cent for businesses with over 1,000 employees (e-skills UK, 2013). During the next five years, the rate of growth of analytics technology adoption in SMEs is expected to be less than 50% (TechNavio, 2014), which considerably higher compared to large companies.
Even though, SMEs have consolidated as a cornerstone of prosperity and stability in both the global economy and society (OECD, 2017). These companies create jobs, invest in their communities and contribute greatly to reach more inclusive and prosperous societies (Ecorys Netherlands, 2012; Muller, Devnani, Julius, Gagliardi & Marzocchi, 2014; Muller, Julius, Herr, Koch, Peycheva & McKiernan, 2017). In consequence, the impact that SMEs have on the global economy is unquestionable.
Nowadays, the digitalization and data analytics offer new opportunities for SMEs to reach global markets, but a large proportion of SMEs have not been able to reap the benefits of the technological transition. Evidence shows that SMEs are lagging behind in adopting digital technologies and analytical applications (e-skills UK, 2013; OECD, 2017; TechNavio, 2014). In these companies, such resources might be inaccessible, making it unfeasible for them to embrace commercially available business analytics solutions.
3. The CHROMA-SHADE Model
The CHROMA model is a maturity model that was developed for assessing the proficiency of organizations regarding the use of information into their DMP. This model has a 5×5×5 structure (5 dimensions divided into 5 attributes, each of them classified into 5 stages of maturity) intended to offer a high-resolution vision regarding the complexities inherent in the multiplicity of factors that combine at the technological and management level in making better-informed decisions. After a pilot campaign on three family-owned SMEs it was concluded that such resolution level might be more appropriate for medium- to large-sized companies, whose processes of information transformation and decision-making are distributed further across the different levels of the organization. Consequently, for assessing the DMP in SME’s it was still required a specifically optimized and straightforward maturity model (Parra, Tort-Martorell et al., 2017).
Therefore, a simplified derived version has been developed, the “Simplified Holistic Approach to DMP Evaluation (SHADE) of the CHROMA model” for the information-driven SME. The CHROMA-SHADE model seeks to provide a coherent and simpler assessment methodology adapted to the characteristics of SMEs, whose information transformation and decision-making processes are mainly concentrated in the senior level management of the organization.
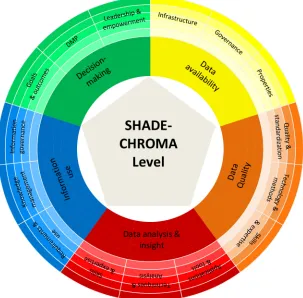
The CHROMA-SHADE model embraces the factors covered by the CHROMA model but with a reduced set of attributes, which were merged consistently to ensure that the assessment output and the reality were aligned, thereby facilitating their interpretation and understanding. SHADE is also an analogy to remind users that the new model is a projection of the original CHROMA model. Accordingly, the CHROMA-SHADE model is conceptually and graphically represented as a chromatic circle, as shown in Figure 1, in which an overall set of elements that influence the information-driven DMP are distributed in an orderly manner.
Likewise, the CHROMA-SHADE model poses that an appropriate use of data will lead to more objective and better-supported decisions. Therefore, business success can be gradually and systematically augmented by increasing an organization’s maturity in its information-driven DMP (Parra, Tort-Martorell et al., 2017).
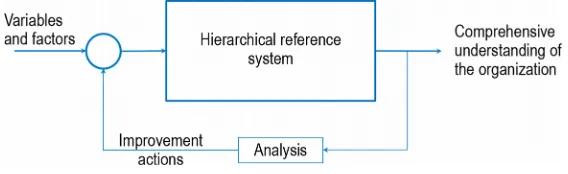
From a general perspective, the CHROMA-SHADE model uses as input the variables and factors that determine how decisions are driven based on the data, which in turn allows establishing a hierarchical reference framework to categorize the organization according to results of the evaluation of their information-driven DMP, providing as output an overall understanding of the organization that is useful for planning, re-directing and improving their performance (Figure 2). The CHROMA-SHADE model’s objective is to help SMEs by providing insights that translate into a company self-knowledge and the accompaniment to guides them in the journey to become information-driven companies.
In this context, the CHROMA-SHADE model is prescriptive since it provides a methodology for determining the current status of the organization, the requirements to reach each stage and a roadmap to evolve into a target maturity (Parra, Tort-Martorell et al., 2017). This model is described in the following sections.
Figure 2. The general process of CHROMA-SHADE model
3.1. Structure of the CHROMA-SHADE Model for the Information-Driven SME
The CHROMA-SHADE model is classified into five dimensions, which in turn are subdivided into three attributes representing together the concrete aspects by which maturity is measured in the context of the information-driven DMP in SMEs. The dimensions and attributes of this version of the model are the results of the findings achieved during the pilot studies carry out for the original version of the model (Parra, Tort-Martorell, et al., 2017) and were selected based on a review of state-of-the-art and successful managerial practices (Becker, Knackstedt & Pöppelbuß, 2009; Citroen, 2011; Davenport, 2006, 2009; Davenport et al., 2010; Florez & González, 2013; Frishammar, 2003; Jernigan et al., 2016; Kiron et al., 2015; LaValle et al., 2011; Pfeffer & Sutton, 2006; Ransbothan et al., 2016; Sawhney, Wolcott & Arroniz, 2006; Winig, 2016).
Under a broader approach, the five dimensions that make up both models are distributed following a logical sequence in terms of information-driven DMPs (Parra, Ruiz-Viñals & Álvarez-Gómez, 2017). The idea raises the notion that, for information-driven decision-making, it is first necessary to ensure that end users gain the appropriate access and availability of relevant data (data availability). It should also ensure that business processes and decisions are supported by good quality data (data quality). Next, this data must be processed to transform it into meaningful and relevant information (data analysis and insight), which will be used to support decisions and encourage organizational continuity (use of information), promoting the making of better-informed decisions under a planned and systematic process that contributes to improving their performance, innovation, and achieving a greater competitive advantage (decision-making). Each of the model’s dimensions and attributes are described as follows.
3.1.1. Data Availability
• Infrastructure: this attribute comprises and describes those elements related to the technologies, architecture, and integration existing in the organization to ensure adequate availability and access to data supporting business processes and decisions (ARMA, 2013; Economist Intelligence Unit, 2012; Halper & Stodder, 2014; Loshin, 2015).
• Governance: this describes aspects, processes, controls and practices of data governance to ensure a coherent strategy, with clear standards and responsibilities for efficient data asset management that enable the organization to be able to provide users with the required accessibility in a timely, flexible and expeditious manner (ARMA, 2013; Halper & Stodder, 2014; IBM, 2007; Probst, Monfardini, Frideres, Clarke, Demetri, Schnabel et al., 2013; Ransbothan et al., 2017).
• Properties: this attribute is related to those qualities, elements, particularities or formats in which the data is presented and range from its definition, characteristics and sources to the degree in which it is shared. Likewise, this attribute is also related to the access to and availability of metadata (data describing other data in order to standardize its content and structure for a more effective understanding of it) to determine the source of the data and make it traceable (Economist Intelligence Unit, 2012; Halper & Stodder, 2014; Probst et al., 2013).
3.1.2. Data Quality
Data quality constitutes a fundamental factor to be considered by organizations in order to support business processes and decisions based on correct, accurate, relevant and reliable data (Parra, Tort-Martorell, et al., 2017). Data quality problems are frequent in many organizations and their consequences go beyond leading to bad decisions, —they also generate a negative data-driven culture (Batini, Cappiello, Francalanci & Maurino, 2009; Halper & Stodder, 2014; Madnick, Wang, Lee & Zhu, 2009).
Ensuring data quality is a complex issue that requires a good combination of methodology, standards, people skills and technology (Lee, Pipino, Funk & Wang, 2006; Madnick et al., 2009; Shankaranarayan, Ziad & Wang, 2003). The attributes that influence data quality are:
• Quality & standardization: this attribute addresses how the organization discovers, addresses, and prevents data quality problems. This includes, therefore, the establishment of data taxonomies and standards for definition, coding and data exchange (Caballero, Verbo, Calero & Piattini, 2007; Halper & Stodder, 2014; Lee et al., 2006; Loshin, 2009; Oliveira, Rodrigues & Henriques, 2005; Shankaranarayan et al., 2003).
• Technology & methods: this describes the technological tools and resources of the organization and their degree of sophistication for an adequate quality management of data, specifying for this the structured and systematic set of techniques and protocols applied to ensure the quality of data of the organization (Batini et al., 2009; Lee, Strong, Kahn & Wang, 2002; Loshin, 2009).
• Skills & expertise: this attribute includes people’s knowledge, abilities and skills to ensure the quality of data, as well as the degree to which these capabilities are extended and consolidated throughout the organization (Halper & Stodder, 2014; Lee et al., 2006; Loshin, 2009; Oliveira et al., 2005; Shankaranarayan et al., 2003).
3.1.3. Data Analysis & Insight
Data analysis involves processing data to transform it into useful information and discovering the hidden value that lies in it, thus providing insights that support decision-making (Davenport, 2009; Davenport et al., 2010; Economist Intelligence Unit, 2012; Florez & González, 2013; Halper & Stodder, 2014; Hartmann et al., 2014; Jernigan et al., 2016; Kiron et al., 2015; LaValle et al., 2011; Probst et al., 2013; Ransbothan et al., 2016, 2017; Schoemaker & Tetlock, 2017). The associated attributes that are key to analyzing the data to provide a global view of the business processes of the organization include:
the data through its analysis (Davenport et al., 2015; Halper & Stodder, 2014; Hartmann et al., 2014; Kiron et al., 2015; Probst et al., 2013; Ransbothan et al., 2016, 2017; Schoemaker & Tetlock, 2017; Winig, 2016).
• Techniques & analysis: this describes the set of procedures, standards and protocols applied and their degree of sophistication in performing data analysis as well as the purpose and approach under which the different types of analysis are carried out to contribute to decision-making across the organization (Davenport et al., 2010, 2015; Halper & Stodder, 2014; Hartmann et al., 2014; Jernigan et al., 2016; Kiron et al., 2015; LaValle et al., 2011; Probst et al., 2013; Ransbothan et al., 2016, 2017).
• Skills & expertise: this attribute describes the knowledge, skills, and analytical capabilities that the organization's staff should have in order to take advantage of their data. It also includes training to develop and broaden these skills, as well as the degree to which these capacities are extended and consolidated through the organization, thereby promoting a data-driven culture (Halper & Stodder, 2014; Jernigan et al., 2016; Kiron et al., 2015; LaValle et al., 2011; Ransbothan et al., 2016, 2017; Schoemaker & Tetlock, 2017).
3.1.4. Information Use
The use of information in this context it refers to the way in which an organization’s information (processed data that has a meaning in terms of relevance, purpose, and context) and knowledge (set of experiences, values, information and know-how throughout the company) are used to support decision-making (Citroen, 2011; Florez & González, 2013; Frishammar, 2003; Kiron et al., 2015; LaValle et al., 2011; Pfeffer & Sutton, 2006; Ransbothan et al., 2016, 2017; Tort-Martorell, Grima & Marco, 2011). The attributes associated with this dimension are:
• Requirements & use: this attribute is associated with the degree to which the information requirements are defined, established and integrated with business processes in support of the organization’s objectives by providing relevant, updated and reliable information according to the needs of the users. It includes the ways and means through which the information is presented, offering a novel, agile, understandable and useful perspective as well as its effective use and exploitation to support the company’s strategy and decision-making, thereby promoting an information-driven culture (Citroen, 2011; Florez & González, 2013; Hartmann et al., 2014; Kiron et al., 2015; LaValle et al., 2011; Ransbothan et al., 2016).
• Knowledge management: this attribute covers the elements that are fundamental to identify, capture, develop, share and effectively utilize the organization’s knowledge, clearly defining roles and responsibilities, as well as standardizing strategies, processes, and approaches to its implementation, monitoring, and improvement (Birkinshaw & Sheehan, 2002; De Bruin, Freeze, Kaulkarni & Rosemann, 2005; Jochem, Geers & Heinze, 2011).
• Information governance: this describes the set of structures, policies, processes, and standards required to manage, integrate, enhance and leverage organization-wide information through clear guidelines and responsibilities under a transparent, shared-learning and research on best practice approach. It encompasses effective compliance with immediate and future requirements at the regulatory, legal, privacy, security, risk, operational and business levels across the organization in alignment with business goals (ARMA, 2013; IBM, 2007; Jernigan et al., 2016; Kiron et al., 2015; Probst et al., 2013; Ransbothan et al., 2016, 2017).
3.1.5. Decision-Making
• Goals & outcomes: This describes the extent to which the purpose, objectives, policies and strategies are established and continuously improved in terms of relevant data, both internal and external to the organization. It also considers defining and implementing standardized metrics across the organization for the measurement, monitoring, and evaluation of the degree of effectiveness of decisions, the fulfilment of objectives and to identify opportunities for improvement (ARMA, 2013; Davenport, 2009; Davenport et al., 2010; Halper & Stodder, 2014; Jernigan et al., 2016; Jochem et al., 2011; Kiron et al., 2015; LaValle et al., 2011; Ransbothan et al., 2016, 2017; Repenning et al., 2017).
• DMP: This attribute comprises the elements that must be present for the decision-making process to be carried out accurately, objectively and efficiently, thereby promoting the development of an information-driven culture and adequately managing the risks associated (Buchanan & O’Connell, 2006; Citroen, 2011; Davenport, 2009; Davenport et al., 2010; Economist Intelligence Unit, 2012; EY, 2014; Jernigan et al., 2016; Kiron et al., 2015; LaValle et al., 2011; Probst et al., 2013; Ransbothan et al., 2016, 2017; Repenning et al., 2017; Schoemaker & Krupp, 2015; Schoemaker & Tetlock, 2017).
• Leadership & empowerment: This describes the conditions of leadership, commitment and willingness to delegate authority functions with different degrees of power and autonomy that must exist in all levels of the organization to consolidate a data-driven decision-making culture throughout the company (Halper & Stodder, 2014; Kiron et al., 2015; Probst et al., 2013; Ransbothan et al., 2016).
3.2. Assessmentof the CHROMA-SHADE Model for the Information-Driven SME
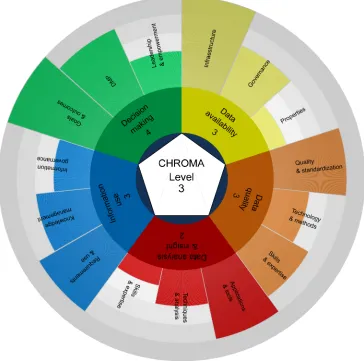
In order to properly categorize organizations, the CHROMA-SHADE model is deployed through five well-defined stages of maturity (Figure 3), which provide a good balance between resolution and a manageable number of levels (Parra, Tort-Martorell, et al., 2017). The requirements to reach each of these levels of maturity are widely specified and clearly described in the model’s framework, which is the basic reference guide during the evaluation of the organization. Unfortunately, such level of detail cannot be covered in this paper (further details are available upon request).
Figure 3. Stages of maturity of CHROMA-SHADE model
The evaluation of maturity in the CHROMA-SHADE model is conducted from bottom to top. That is, each attribute is evaluated according to the five stages of maturity. The evaluation of the three attributes of each dimension is then combined to provide the dimension’s degree of maturity. The overall evaluation is, in turn, obtained by combining the five dimensions. Such evaluation is carried out using a standardized assessment tool that is available upon request.
The CHROMA-SHADE uses a unified and harmonized assessment tool characterized by matching the interview questionnaire and the model’s attributed/dimensions and also allowed multiple, yet prioritized, answers from different profiles to every single question. Consequently, this facilitated and streamlined the evaluation process (Parra, Tort-Martorell, et al., 2017).
The head of IT (or equivalent) or, in his/her absence, a Project Coordinator, who provides key information regarding the data management technology used, the available databases and the way information is made accessible to users. Moreover, he/she should be the liaison and contact person between the organization and the assessor, providing an initial general perspective of the organization and its functioning. They should also help organize the assessment process. When the organization does not have this profile, a project coordinator should be assigned to carry out these liaison functions, and technical issues should be addressed to the CEO or a senior manager.
The CEO or a senior manager, who provides the perspective on how well the organization uses the information to make decisions. The interview also allows top management expectations to be aligned with the scope of the study and the output that will be delivered.
The application of the assessment tool of the CHROMA-SHADE model is divided into two phases. In phase I, a set of semi-structured face-to-face interviews comprising 60 predefined open-ended questions which are written down in the information gathering template are conducted. Moreover, the interviews are conducted with key personnel corresponding to each profile. Each interview has an approximate duration of one and a half hours and all of them were recorded in audio files. Also, the interview is structured into thematic blocks associated with the dimensions and attributes of the model. Next, the phase II evaluation process is made on the basis of the information collected in phase I, which is in turn checked against the framework of the corresponding model for the different attributes and scored according to a specific set of evaluation criteria ranging from 0 (worst) to 100 (best). These scores are averaged and scaled to a value between 1 to 5.
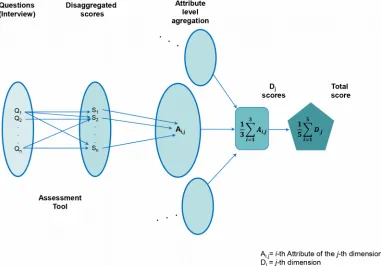
As already indicated, the scoring carried out in phase II of the assessment tool is closely linked to the dimensions and attributes of the model. In this regard, as shown in Figure 4, the interview questions are used to score the disaggregated aspects assessed. The disaggregated scores are then combined to obtain a scaled attribute score. Next, those attribute scores are averaged to obtain the dimension score and in turn the overall score is obtained as the mean value of the dimension scores. In a similar way to its predecessor, the importance (weight) a given question has in the overall assessment of maturity depends on the number of attributes over which it has influence. Therefore, independently of the number of questions that are related to each attribute, they have the same weight in the dimension’s score. Likewise, each dimension has the same weight in the overall CHROMA score.
In this regard, the results of the application of the CHROMA-SHADE model can be presented at different levels of detail, simultaneously providing an index of maturity for the attributes and dimensions, as well as a total index, which is a source of valuable information to detect areas or elements requiring improvement actions. These results are graphically represented in order to facilitate a global analysis of the situation in the information-driven DMP context.
Figure 5 shows an example of how the CHROMA model structure is used to simultaneously display the results of the evaluation of the maturity stages: The attributes score is represented by the length of bars arranged in a circle, the dimensions are represented by a pie chart, and the global score appears inside the central pentagon.
Figure 5. An example of the graphical representation of the application of the CHROMA-SHADE model
Additionally, a brief web questionnaire of six questions was sent only to decision makers (heads of processes or departments) to obtain their perception as to how information is used to drive decisions and company strategy. This survey was intended as a parallel validation mechanism to compare with the results of the evaluation. Therefore, the results of the surveys are not combined with those of the interviews, they remain independent of each other.
In summary, Table 1 presents a comparison between the former CHROMA model and the proposed CHROMA-SHADE model and their assessment process. This comparison is made upon five characteristics of both models and process, namely, Structure & Framework, Interviews & Questionnaire, Scoring, Complementary evaluation and, finally, Reporting & Feedback. Thanks to this analysis it becomes clear why the CHROMA model was modified for adapting it better to SMEs.
Figure 6. The CHROMA-SHADE model assessment process
Characteristics CHROMA CHROMA-SHADE Reasons
Structure & Framework
5 dimensions subdivided into 5 attributes each and classified into 5 levels of maturity.
The same 5 dimensions, now subdivided into 3 attributes each and classified into 5 levels of maturity.
By merging attributed and simplifying their descriptions the CHROMA-SHADE model was able to deliver more
comprehensible results for the SME under assessment. A reduction of 40% of the total number of attributes also streamlined the assessment and reporting process.
Interviews & Questionnaire
Four different questionnaire templates depending on the profile of the interviewee: project coordinator, head of IT, the CEO or a senior manager, and the head of the department. Each questionnaire templates comprising between 24 and 46 predefined open-ended questions
A single questionnaire templates having 60 open ended questions.
Each question was associated with a preferred or prioritized profile to provide an answer. The profile that responded each question was also registered.
To eliminate redundant questions. To make the interview process more agile and less time-consuming.
We realized that in SME’s a single person could be in charge of responsibilities corresponding to several profiles. Moreover, it is possible an SME did not have the exact required profile in-company. For instance, the head of IT. Therefore, a more flexible questionnaire template was required.
Scoring
There is a surjective relationship between the open-ended questionnaires questions (phase I) and the close-ended items defined in the scoring spreadsheet (phase II).
There is a univocal relationship between the open-ended questionnaire questions (phase I) and the close-ended items defined in the scoring spreadsheet (phase II).
Characteristics CHROMA CHROMA-SHADE Reasons
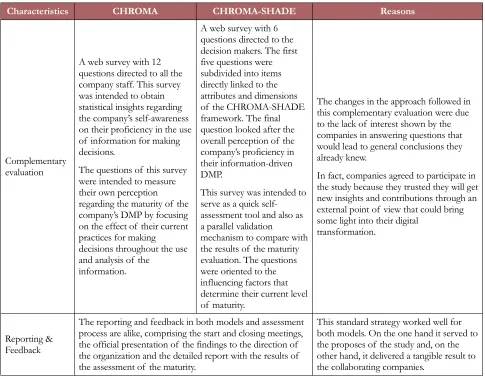
Complementary evaluation
A web survey with 12 questions directed to all the company staff. This survey was intended to obtain statistical insights regarding the company’s self-awareness on their proficiency in the use of information for making decisions.
The questions of this survey were intended to measure their own perception regarding the maturity of the company’s DMP by focusing on the effect of their current practices for making decisions throughout the use and analysis of the
information.
A web survey with 6 questions directed to the decision makers. The first five questions were subdivided into items directly linked to the attributes and dimensions of the CHROMA-SHADE framework. The final question looked after the overall perception of the company’s proficiency in their information-driven DMP.
This survey was intended to serve as a quick self-assessment tool and also as a parallel validation mechanism to compare with the results of the maturity evaluation. The questions were oriented to the influencing factors that determine their current level of maturity.
The changes in the approach followed in this complementary evaluation were due to the lack of interest shown by the companies in answering questions that would lead to general conclusions they already knew.
In fact, companies agreed to participate in the study because they trusted they will get new insights and contributions through an external point of view that could bring some light into their digital
transformation.
Reporting & Feedback
The reporting and feedback in both models and assessment process are alike, comprising the start and closing meetings, the official presentation of the findings to the direction of the organization and the detailed report with the results of the assessment of the maturity.
This standard strategy worked well for both models. On the one hand it served to the proposes of the study and, on the other hand, it delivered a tangible result to the collaborating companies.
Table 1. Comparison between the CHROMA and CHROMA-SHADE models and their maturity assessment processes
4. Putting the CHROMA-SHADE Model to Work in SMEs
The CHROMA-SHADE model was tested throughout the case study methodology. For that purpose, a set of SME had to be selected to participate as collaborating companies. To ensure the homogeneity necessary for later comparisons with the prior findings, it was decided to continue focusing on family-owned SMEs. In this regard, with the support of the “Associació Catalana de l’Empresa Familiar” (ASCEF) and the “Instituto de la Empresa Familiar” (Spanish Family Business Institute) 19 Catalan SMEs were preselected. All those companies had the typical characteristics of a family business: shared ownership, control, governance and voting rights. Due to time and budget constraints, it was decided to perform the maturity assessment on three SMEs. Moreover, this number of cases of study was consistent with the previous pilot test of the CHROMA model.
Following the criterion above, three medium-sized companies having at least 25 employees and that agreed to collaborate within the time schedule of the project were finally selected. The abovementioned SMEs were labeled as Companies 4, 5 and 6. Such companies are different from the ones assessed in the original CHROMA pilot test, tagged as Companies 1, 2 and 3 (Parra, Tort-Martorell, et al., 2017). In brief, Table 2 gathers the characteristics features of the CHROMA and CHROMA–SHADE field study campaigns for each of the collaborating companies.
them was randomly selected for coarse valuation the robustness of the assessment process regarding the proficiency of the evaluator.
The results obtained through this study are presented in the following subsections.
Feature
Company codename
CHROMA model CHROMA-SHADE model
1 2 3 4 5 6
Number of
Employees 72 61 100 70 28 37
Sector Real Estate Manufacturing Manufacturing Transport AdvertisingMedia & Real Estate
Assessment
date May, 2016 May, 2016 Jul, 2016 March, 17 May, 2017 July, 2017
Location Province ofBarcelona Province ofBarcelona Province ofGirona Province ofBarcelona Province ofBarcelona Province ofBarcelona
Participating profiles CEO Project Coordinator (Head of quality) Head of the Patrimonial and Commercial Departments CEO (Export & Marketing Manager) Project Coordinator (Head of the Financial Area) Heads of Factory and Warehouse CEO (General Manager) Project Coordinator (Intelligence Manager) Production & Operations Manager Co-CEO / Senior manager (Logistics and Operations Manager) Co-CEO/Senior manager (Administrative and Financial Manager) CEO (Deputy Director) CEO/Senior Manager and owner (4th generation). Project Coordinator (Vertical Property
Manager and IT Requirements
Coordinator) Table 2. Characteristic features of the CHROMA and CHROMA-SHADE field study campaigns per collaborating company
4.1. Comparative analysis
The overall level of maturity and the disaggregated dimension scores were compared among these companies. Comparisons at the attribute score level were not possible due to the difference in the number of attributes defined for both maturity models. Figure 7 shows the results per dimension that were reached by each company.
Figure 7 reveals several interesting insights. First, it is noteworthy that none of the companies reached a maturity level of 5 in any of the dimensions. This suggests that these organizations still have a long way to go to become information-driven companies. Secondly, it can be observed that the more mature companies maintain a balanced valuation in all their dimensions. This makes a lot of sense, and to corroborate this observation, the correlation coefficient between the maturity indexes of every pair of dimensions was calculated, obtaining a strong correlation in all cases [0.73; 0.95].
Additionally, by analyzing the average maturity score by dimension obtained in each of the companies evaluated (Figure 8), the “data quality” dimension was found to obtain a lower score. It is therefore clear that data quality problems are still the most challenging unresolved issue in these companies. Conversely, the “decision-making” dimension turned out to have the highest score. This suggests that these companies have been able to take advantage of their available information resources to support decision-making; in other words, to a greater or lesser extent they have made good use of the data available.
offer them a deeper insight into their organization and the way forward to ensure their consistent and sustained growth.
Figure 7: Results per dimension reached by the companies evaluated
Finally, although it was not the intention to reach general conclusions about the aspects considered in the model, a qualitative analysis based only on the 6 companies analyzed and therefore without any statistical value, provides some points that we believe are worth noting:
• The use of data to support the DMP in an organization is directly related to the level of professionalization of the senior management and their familiarity with the use of technological tools. In this regard, they will promote it through a trickle-down effect on the rest of the organization.
• Data analysis is mostly used at the senior and middle management level. At the operational level, data analysis is very scarce.
• Skills in data analysis are rather limited, being restricted to track indicators, dashboards and tailored spreadsheets.
• Managers are aware of the analytics and big data revolution but do not feel an urgent need to adopt them.
• Risk management is a little considered and neglected issue in SMEs.
• All the companies were able to recognize their limitations but also took advantage of their available information resources. This means they have achieved a deep knowledge of their industry/sector/market and have used it to deliver high-quality products/services with a strong national and/or international presence. Likewise, all of the companies were characterized by built solid relationships with partners and suppliers.
4.2. Lessons Learned
Beyond the actual quantitative and qualitative outcomes from the study carried out in the pilot and in the validation campaigns, many valuable lessons were learned from the close interaction with the SMEs. A summary of them is given as follows.
4.2.1. Interviews versus Surveys
The interviews were fundamental and of great value in carrying out this study effectively. They were a means of establishing a closer relationship with the decision-makers and obtaining first-hand information about their needs and concerns.
Conversely, the short web questionnaire did not yield the expected results, as the number of responses was extremely low. As a direct consequence, it was evident that the applicability of such survey-based assessment methodologies is rather unfeasible and unreliable given the disinterest of the organizations’ representatives in answering it, in spite of the valuable information that this complementary tool would be able to collect.
Indeed, this observation made it necessary to rethink what organizations and those who run them are really looking for. In the first place, the interviews worked more effectively than the web questionnaires, which may indicate that decision-makers feel more confident and willing to participate when it comes to a face-to-face interaction. During interviews, decision-makers can raise their concerns by showing an open interest in receiving more feedback to keep improving. Therefore, it could be argued that decision-makers are looking for a more personalized treatment instead of standard predefined approaches.
4.2.2. Time-Investment in the Evaluation Process
Figure 9. Total time invested in the evaluation process
In this respect, the mean time invested in the evaluation of the first three SMEs was 5.33 hours, while the average time invested in the evaluation of the companies that formed the last three SMEs was 3 hours. Although the original version of the evaluation tool caused only minor disruptions to business processes, the later version reduced even more the invested time. This improvement was due to the unification of the different interviewee questionnaires.
Likewise, it was also possible to reduce the time needed to perform the evaluation, analysis, and interpretation of the results to provide companies with a report that offered them useful feedback with added value. In both cases, the information gathered through the interview questions (Phase I) was sufficient to address the questions and complete the templates of the scoring phase (Phase II).
4.2.3. The Robustness of the Assessment Tool
Ideally, the assessment tool is intended to provide coherent outcomes independently of the evaluator. In order to verify the robustness of the evaluation with the assessment tool, one of the trainees that accompanied the expert evaluator during the interviews carried out with Company 5 was selected to perform an independent evaluation. Both evaluators then scored phase II of the assessment. In this regard, the results were compared at the level of questions, attributes and from a general approach, that is, the disaggregated and aggregated scores. The findings of the analysis performed in this experiment are detailed below.
Figure 10 shows the differences registered between the expert evaluator and the trainee during the evaluation process. In this regard, several levels of coincidence were identified. In the first place, for 27 of the 66 questions (41%) of the assessment tool questionnaire, a perfect match was obtained, while 32 questions (48%) presented one level of deviation in the assessment, i.e. a difference, both higher and lower, in the response of a level of the value given by each evaluator. For 6 of the questions (9%), a difference of 2 levels of mismatch was observed and in only 1 question (2%), the difference corresponded to three levels of mismatch. There were no cases of total mismatch between the assessments made by each evaluator.
Figure 11 shows the bivariate distribution of the disaggregated scores of the evaluator. Within the scoring range of 0 to 100 employed per each interview question, a perfect match between evaluators when grading at 0, 25, 50 and 75 was 6%, 14%, 20% and 1%, respectively. 23% of the time, when the expert gave a question a score of 25, the trainee evaluator gave them a score of 50. In 9% of the cases, when the expert evaluator scored the questions at 0, the trainee scored them at 25 and so on.
The predominance of level 1 mismatches (48%) is noticeable in relation to the perfect match (41%), which exerts a strong influence on the overall results. These findings, analyzed together with those shown in Figure 11 and subsequently in Figure 12, suggest a more conservative tendency on the part of the trainee, probably motivated to a certain degree by the fear of being wrong, since the trainee´s different assessments were generally narrowly ranged between the middle scores compared with the expert evaluator, whose scores were distributed within a slightly wider range.
On the contrary, the results related to level 2 and 3 mismatches (Figure 10) are attributable mainly to the differences in the levels of knowledge and experience between the trainee and expert. Despite this, from a general perspective the overall maturity results reached by both evaluators were the same (maturity level 2 “Awareness”) with slight differences in terms of decimals that did not affect the final result.
This result revealed the need to extend these robustness experiments in order to validate this assumption and to obtain conclusive outcomes.
Figure 11. Bivariate distribution of the disaggregated scores of the evaluator. Case study: Company 5
4.2.4. Contributions to the Growth and Success of the Companies
Much has already been said about the importance of SMEs to the economy and the advantage of boosting their development. The growth SMEs can achieve depends on them being able to embrace more rigorously the use of their data and analytics insights in order to boost their business through better and more supported decisions. This implies a process of self-recognition to identify where they should focus all their efforts in order to adopt better analytical practices that lead them to evolve and become information-driven companies. This could be achieved through the application of the CHROMA-SHADE model.
Therefore, the assessment tool proved to be useful for collecting useful and relevant information in order to establish the situation of the organizations with respect to how they use the information to support decision-making, thereby allowing them to be evaluated with a better supported an objective criterion.
Accordingly, the model allows the organizations to be categorized while it also provides a wider picture of the improvement opportunities to help them evolve to higher maturity levels, thereby offering trustworthy accompaniment during their journey.
This was corroborated and validated through the feedback received from the companies evaluated. In this sense, the companies stated that their organization was reflected in the results reported and that they felt the results they were consistent and adjusted to their reality. Therefore, the results of the model and the feedback provided were positively valued.
Likewise, the organizations were quite receptive to the study, mainly at the level of senior and middle management, largely because the information-driven DMP is a matter that concerns them. This underscores the great interest of decision-makers in gaining a greater understanding of how to better leverage their data and to broaden their perspectives in terms of adopting better analytical practices to make better decisions.
Managers found the interviews interesting and “opened their eyes” to areas of DMP they had not considered before. This revealed a need in organizations to have mechanisms to obtain an overview of their organization and the self-knowledge necessary to plan, redirect and improve their performance. In this respect, the structure under which the CHROMA models are designed makes it possible to provide the results at several levels of detail, facilitating the organization the implementation of actions in a prioritized way.
In this vein, many of the improvements areas identified, which were necessarily quite generic, came as no surprise to the companies’ management. They were, however, happy to see them ordered and interrelated from the perspective of DMPs.
Another positive aspect was that the structure of the interviews allowed us to provide the companies in advance with enough information to determine the organization’s status, thereby making it possible for managers to raise awareness and recognize those aspects that needed to be better addressed. Managers were happy with the feedback and evaluated the process as a worthwhile experience.
Therefore, it was confirmed that these models are necessary and valuable for the growth and success of the companies in which they are applied, by providing the route towards excellence in decision-making through information.
5. Conclusions
Over the last decades, it has been evident that companies have sought to improve their performance and competitiveness by using data to make better decisions. Nonetheless, organizations frequently fail, or not fully succeed, in the difficult task of aligning their data-driven technologies solutions with the adoption of good information-driven practices, and thus do not fully benefit from the advantages of better decision-making processes.
that, at the technological and management level, converge to enable more objective and better-supported decisions to be made through the intelligent use of information. This is the main difference between the maturity models proposed by their predecessors, which are more focused on the implementation of specific technologies, areas or policies such as business intelligence, business analytics, big data, information governance, knowledge management, etc.
In this sense, the CHROMA-SHADE model with its 5×3×5 structure (5 dimensions subdivided into 3 attributes, each classifiable into 5 levels of aptitude) evolved as a more efficient version of its predecessor due to the need to adapt it to the particularities of SMEs. This model takes into account the basic conceptual and application principles that characterize to the original version but with a reduced number of attributes, which were unified and summarized consistently to provide better adjusted and understandable results according to the organizations’ typology upon which it is focused.
With regard to the assessment tool, this also underwent transformations. In the first instance, certain problems were detected in the language used, redundancy in some questions due to the number of profiles, greater complexity to cross the scoring in phase I and phase II, the time invested in the entire evaluation process, etc. This led to the restructuring of the assessment tool, which in its final version consists of a single simplified, unified questionnaire sufficiently robust to be applied indistinctly to both models, capable of adapting to the particularities and functional structure of each organization. Accordingly, this improved version of the assessment tool includes more focused and better-formulated questions for a more accurate collection of relevant information, allowing a closer, direct link with the models’ dimensions and attributes. All this enabled the evaluation process to be streamlined and optimized by offering as output the objective and adjusted results.
With regard to the methodology, two complementary strategies for collecting information were proposed, interviews and web-surveys. To that end, the most effective strategy was to conduct semi-structured interviews with key personnel of the company, which represented a means to engage more closely with decision-makers. This enabled a more accurate collection of relevant, first-hand information about their concerns. Therefore, it was important to carry out the study and offer better feedback oriented at the improvement of specific aspects that would consequently affect the performance and growth of the organization. However, the strategy related to conducting surveys did not yield the expected results. In part, because this was considered a waste of time for the decision-makers but also because it is not perceived as a mechanism that offers them a close treatment or that makes a customized contribution that leads them to solve their particular problems.
In relation to the field study campaigns deployed, they were very significant in reaching a deeper understanding of the degree to which organizations are supporting their decisions vis-à-vis the information obtained from data analysis and their willingness to improve accordingly. In general terms, none of the companies managed to reach the highest level of maturity, which highlights that much remains to be done and the relevance of the model to help them continue to evolve. Likewise, addressing and strengthening one of the dimensions will have repercussions on the others, allowing them to be balanced. However, the findings reveal that data quality issues are the single biggest challenge facing organizations. Similarly, it can be seen that in general the data continues to be poorly analyzed, reactive and not very audacious, mainly concentrated in the upper management and middle managers and very scarce at operational levels. Despite this, the decision-making dimension achieved the highest average maturity score, which highlights that these organizations have, to some extent, been able to take advantage of their available data to support their decisions.
Declaration of Conflicting Interests
The authors declared no potential conflicts of interest with respect to the research, authorship, and/or publication of this article.
Funding
This work has been carried out with the help funds for research groups from Universitat Abat Oliba CEU - Obra Social “la Caixa” (2016).
References
Accenture, & General Electric (2014). Industrial Internet Insights Report for 2015.
ARMA (2013). Generally Accepted Recordkeeping principles® Information Governance Maturity Model (1-8). ARMA International. Available at: https://www.arma.org/store/ViewProduct.aspx?id=10482978
Batini, C., Cappiello, C., Francalanci, C., & Maurino, A. (2009). Methodologies for Data Quality Assessment and Improvement. ACM Computing Surveys , 41(3), 16, 1-16:52. https://doi.org/10.1145/1541880.1541883
Becker, J., Knackstedt, R., & Pöppelbuß, J. (2009). Developing Maturity Models for IT Management. Business & Information Systems Engineering, 1(3), 213-222. https://doi.org/10.1007/s12599-009-0044-5
Birkinshaw, J., & Sheehan, T. (2002). Managing the Knowledge Life Cycle. MIT Sloan Management Review, 44(1), 75-83. https://doi.org/10.1109/EMR.2003.24901
Buchanan, L., & O’Connell, A. (2006). A Brief History of Decision Making. Harvard Business Review. Available at:
https://hbr.org/2006/01/a-brief-history-of-decision-making
Caballero, I., Verbo, E., Calero, C., & Piattini, M. (2007). A Data Quality Measurement Information Model Based ISO/IEC 15939. In The 12th International Conference on Information Quality (ICIQ-2007) (393-408). Cambridge, MA, USA: Massachusetts Institute of Technology (MIT). Available at:
https://www.researchgate.net/publication/220918850_A_data_quality_measurement_information_model_based_on_ISOIEC_ 15939
Citroen, C.L. (2009). Strategic Desicion-Making Processes: The Role of Information. University of Twente.
Citroen, C.L. (2011). The Role of Information in Strategic Decision-Making. International Journal of Information Management, 31(6), 493-501. https://doi.org/10.1016/j.ijinfomgt.2011.02.005
Cöster, M., & Petri, C.J. (2014). Influence of insight and maneuver inertia on information technology investments and strategic change. International Journal of Management and Decision Making, 13(3), 250-265.
https://doi.org/10.1504/IJMDM.2014.063570
Daugherty, P., Banerjee, P., Negm, W., & Alter, A.E. (2015). Driving Unconventional Growth through the Industrial Internet of Things. Accenture Technology.
Davenport, T.H. (2006). Competing on Analytics. Harvard Business Review, 84(1), 98-107. Davenport, T.H. (2009). Make Better Decisions. Harvard Business Review, 87(11), 117-123.
Davenport, T.H., Barth, P., & Bean, R. (2015). How “Big Data” is Different. MIT Sloan Management Review, Special Collection “Winning With Data”, 7-9.
Davenport, T.H., Harris, J.G., & Morison, R. (2010). Analytics at Work: Smarter Decisions, Better Results. Harvard Business School Press Books. Boston, MA, USA: Harvard Business School Press.
De Bruin, T., Freeze, R., Kaulkarni, U., & Rosemann, M. (2005). Understanding the Main Phases of Developing a Maturity Assessment Model. Australasian Conference on Information Systems (ACIS) (8-19).
e-skills UK (2013). Big data analytics: adoption and employment trends, 2012-2017. United Kingdom. Available at:
Economist Intelligence Unit (2012). The Deciding Factor: Big Data & Decision Making. The Economist. Ecorys Netherlands (2012). EU SMEs in 2012: at the crossroads. Rotterdam, The Netherlands. EY (2014). Big data. Changing the way businesses compete and operate.
Florez, J.L., & González D.I. (2013). Del Big Data Analytics al Beneficio. Spain.
Frishammar, J. (2003). Information Use in Strategic Decision Making. Management Decision, 41(4), 318-326.
https://doi.org/10.1108/00251740310468090
Halper, F., & Stodder, D. (2014). TDWI Analytics Maturity Model Guide. TDWI Research, 1-20. Available at:
https://tdwi.org/whitepapers/2014/10/tdwi-analytics-maturity-model-guide/asset.aspx?tc=assetpg
Hartmann, P.M., Zaki, M., & Feldmann, N. (2014). Big Data for Big Business ? A Taxonomy of Data-driven Business Models used by Start-up Firms, March. Cambridge Service Alliance. Cambridge, UK. Available at:
https://cambridgeservicealliance.eng.cam.ac.uk/resources/Downloads/Monthly %20Papers/2014_March_DataDrivenBusinessModels.pdf
Henke, N., Bughin, J., Chui, M., Manyika, J., Saleh, T., Wiseman, B. et al. (2016). The age of analytics: Competing in a data-driven world. McKinsey Global Institute.
IBM (2007). The IBM Data Governance Council Maturity Model: Building a roadmap for effective data governance. NY, USA. Available at: https://www-935.ibm.com/services/uk/cio/pdf/leverage_wp_data_gov_council_maturity_model.pdf
Jernigan, S., Ransbotham, S., & Kiron, D. (2016). Data Sharing and Analytics Drive Success With IoT. MIT Sloan Management Review, September-Fall, 1-18.
Jochem, R., Geers, D., & Heinze, P. (2011). Maturity Measurement of Knowledge-Intensive Business Processes. The TQM Journal, 23(4), 377-387. https://doi.org/10.1108/17542731111139464
Kiron, D., Prentice, P.K., & Ferguson, R.B. (2015). Innovating With Analytics. MIT Sloan Management Review. Special Collection Spring. Available at: http://sloanreview.mit.edu/article/innovating-with-analytics/
LaValle, S., Lesser, E., Shockley, R., Hopkins, M.S., & Kruschwitz, N. (2011). Big Data, Analytics and the Path From Insights to Value. MIT Sloan Management Review, 52(52205), 21-32.
Lee, Y.W., Pipino, L.L., Funk, J.D., & Wang, R.Y. (2006). Journey to Data Quality. Cambridge, MA, USA: Massachusetts Institute of Technology. Available at: http://mitiq.mit.edu/books.aspx
Lee, Y.W., Strong, D.M., Kahn, B.K., & Wang, R.Y. (2002). AIMQ: A Methodology for Information Quality Assessment. Information and Management, 40(2), 133-146. https://doi.org/10.1016/S0378-7206(02)00043-5
Lim, E.P., Chen, H., & Chen, G. (2013). Business Intelligence and Analytics: Research Directions. ACM Transactions on Management Information Systems, 3(4), 17:1-17:10. https://doi.org/10.1145/2407740.2407741
Loshin, D. (2009). Five Fundamental Data Quality Practices. White paper: Data quality & Data integration. Loshin, D. (2015). Evolving Big Data into a Mature Platform. TDWI Research. Available at:
https://tdwi.org/research/2015/01/checklist-evolving-big-data-into-a-mature-platform/asset.aspx
Madnick, S.E., Wang, R.Y., Lee, Y.W., & Zhu, H. (2009). Overview and Framework for Data and Information Quality Research. ACM Journal of Data and Information Quality, 1(1), 2:1-2:22.
Manyika, J., Chui, M., Brown, B., Bughin, J., Dobbs, R., Roxburgh, C. et al. (2011). Big data: The next frontier for innovation, competition, and productivity. McKinsey Global Institute.
Muller, P., Devnani, S., Julius, J., Gagliardi, D., & Marzocchi, C. (2014). SME recovery continues. Annual report on european SMEs.
Muller, P., Julius, J., Herr, D., Koch, L., Peycheva, V., & McKiernan, S. (2017). Focus on self-employment. Annual report on european SMEs 2016/2017.
Oliveira, P., Rodrigues, F., & Henriques, P. (2005). A Formal Definition of Data Quality Problems. In Proceedings of the Tenth International Conference on Information Quality (ICIQ-05) (13-26). Cambridge, MA, USA: Massachusetts Institute of Technology (MIT).
Parra, X., Ruiz Viñals, C., & Álvarez-Gómez, F. (2017). Análisis de la Toma de Decisiones Basada en Información en Empresas Familiares: Conclusiones sobre la Aplicación del Modelo CHROMA. In XXXI Congreso Anual AEDEM. Empresa y Sociedad: Investigación e Innovación Responsable (1463-1476). Madrid, España: European Academic Publisher.
Parra, X., Tort-Martorell, X., Ruiz-Viñals, C., & Álvarez-Gómez, F. (2017). CHROMA: A Maturity Model for the Information-Driven Decision-Making Process. International Journal of Management and Decision Making, 16(3), 224-242. https://doi.org/10.1504/IJMDM.2017.085633
Pfeffer, J., & Sutton, R.I. (2006). Evidence-Based Management. Harvard Business Review, 84(1), 1-13.
Probst, L., Monfardini, E., Frideres, L., Clarke, S., Demetri, D., Schnabel, L. et al. (2013). Analytics & Decision Making.
Ransbothan, S., Kiron, D., & Prentice, P.K. (2016). Beyond the Hype: The Hard Work Behind Analytics Success.
MIT Sloan Management Review, Spring, 1-18.
Ransbothan, S., Kiron, D., & Prentice, P.K. (2017). Analytics as a Source of Business Innovation. MIT Sloan Management Review, February, 1-19.
Repenning, N.P., Kieffer, D., & Astor, T. (2017). The Most Underrated Skill in Management. MIT Sloan Management Review, Special Collection “How to make your Company Smarter”, 12-21.
Rosenzweig, P. (2014). The Benefits–and Limits–of Decision Models. McKinsey Quarterly, February, 1-10. Available at: http://www.mckinsey.com/insights/strategy/the_benefits_and_limits_of_decision_models
Sawhney, M., Wolcott, R.C., & Arroniz, I. (2006). The 12 Different Ways for Companies to Innovate. MIT Sloan Management Review, 47(3), 1-18. https://doi.org/10.1109/EMR.2007.329139
Schoemaker, P.J.H., & Krupp, S. (2015). The Power of Asking Pivotal Questions. MIT Sloan Management Review, Special Collection “Making Better Decisions”, 1-9.
Schoemaker, P.J.H., & Tetlock, P.E. (2017). Building a More Intelligent Enterprise. MIT Sloan Management Review, Special Collection “How to make your Company Smarter”, 2-11.
Shankaranarayan, G., Ziad, M., & Wang, R.Y. (2003). Managing Data Quality in Dynamic Decision Environments: An Information Product Approach. Journal of Database Management, 14(4), 14-32.
https://doi.org/10.4018/jdm.2003100102
TechNavio (2014). Global SME Big Data Market 2014-2018. TechNavio - Infiniti Research Ltd.
Tort-Martorell, X., Grima, P., & Marco, L. (2011). Management by Facts: The Common Ground Between Total Quality Management and Evidence-Based Management. Total Quality Management & Business Excellence, 22(6), 599-618. https://doi.org/10.1080/14783363.2011.568262
Winig, L. (2016). GE’s Big Bet on Data and Analytics. MIT Sloan Management Review, February, 1-16.
Journal of Industrial Engineering and Management, 2019 (www.jiem.org)
Article’s contents are provided on an Attribution-Non Commercial 4.0 Creative commons International License. Readers are allowed to copy, distribute and communicate article’s contents, provided the author’s and Journal of Industrial Engineering and