Issues
ISSN: 2146-4138
available at http: www.econjournals.com
International Journal of Economics and Financial Issues, 2017, 7(2), 377-383.
Analyzing the Effects of Fiscal Policy on Income Distribution:
A Comparison between Developed and Developing Countries
Hale Balseven
1*, Can Tansel Tugcu
21Akdeniz University, Turkey, 2Akdeniz University, Turkey. *Email: [email protected]
ABSTRACT
The study examines the effect of fiscal policy on income distribution in developed and developing countries. The study analyzes the explanatory power of tax and transfers on income inequality in 17 developing and 30 developed countries in between 1990 and 2014 by using linear panel data estimation techniques. According to the findings, tax revenues decrease income inequalities in developing countries while social benefits decrease income inequality in developed countries. Also, the economic growth has negative impact on income distribution in developing countries whereas the economic growth and inflation have positive impact on income distribution in developed countries.
Keywords: Fiscal Policy, Income Distribution, Tax and Expenditure Policy
JEL Classifications: D63, D31, H20
1. INTRODUCTION
Nowadays equalities in income distribution have become an important research topic of modern macroeconomics. Even
in countries taking place within the group of developed
ones where welfare state applications are common, some deterioration has been experienced in distribution indicators.
Studies analyzing OECD countries determine that while the Gini coefficient was 0.29 in the mid-1980’s, it has increased to 0.32 in 2011/12 (OECD, 2012). Apart from a few exceptions in developing countries, income distribution inequalities– which are already higher than developed countries- continue
to increase.
The deterioration in income distribution might arise from the distribution of income in factor markets and/or from the re-distribution of income with the fiscal policy. Especially the fact that states have lost their elasticity in using the fiscal policy during the globalization process is argued to decrease the
re-distribution power of the state as an actor which decreases the income inequalities of the market. The deterioration effect of
other factors on income distribution such as growth, inflation
and unemployment, has become an important discussion topic
especially following the global recession.
On the other hand, the reasons exclusive to developing countries
in terms of the inequalities in income distribution shall also not be
disregarded. The main characteristics differentiating developing countries from developed ones with regards to inequalities in
income distribution are the narrow tax base of these countries,
the low level of unregistered employment as well as the low level
of social transfer.
In this study, the effects of fiscal policy on income distribution are explained through a comparison made between developed and developing country groups. It is seen that studies conducted
in this subject focus mostly on developed countries. The fact that
a limited number of studies have been conducted in developing countries unlike the group of developed countries might be
explained with the lack of data. The purpose of this study is to
determine similar factors explaining income inequality in both country groups and to distinguish the different ones according to their significance level. In this framework, the study has contributed to the studies as comparing the distributional effects of taxes and expenditures in developed and developing countries.
government policies through changes made in relative prices and in household behaviors have been disregarded.
The second and third section of the study reveal the theoretical and empirical literature. In the fourth section, the model and data have been analyzed. In the last section, the evaluation and conclusions of the study take place.
2. THE THEORETICAL LITERATURE
According to Kuznets (1955), the two important factors affecting the gross income distribution are savings and economic growth. As to him, while income inequalities increase during the first phases of economic growth, income distribution tends to get even fairer as economic growth continues and the country gets further developed. The increase of the Gini coefficient in developing countries is explained in this context. In addition to a wide literature concerning
the validity of the relationality named inverted-U, counter studies
also exist. Bourguignon and Morrison (1990) point out that the
importance of income factors decrease when variables such as the
education level are incorporated. More important are the increases
in the inequality levels of many developed countries such as the
USA and England, experienced in the recent period.
Nowadays, the role of regional economic development- based on trade, technological change and interregional wage differentials-on income distribution inequalities is being analyzed. Especially in developed countries, the role of wage differentials in explaining
income distribution inequality is appreciated to be important.
Atkinson (1997) points out that in England, there are clear findings on the differences related to the distribution of wages. While real earnings increased by 11% in the lowest income bracket between the years 1979-1995 in England, they increased by 50% in the highest income bracket. In addition to the increased differential experienced between the earnings of the employed population in this country, the increasing importance of self-employment as well as the increasing number of households having no employment income take place among factors affecting the deterioration in income distribution. With regards to those who are not employed, social security is the main source of income. At this stage, the
distributional effect of the state comes into play, expressed as the difference between the market income and the income after taxes
and transfers. Until the first half of the 1980s, the Gini coefficient of the market income increased sharply while coefficients of
incomes obtained after taxes and transfers had a milder increase.
After 1984, an exact opposite situation has been experienced. According to Atkinson (1997), the striking decrease occurring
in the re-distribution effect of transfers and direct taxes after this
date, is the result of political changes that have contributed to
income inequality.
Indeed, the role played by the state in re-distributing the income and contributing to development during the 1950s and 1960s has undergone a radical change starting from the 1970s. Theories defining the redistributive interventions of the state as an inefficiency area have a significant impact lying at the bottom of this change. During this period, theories of Laffer and Laviatan suggesting that high tax rates dissuade economic activities
have especially gained wide currency. With Musgrave (1959),
the economic interventions of the state, which were valid until
the 1970s, had become a part of the theory under the famous stabilization, allocation and distribution branches of government. Here, allocation efficiency and distributive justice are defined as the conflicting areas between the purposes of the state. During the last years, it has been suggested that redistribution and efficiency might not always be conflicting, that in other words, there might not be a trade-off between them. Boadway and Keen (2000) explain situations where redistribution might in fact be efficiency-enhancing in the economic process. Especially, those are aid programs devoted to poor people and Pareto improvements creating efficiency gains in social security.
Recently, tax and expenditure programs that might enhance the related efficiency and their regional and territorial differences are being modeled. When we consider this situation together with the approach arguing that the redistributive effects of taxes and transfers depend on their magnitude, composition and the progressive nature of each component; the necessity of analysis
based on multi-factors becomes evident.
3. THE EMPIRICAL LITERATURE
The magnitude of the redistributive interventions of the state and
the mechanisms used in this respect are the areas where empirical
studies concentrate. In OECD countries, it has been calculated that the inequality after taxes and transfers was 25% lower than the inequality before taxes and transfers at the end of the 2000s for the OECD average (OECD, 2012). 3/4 of the decrease in the
inequality is explained by transfers while the rest is explained by
direct taxes towards households (Joumard and Pisu, 2012; OECD, 2012). Especially cash transfers constitute the most important item leading to a decrease in the inequality (about 19%) measured as
the decrease in the market income concentration before and after
transfers. Payments made to pensioners have the highest share in cash transfers. During the studies, the reasons explaining the
limited redistributive effect of taxes have been mentioned as the use of consumption taxes and social security payments instead of
progressive income tax, the limited progressivity of the tax tariff and the fact that tax expenditures provide advantage over high
income families.
Similarly, Bastagli et al. (2008) put forth that the redistributive effect of the fiscal policy was getting realized in terms of the expenditures and transfers of the budget. According to Prasad (2008), a strong and negative relation exists between social transfer expenditures and inequality in developed countries. More than half of the redistributive effects of social transfers (80% in Switzerland and 70% in Germany) derive from pension benefits.
Niehues (2010) analyzed the social expenditure categories that are effective in decreasing income inequality for the EU countries. According to this study, social benefits are not an effective category of social expenditures for decreasing income inequality while
payments related to social security, such as unemployment and
effect on income inequality emerging after tax and expenditures and not a decreasing effect.
Fuest et al. (2010) analyzed the effects of the tax and benefit
system on income distribution in the EU countries based on
the sequential accounting approach and the factor source decomposition approach. According to the first approach, social benefits are the most important factor on inequality. As to the second approach, social benefits are negligible and sometimes they have a slightly positive effect on inequality. Here taxes and social contributions are the most important factors contributing
to the decrease of inequality. Authors explain this opposite result with the different normative focus points of these two approaches
and especially argue that social benefits have objectives different
than redistribution.
Gregorio (2002) examined the effect of education and social expenditures on income distribution between 1960 and 1990 in African, Asian, Latin American and OECD countries. The findings
of the study reveal that education and social expenditures have
an improving effect on income distribution. Nevertheless, in
addition to these items, income factors also play a moderate role
in explaining the differences among countries and these variables cannot explain the major part of the inequality among countries.
On the other hand, Prasad (2008) made a comparison between six Latin American countries and the OECD countries with regards
to the effect of taxes and expenditures on income inequality.
According to this study, income inequality only decreased by 1.4 points through taxes and expenditures in Latin American countries while it decreased by 16 points in OECD countries. The
contribution of direct taxes to inequality has only been a decrease
of 0.6% in the Gini coefficient. Indirect taxes such as the value
added tax, customs duties and import tariffs have increased income
inequality by 0.5 points.
In another study (Mahler and McKeever, 2009) a comparison has
been conducted between market income inequality and disposable
income inequality in more than 100 developed and less-developed countries for a period of 25 years. According to this study, the Gini coefficient of the market income increased by 68 Gini points since 1980 while it increased 38 points after the state intervention.
These results reveal that the redistribution policies of the state do
not progress at the same level with the market income increase.
Furthermore, while the market income increases by 64 point in
developed countries and by 70 points in developing countries, the ratios are respectively 26 and 44 following the state intervention.
This situation shows that in comparison to developed countries,
the state is more efficient in redistribution in developing countries.
In a study conducted over 150 developed and developing countries between the years 1970 and 2009, Martinez-Vazquez et al. (2012)
examined the tendency of the tax and expenditure policy in
changing the inequality trends. Authors presented findings on the redistributive effects of especially health, education, housing and
social security expenditures. Taxes have a very low redistributive
effect, especially in developing countries. Finally, as mentioned earlier, the study points out that financial instruments based on
expenditures are more efficient in decreasing income inequality, compared to the financial instruments taking place at the income side of the budget.
Cevik and Correa-Caro (2015) analyzed the effects of the fiscal policy on income distribution in China, BRIC countries together with 30 developing countries. In contradiction to other studies, in
this analyze it has been determined that while public expenditures
had an aggravating effect on income distribution in those countries, taxation had an improving effect. While the redistribution effect of the fiscal policy was stronger in China in comparison to BRIC and other developing countries, this effect had not been found strong enough so as to compensate the income distribution aggravating effect of other influential factors.
To conclude, the limited number of comparative analyses made
between countries on the income inequality decreasing effects of fiscal policy has reached different results. For instance when OECD countries are compare with Latin American countries, it is observed that this effect is rather low in Latin American countries.
As this comparison is made between with less-developed countries,
the effect seems to be low in developed countries. Compared to taxes, transfers seem to be a more effective tool of the fiscal policy in decreasing income distribution inequalities. In developed
countries, more than half of the redistribution effect of social
transfers takes its source from pension benefits. In developing countries, social transfer mechanisms redistributing income in a
systematic manner are more limited.
4. THE DATA AND MODEL
The multivariate framework includes Gini_market and Gini_net
coefficients, nominal GDP growth rate, annual inflation rate, total unemployment rate, central government tax revenue in current US dollars, central government social contributions in current US dollars, central government interest expense in current US dollars, central government subsidies in current US dollars and central government social benefits in current US dollars of 17 developing and 30 developed countries1. The data
for Gini coefficients were attained from the Standardized World Income Inequality Database (SWIID Version 5.1) of Solt. GDP growth, inflation and unemployment data were obtained from the World Bank-World Development Indicators database. The data for all fiscal/financial variables were gathered from the IMF-Government Finance Statistics database. The data set covers the period 1990-2014 and variables excluding Gini_market, Gini_net, GDP growth, inflation and unemployment are in natural logarithms. All the fiscal/financial variables include
social security funds.
The effects of government intervention on income inequality in selected country groups were investigated by using a linear panel data model that can be formulated in the following manner:
Yi,t= ci,t+αGrowthi,t+βInfi,t+δUnempi,t+σTaxi,t+ϕConti,t+θInti,t
+ΨSubi,t+ηBenefi,t+εi,t
Where Y is the vector of dependent variables (i.e. Gini_net and the difference between Gini_net and Gini_market (hereafter, Gini_diff)), Growth is the rate of nominal GDP growth, Inf is
annual inflation rate, Unemp is total unemployment rate, Tax is
central government tax revenue, Cont is central government social
contributions, Int is central government interest expense, Sub is
central government subsidies, Benef is central government social benefits, c is constant and ε is serially uncorrelated error term.
5. THE METHODOLOGY
In this study, estimation of the constructed model was done by
using linear panel data estimation techniques. The ordinary least squares (OLS), the fixed-effects model (FEM) and the random-effects model (REM) can be followed for the estimation of linear panel equations. Since the OLS ignores the unobservable effects
which are one of the most important components of panel data
analysis, FEM or REM is generally utilized for the estimation. However, the existence of cross-sectional dependence (CD) and
unit root in data should be checked before the estimation.
The CD is an important problem for the panel data econometrics. High degrees of globalization or cross-unit relations may give
rise to the existence of this problem. In case of panel data which
is CD, the estimation results generally become inconsistent and upward-biased (Bai and Kao, 2006). So, it is important to test the existence of CD before the analysis.
This study utilizes the CD test which was developed by Pesaran (2004) for investigating the existence of CD. Under the null hypothesis of no CD, this statistic is asymptotically distributed as standard normal and efficient for the case of large N and small T. The CD test statistic proposed by Pesaran (2004) is as follows:
1 1 1 2 ˆ ( 1) N N ij
i j i
T CD p N N − = = + = −
∑ ∑
Where T is time interval, N is the number of cross-sections, and
ˆij
p is pair-wise correlation between cross-sections.
In addition to cross-sectional dependency, it is necessary to ensure that the variables under consideration are stationary. In this
context, the panel unit root test developed by by Im et al. (2003) (hereafter, IPS) was executed to the data. The IPS test assumes that the persistence parameters of the autoregressive process vary
freely across cross-sections.
If the purpose of the panel analysis is to obtain a general result by using the data of randomly selected units from the whole sample, the REM is an appropriate choice. However, if the aim is to reach a
general result by employing the data of a fixed group, the suitable
model is FEM (Baltagi, 2005). In this study, since the considered sample is randomly selected, the REM theoretically seems to be
the proper choice.
The usage of REM requires no correlation between unobservable effects and explanatory variables. Hausman (1978) and Hausman-Taylor (1981) developed a test statistic (i.e. Hausman test) which shows the estimator of REM (feasible generalized least squares) is unbiased and consistent under the null of no correlation
between unobservable effects and explanatory variables. If the
null hypothesis is rejected, then the estimator of FEM (within estimator) should be used. In this study, Hausman test statistic was
used for the determination of the correlation between unobservable effects and explanatory variables.
Panel data analysis accommodates two unobservable effects which
should be investigated before the estimation. These are group and time effects. Breusch and Pagan (1980) developed LM statistics in order to test the existence of group and time effects in REM (Green, 2003). LM1 statistic tests the significance of group effects under the null of no group effects and LM2 statistic tests the significance
of time effects under the null of no time effects. If one of the null
of LM1 or LM2 is rejected, the model is one-way REM; on the other hand, if both the nulls of LM1 and LM2 are rejected then the
model takes the form of two-way REM. Considered test statistics are formulated as follows (Baltagi, 2005):
LM NT
T
u I J u
u u
N T
1
2 2
2 1 1
= − − ⊗ ( ) ( ) ~ ' ' LM NT N
u J I u
u u
N T
2
2 2
2 1 1
= − − ⊗ ( ) ( ) ~ ' '
The existence of group and time effects in FEM is evaluated by an ANOVA-F statistic which was developed by Moulton and Randolph (1989). This F-statistic tests the significance of group and time effects under the nulls of no group and no time effects. The formulation of considered F-statistic is as follows (Baltagi, 2005):
F MD D MD D M p r
Gy NT k p r
= − − − + − ' ' ' ' ~ ( ) / ( ) / ( )
One of the most important diagnostics in econometric studies is
to determine whether there exists serial correlation in the data.
Wooldridge (2002) proposed an AR(1) serial correlation test
under the null hypothesis of no serial correlation. The test is
applied by regressing the residuals from the OLS estimation of first-differenced variables on the lagged residuals. If the residuals from this estimation have an autocorrelation coefficient of −0.5,
then the null hypothesis cannot be rejected. The study employed
a Wald test (FAR(1)) developed by Drukker (2003) for this matter.
Another important diagnostic which should be taken into account
in panel data studies is to check the existence of multicollinearity.
an important problem; if it exceeds 10, then it could be serious problem. In case the value which is over 10, probability of VIF that is measured as (1/VIF) should be evaluated. If the probability is smaller than 0.01, there is no multicollinearity among explanatory variables, otherwise there exists (Gujarati, 2004).
The last diagnostic that was considered in the study is about the
existence of heteroscedasticity. Standard error component of the
established model assumes that the regression disturbances are homoscedastic with the same variance across time and groups. When
heteroscedasticity is present, homoscedastic disturbances will result
in consistent but inefficient coefficients and biased standard errors (Baltagi, 2005). The heteroscedastic models assume that the variances of the error terms change between cross-sectional units and this difference is not accounted for by variables. Breusch and Pagan (1979) proposed a test statistic (BPh) under the null of homoscedasticity for testing the existence of heteroscedasticity in error terms. This test statistic uses the residuals from the OLS estimation. If we expect heteroscedasticity to exist in error terms in the REM or FEM cases, then the statistic based on the OLS estimation may also be used in the both models. Once the heteroscedasticity is detected, one possible
way to correct heteroscedastic bias in the variance-covariance matrix
is to use the White’s estimator (Erdem and Tugcu, 2011).
6. FINDINGS
The existence of CD was checked and results were reported in
Table 1. Accordingly, either for developed or for developing
countries, there is no statistically significant CD problem at 1% level of significance.
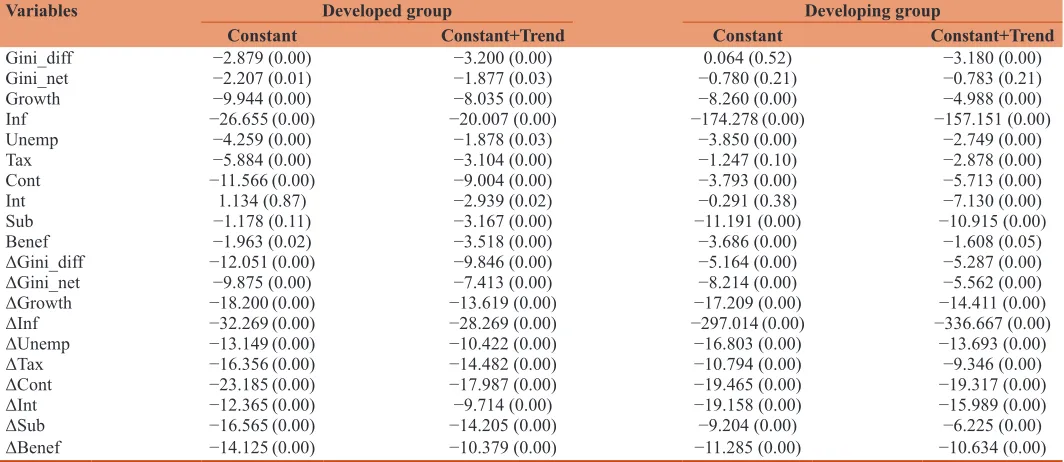
As mentioned, the IPS test was utilized for investigating the
existence of unit root in data. Results reported in Table 2 indicated that most of the variables are level-stationary. Besides, all variables
are first-difference stationary.
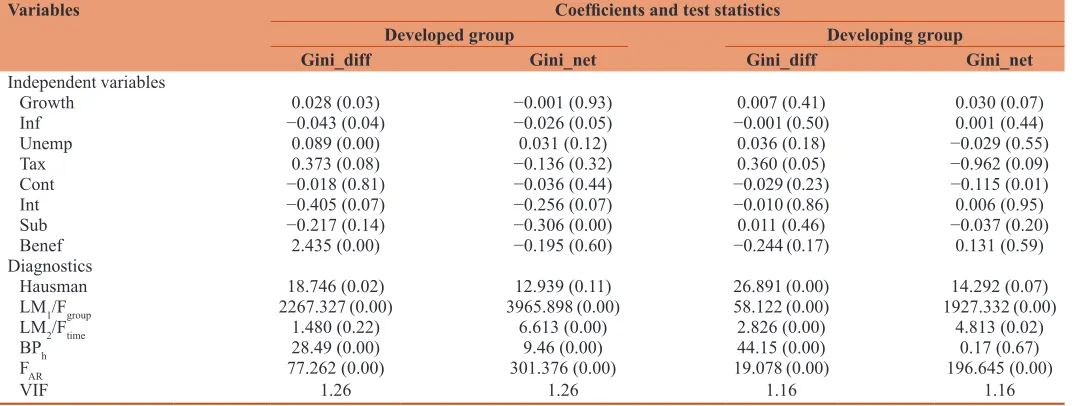
After completing the CD and unit root analyses, the constructed model was estimated by using appropriate estimation techniques
and results were presented in Table 3. First of all, at 1% level of significance, the Hausman test statistics showed that models except the one with the dependent variable Gini_diff for developing country group should be estimated by using the random effect model. And,
it is proved by the statistics that the models except the one with the
dependent variable Gini_diff for developed country group contain both statistically significant group and time effects. The existence
of heteroscedasticity in the model with the dependent variable
Gini_net for developing group was corrected by utilizing the cross section covariance method of White, and the existence of serial correlation in all models was corrected by incorporating the AR(1)
process to the estimations. Finally, the VIF statistics indicated that multicollinearity is not a problem for any of the estimations.
According to the estimated coefficients for developed country group, when the dependent variable is Gini_diff; inflation and interest expense were found as the statistically significant factors that decrease the Gini coefficient, whereas economic growth, unemployment, tax revenue and social benefits increase it. Among the variables with positive coefficient, social benefit has the largest magnitude. Other coefficients were not found to be statistically significant. When the dependent variable is Gini_net; inflation,
interest expense and subsidies were found as the statistically
significant variables that decrease the Gini coefficient. All other variables have statistically insignificant coefficients.
Table 1: Cross-sectional dependence test results Dependent variables CD test for
developed group developing groupCD test for
Gini_diff 1.766 (0.07) 2.090 (0.03)
Gini_net −0.093 (0.92) 1.046 (0.29)
Numbers in parentheses are P values
Table 2: Unit root test results
Variables Developed group Developing group
Constant Constant+Trend Constant Constant+Trend
Gini_diff −2.879 (0.00) −3.200 (0.00) 0.064 (0.52) −3.180 (0.00)
Gini_net −2.207 (0.01) −1.877 (0.03) −0.780 (0.21) −0.783 (0.21)
Growth −9.944 (0.00) −8.035 (0.00) −8.260 (0.00) −4.988 (0.00)
Inf −26.655 (0.00) −20.007 (0.00) −174.278 (0.00) −157.151 (0.00)
Unemp −4.259 (0.00) −1.878 (0.03) −3.850 (0.00) −2.749 (0.00)
Tax −5.884 (0.00) −3.104 (0.00) −1.247 (0.10) −2.878 (0.00)
Cont −11.566 (0.00) −9.004 (0.00) −3.793 (0.00) −5.713 (0.00)
Int 1.134 (0.87) −2.939 (0.02) −0.291 (0.38) −7.130 (0.00)
Sub −1.178 (0.11) −3.167 (0.00) −11.191 (0.00) −10.915 (0.00)
Benef −1.963 (0.02) −3.518 (0.00) −3.686 (0.00) −1.608 (0.05)
ΔGini_diff −12.051 (0.00) −9.846 (0.00) −5.164 (0.00) −5.287 (0.00)
ΔGini_net −9.875 (0.00) −7.413 (0.00) −8.214 (0.00) −5.562 (0.00)
ΔGrowth −18.200 (0.00) −13.619 (0.00) −17.209 (0.00) −14.411 (0.00)
ΔInf −32.269 (0.00) −28.269 (0.00) −297.014 (0.00) −336.667 (0.00)
ΔUnemp −13.149 (0.00) −10.422 (0.00) −16.803 (0.00) −13.693 (0.00)
ΔTax −16.356 (0.00) −14.482 (0.00) −10.794 (0.00) −9.346 (0.00)
ΔCont −23.185 (0.00) −17.987 (0.00) −19.465 (0.00) −19.317 (0.00)
ΔInt −12.365 (0.00) −9.714 (0.00) −19.158 (0.00) −15.989 (0.00)
ΔSub −16.565 (0.00) −14.205 (0.00) −9.204 (0.00) −6.225 (0.00)
ΔBenef −14.125 (0.00) −10.379 (0.00) −11.285 (0.00) −10.634 (0.00)
Estimates for developing country group indicated that, when the dependent variable is Gini_diff; only tax revenue was found as a statistically significant factor that increases the Gini coefficient. All other variables have statistically insignificant coefficients. When the dependent variable is Gini_net; economic growth was seen as the single statistically significant factor that increases the Gini coefficient, whereas tax revenue and social contributions decrease it. Among the variables with negative coefficient, tax revenue has the largest magnitude. All other variables have statistically insignificant coefficients.
7. DISCUSSION AND CONCLUSION
In this study, the factors that are supposed to be effective on income
distribution have been analyzed by treating on a comparative basis of the developed and the developing countries. As distinct from the
other studies, the current study makes a research on factors that are
effective in diminishing inequalities by the state by establishing an analysis on the Gini-net coefficient as well as on the difference between the market Gini coefficient and the Gini coefficient
obtained after state intervention. Furthermore, in addition to indicators related to taxes and expenditures, the study also takes into consideration macroeconomic factors that are important for
developing countries such as growth, inflation and unemployment.
The study reaches a common conclusion with the studies mentioned
before in that social benefits are the most important item that increases inequality differences in pro and post government
intervention in developed countries. Similarly, as indicated in other studies, the study evidences that tax revenues have a positive impact
on income distribution, although not as much as social benefits. As a conclusion expected in this country group, interest expenditure is a variable effecting positively of the Gini-net. In this study, it has been found that subsidies have an decreasing effect in income
inequality, which had not been analyzed in the previous studies.
The study is in parallel with the study of Cevik and Correa-Caro (2015) in that tax revenues have an improving impact on income
distribution in developing countries with regards to both Gini-diff
and Gini-net. Furthermore, social security payments also create a
diminishing impact on inequalities. It has been noted that transfers,
interest expenditures and subsidies, which fall into the expenditure
side of the finance policy in developing countries, do not have a significant explanatory power. This conclusion is consistent with the literature arguing that the re-distributional effect of social transfers is limited in developing countries (Joumard and Pisu, 2012; OECD, 2012; Martinez-Vazquez et al., 2012). On the other hand, this aspect suggests that other factors are effective in explaining income distribution inequality in the related country group, the progressive tax rates coming in the first place. These
factors could not be analyzed in the study, due to restricted data. Further studies that take into consideration other data resources as well as different estimation techniques possibly extend the scope and results of current study.
Besides, the results indicate that the redistributive impact of the state
is more effective in developed countries compared to developing countries in terms of growth, social benefits and interest expense.
With regards to macroeconomic factors, inflation is an effective factor in both kinds of Gini coefficients in developed countries. Similarly, economic growth and unemployment have a positive effect on income distribution in this country group. On the other hand, as to developing countries, economic growth is an important factor increasing inequalities, which points out that there is necessity to design a policy that considers income distribution in developing countries. The results of the study suggest that
the quantity and quality of the social benefits, such as the
implementation of benefits that target low income groups, is one of the most effective ways of reducing inequality in developing
countries.
REFERENCES
Atkinson, A.B. (1997), Bringing income distribution in from the cold. The Economic Journal, 107, 297-321.
Table 3: Results of the estimation
Variables Coefficients and test statistics
Developed group Developing group
Gini_diff Gini_net Gini_diff Gini_net
Independent variables
Growth 0.028 (0.03) −0.001 (0.93) 0.007 (0.41) 0.030 (0.07)
Inf −0.043 (0.04) −0.026 (0.05) −0.001 (0.50) 0.001 (0.44)
Unemp 0.089 (0.00) 0.031 (0.12) 0.036 (0.18) −0.029 (0.55)
Tax 0.373 (0.08) −0.136 (0.32) 0.360 (0.05) −0.962 (0.09)
Cont −0.018 (0.81) −0.036 (0.44) −0.029 (0.23) −0.115 (0.01)
Int −0.405 (0.07) −0.256 (0.07) −0.010 (0.86) 0.006 (0.95)
Sub −0.217 (0.14) −0.306 (0.00) 0.011 (0.46) −0.037 (0.20)
Benef 2.435 (0.00) −0.195 (0.60) −0.244 (0.17) 0.131 (0.59) Diagnostics
Hausman 18.746 (0.02) 12.939 (0.11) 26.891 (0.00) 14.292 (0.07)
LM1/Fgroup 2267.327 (0.00) 3965.898 (0.00) 58.122 (0.00) 1927.332 (0.00)
LM2/Ftime 1.480 (0.22) 6.613 (0.00) 2.826 (0.00) 4.813 (0.02)
BPh 28.49 (0.00) 9.46 (0.00) 44.15 (0.00) 0.17 (0.67)
FAR 77.262 (0.00) 301.376 (0.00) 19.078 (0.00) 196.645 (0.00)
VIF 1.26 1.26 1.16 1.16
Bai, J., Kao, C. (2006), On the estimation and inference of a panel cointegration model with cross-sectional dependence. In: Baltagi, B.H., editor. Panel Data Econometrics: Theoretical Contributions and
Empirical Applications. Amsterdam: ElsevierScience.
Baltagi, B. (2005), Econometric Analysis of Panel Data. 3rd ed. UK: John Wiley-Sons Ltd.
Breusch, T.S., Pagan, A.R. (1979), A simple test for heteroscedasticity and random coefficient variation. Econometrica, 47, 1287-1294. Breusch, T.S., Pagan, A.R. (1980), The Lagrange multiplier test and
its applications to model selection in econometrics. Review of
Economics Studies, 47, 239-253.
Bastagli, F., Coady, D., Gupta, S. (2008), Income Inequality and Fiscal Policy, IMF. Discussion Paper: IMF.
Bourguignon, F., Morrison, C. (1990), Income distribution, development and foreign trade: A cross sectional analysis. European Economic
Review, 34, 1113-1132.
Boadway, R., Keen, M. (2000), Redistribution. In: Atkinson, A.B., Bourguignon, F., editors. Handbook of Income Distribution. Vol. I. Ch. 12. Amsterdam: North Holland. p679-735.
Cevik, S., Correa-Caro, C. (2015), Growing (Un)Equal: Fiscal Policy and Income Inequality in China and BRIC. IMF Working Paper. 15/68. Drukker, D.M. (2003), Testing for serial correlation in linear panel-data
models. Stata Journal, 3, 168-177.
Erdem, E., Tugcu, C.T. (2011), Investigating the macroeconomic and qualitative dynamics of urban economic growth: Evidence from the
most productive Turkish cities. International Journal of Business and
Social Science, 2(13), 136-145.
Fuest, C., Niehues, J., Peichl, A. (2010), The redistributive effects of tax benefit systems in the enlarged EU. Public Finance Review, 38(4), 473-500.
Green, W.H. (2003), Econometric Analysis. 5th ed. New Jersey: Prentice Hall. Gujarati, D.N. (2004), Basic Econometrics. 4th ed. New York: McGraw-Hill. Gregorio, L. (2002), Education and income inequality: New evidence from
cross-country data. The Review of Income and Wealth, 48(3), 395-416. Hausman, J.A. (1978), Specification tests in econometrics. Econometrica,
43, 727-738.
Hausman, J.A., Taylor, W.E. (1981), Panel data and unobservable individual effects. Econometrica, 49, 1377-1398.
Im, K.S., Pesaran, M.H., Shin, Y. (2003), Testing for unit roots in heterogeneous panels. Journal of Econometrics, 115(1), 53-74. Kuznets, S. (1955), Economic growth and income inequality. American
Economic Review, 45(1), 1-28.
IMF. Government Finance Statistics Database. Available from: http// www.imf.org/external/data.htm. [Last accessed on 2017 Jan 19]. Joumard, I.M., Pisu, D.B. (2012), Tackling income inequality: The
role of taxes and transfers. OECD Journal: Economic Studies, 2012, 37-70.
Martinez-Vazquez, V., Vuloviç, B., Dodson, M. (2012), The impact
of tax and expenditure policies on income distribution: Evidence
from a large panel of countries. Review of Public Economics, 200, 95-130.
Mahler, V.A., McKeever, S.A. (2009), Income Inequality in comparative
perspective: A cross-national analysis. 21st International Political Science Association World Congress of Political Science. Chile,
12-16 July.
Musgrave, R.A.A. (1959), The Theory of Public Finance. New York: McGraw-Hills.
Moulton, B.R., Randolph, W.C. (1989), Alternative tests of the error components model. Econometrica, 57, 685-693.
Niehues, J. (2010), Social Spending Generosity and Income Inequality: A Dynamic Panel Approach. IZA Discussion Paper No. 5178. OECD. (2012), Income Inequality and Growth: The Role of Taxes and
Transfers. OECD Economics Departments Policy Notes, No. 9,
January.
Pesaran, M.H. (2004), General diagnostic tests for cross section dependence in panels. Cambridge Working Papers in Economics. No. 0435. Faculty of Economics, University of Cambridge. Prasad, N. (2008), Policies for Redistribution: The Use of Taxes and Social
Transfers. International Institute for Labour Studies, Discussion Paper. 194.
Solt, F. (2016), The Standardized World Income Inequality Database. Social Science Quarterly 97. SWIID Version 5.1, July 2016. Wooldridge, J.M. (2002), Econometric Analysis of Cross Section and
Panel Data. USA: MIT Press.