R E S E A R C H A R T I C L E
Open Access
Attention decouples action potentials from
the phase of local field potentials in
macaque visual cortical area MT
Moein Esghaei
1,2,3*, Mohammad Reza Daliri
1,2*and Stefan Treue
3,4,5,6Abstract
Background:The timing of action potentials (“spikes”) of cortical neurons has been shown to be aligned to the phase of low-frequency (< 10 Hz) local field potentials (LFPs) in several cortical areas. However, across the areas, this alignment varies and the role of this spike-phase coupling (SPC) in cognitive functions is not well understood.
Results:Here, we propose a role in the coordination of neural activity by selective attention. After refining previous analytical methods for measuring SPC, we show that first, SPC is present along the dorsal processing pathway in macaque visual cortex (area MT); second, spikes occur in falling phases of the low-frequency LFP independent of the location of spatial attention; third, switching spatial attention into the receptive field (RF) of MT neurons decreases this coupling; and finally, the LFP phase causally influences the spikes.
Conclusions:Here, we show that spikes are coupled to the phase of low-frequency LFP along the dorsal visual pathway. Our data suggest that attention harnesses this spike-LFP coupling to de-synchronize neurons and thereby enhance the neural representation of the attended stimuli.
Keywords:Local field potential (LFP), Spike-phase coupling, Area MT, Macaque, Spatial attention, Inter-neuronal correlation, Delta, Theta
Background
The frequency of neuronal impulses is the nervous
sys-tem’s central principle for representing sensory stimuli.
For instance, a large majority of neurons in the area
MT of extrastriate primate visual cortex are
direction-selective, i.e., they systematically vary their firing rate as a function of the direction of visual
mo-tion shown in their receptive fields [1,2]. The local
ac-tivity of neural populations creates local field potential, continuous periodic signals across a broad frequency spectrum, in contrast to the binary action potentials
(“spikes”) generated by the individual neurons. Local
field potentials (LFPs) represent mainly the synaptic ac-tivity from volumes within several hundred
microme-ters around the recording electrode [3, 4]. Higher
frequency components of LFPs represent more local
activity [5–7], while the activity in the lower frequency
bands reflects the integration of neural activity across
larger networks of neurons [8]. Although spike and LFP
signals are often studied independently, it has also been shown that neuronal spike times are correlated with the phase of low-frequency (< 10 Hz) LFPs in a number of
cortical areas including the primary visual [7] and the
prefrontal cortex [9]. Similarly, Sirota et al. found for
several cortical regions that local cortical spikes are coupled to the LFPs of the hippocampus in the theta
band (3–5 Hz) [10]. This spike-phase coupling (SPC)
might provide a mechanism for the coordination of the spike timing across the cortex that is thought to under-lie cognitive functions, such as selective attention.
Visual attention is a mechanism for the selective allo-cation of processing resources to the most behaviorally
relevant information [11–13] within the incoming
stream of sensory signals. Converging evidence suggests that when spatial locations, features, or objects are attended, neurons in the visual cortex that represent
* Correspondence:[email protected];[email protected]
1Cognitive Neurobiology Laboratory, School of Cognitive Sciences, Institute for Research in Fundamental Sciences (IPM), Niavaran, P.O. Box 19395-5746, Tehran, Iran
Full list of author information is available at the end of the article
them respond at higher spike rates [14–16]. For ex-ample, neurons in the macaque extrastriate visual cortex
increase their spike rate when the animal’s spatial
atten-tion overlaps a given neuron’s receptive field (RF) [17].
Similarly, attention modulates low-frequency (< 10 Hz) local field potentials (LFPs) across different regions of
the macaque cortex [18]. Specifically, visual attention
de-creases the power of low-frequency LFPs in macaque V4
[19, 20] and V1 [21]. Furthermore, Lakatos et al.
re-ported that attention can shift the phase of
low-frequency delta band (0–4 Hz) activity elicited by
rhythmic stimulus presentations such that the phases of the delta band are better aligned with the stimulus
pre-sentations [22]. Together with the observation that
at-tention may sample stimuli rhythmically at the rate of
4–10 Hz [23], these findings suggest a functional role of
low-frequency oscillations in sensory processing and its attentional modulation.
The previously reported alignment of spike times to the
phase of the low-frequency components of LFPs [7, 24]
provides a potential mechanism for how low-frequency activity could affect the spike-based encoding of sensory
information [25]. Given the observation that spiking
activ-ity across neighboring neurons shows an attentional
de-crease of their synchrony and their trial-by-trial
correlations [26, 27], attention may use the spike-LFP
coupling to influence inter-neuronal correlations.
Here, we hypothesize that the mechanism of this
atten-tional de-synchronization could be mediated by
de-coupling spiking activities from low-frequency synaptic activity (reflected in LFPs). To test this proposal, we trained rhesus monkeys to attend to a stimulus within the recep-tive field of MT neurons or to another stimulus outside the receptive field. We developed a refined method for cal-culating the SPC, avoiding the biases to differences of LFP power across time present in previous approaches. In sup-port of our hypothesis, the data show that SPC decreases when spatial attention is allocated inside a receptive field.
Methods Animal welfare
The scientists in this study are aware and are committed to the great responsibility they have in ensuring the best possible science with the least possible harm to any
ani-mals used in the scientific research [28]. All animal
proce-dures of this study have been approved by the responsible regional government office (Niedersaechsisches Lande-samt fuer Verbraucherschutz und Lebensmittelsicherheit (LAVES)) under the permit numbers 33.42502/08-07.02
and 33.14.42502-04-064/07. The animals were
group-housed with other macaque monkeys in the facil-ities of the German Primate Center in Goettingen, Germany, in accordance with all applicable German and European regulations. The facility provides the animals
with an enriched environment (including a multitude of
toys and wooden structures [29, 30]) and natural as well
as artificial light, exceeding the size requirements of the European regulations, including access to outdoor space. Surgeries were performed aseptically under gas anesthesia
using standard techniques, including appropriate
peri-surgical analgesia and monitoring to minimize
poten-tial suffering [31]. The German Primate Center has several
staff veterinarians that regularly monitor and examine the animals and consult on procedures. During the study, the animals had unrestricted access to food and fluid, except on the days where the data were collected or the animals were trained on the behavioral paradigm. On these days, the animals were allowed unlimited access to fluid through their performance in the behavioral paradigm. Here, the animals received fluid rewards for every
cor-rectly performed trial. Throughout the study, the animals’
psychological and veterinary welfare was monitored by the
veterinarians, the animal facility staff and the lab’s
scien-tists, all specialized in working with non-human primates. The three animals participating in this study were healthy at the conclusion of our study and were subsequently used in other studies.
Behavioral task and recording
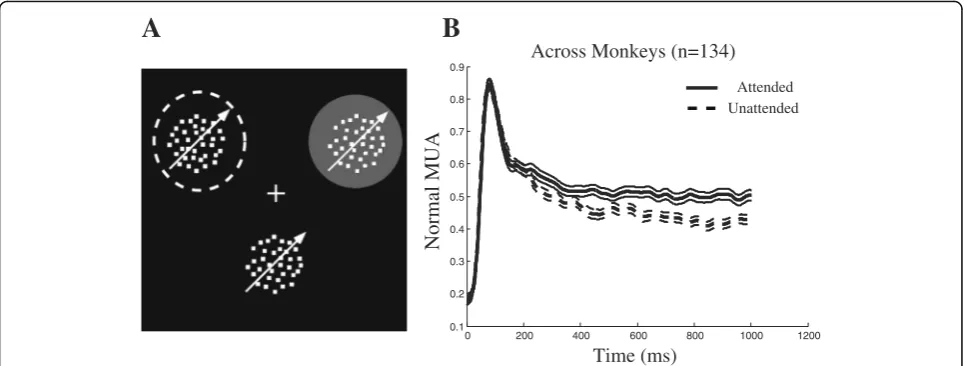
Three male macaque monkeys were trained to foveate a central fixation point and covertly attend to one of two or three coherently moving random dot patterns (RDPs)
presented simultaneously at peripheral locations (Fig.1a).
A trial started after the monkey touched a lever and started foveating on the fixation point. Next, a spatial cue specified where the monkey had to attend to. For monkey H, this cue was a static RDP in the same pos-ition as the upcoming target stimulus, shown for 455 ms. For monkeys C and T, the cue was a small rect-angle placed on a virtual line connecting the fixation point to the upcoming target, shown for 250 ms. The moving RDPs were presented after a brief delay of 325 ms (monkey H) or 500 ms (monkeys C and T) after the cue had disappeared, and the target changed its dir-ection at a random time between 26 and 4250 ms after
the RDPs’onset. The monkeys were rewarded if they
re-leased the lever within a time window of 150–650 ms
(monkey H) or 60–700 ms (monkeys C and T) after the
direction change of the target. One of the RDPs was placed inside the receptive field (RF) and the other(s) outside. The RDP that was inside the RF and/or was tar-geted by the cue moved in the preferred direction of the neuron. The preferred direction of each neuron was
de-termined using the direction tuning function [1] that
Multi-unit activity (MUA) and LFP signals were re-corded from the area MT using a five-channel recording system (MiniMatrix; Thomas Recording), using the guide
tube as the reference electrode. Each electrode’s signal was
split into LFP and spike components by hardware filters. The LFPs were amplified and digitized at 1 kHz, while spikes were amplified and digitized at 40 kHz. We
re-corded from up to all five electrodes (impedance 2 MΩ,
arranged linearly and separated by 305 μm)
simultan-eously. Spikes were sorted online using the Plexon Data Acquisition System and next down sampled to 1 kHz. We selected sites according to the selectivity of the isolated cells to motion direction and the position of the electrode in the cortex using MRI images. In sessions with simultan-eous recordings, we made sure that the RFs of the differ-ent units overlap sufficidiffer-ently for all RFs to contain the stimulus. Only the sites with at least three trials in each at-tention condition were selected for the analyses, resulting in an average of ten trials per attention condition. Overall, we selected 326 site pairs from monkey H, 28 pairs from monkey C, and 28 pairs from monkey T (taking the spike from one electrode and LFPs from the other simultan-eously recording electrodes) for our analysis (for more
de-tails on the task and recordings, see [32] for monkeys C
and T and [33] for monkey H).
Data analysis
We conducted the analyses in MATLAB (Mathworks, Natick, MA). To create the spike density function, we convolved a Gaussian of SD = 15 ms with the MUA
spike trains [32] and normalized the result for each site
by the maximum value across both attention conditions. We found the starting point of attention modulation on MUA by searching for the first ten consecutive time
points (ms) that were significantly (p< 0.01 pairedttest)
different in firing rate between the two attention condi-tions. The attentional modulation index (AI) was calcu-lated using the formula:
AI¼ðratt−runattÞ=ðrattþrunattÞ;
whererattand runattcorrespond to the MUA response
of each site in the attended and unattended conditions,
respectively [34].
Before analyzing the LFPs, we aligned the LFP phases using the method proposed by Nelson et al. in order to correct the phase shifts created by the recording system
[35]. All LFP signals were then normalized to their mean
and std., so their average power and standard deviation would be equal. In order to filter the LFP signals into different low-frequency bands, we used EEGLAB tool-box’s eegfilt function [36] with the filter order of 3 × (sampling_rate/low_cutoff_freq) and assuming each
trial’s LFP signal as one epoch (rather than applying
in-dependent filters on different sections of the signal). For each LFP signal, we tried different frequency bands with their starting frequencies changing between 1 and 15 Hz and bandwidths of 4 Hz. To calculate the spike-phase coupling (SPC) strength for each recorded spike-LFP pair, we first equalized the firing rate between the
0 200 400 600 800 1000 1200
0.1 0.2 0.3 0.4 0.5 0.6 0.7 0.8 0.9
Time (ms)
Normal MUA
Across Monkeys (n=134)
Attended Unattended
B
A
attended and unattended conditions. This is because the lower spike rate within a given interval is, the larger phase-aligned the spikes would be. This follows the same logic as when the difference between the proportion of the heads and tails for flipping a coin correlates nega-tively with the number of flips (imagine the number of flips as the number of spikes and the two falling
condi-tions (head/tails) as two anti LFP phases) (see [37]; Fig.4
for a simulation). We equalized the mean firing rate of each site across the two attention conditions by ran-domly removing the spikes from each spike train re-corded at each trial. We then used the following equation:
M¼1
n
Xn
k¼1
eiφk;
wherenis the number of spikes in each spike train,φk
denotes the instantaneous phase of the low-frequency band determined by Hilbert transform at the same time
as thekth spike, and eiφk determines the complex
expo-nential function ofφk(following Euler’s formula). An
es-timation of the strength of spike-phase coupling is given by the length of vector M (|M|) (also known as the
phase-locking value (PLV) [37]), and the locking phase
of each pair is given by the angle of vector M. Vector M is long when most spikes are locked to a specific phase and short when spikes are not locked to a fixed phase across different trials. However, PLV depends on the number of spikes, and it also does not show how com-parable it is for the neurons with different spike rates. In order to quantify the extent to which the spikes are coupled to the field potentials, we had to compare PLV with its distribution for randomly generated spike trains with the same rate as the original spike train. Therefore, for each trial, we generated 100 surrogate spike trains by randomly assigning spike times uniformly distributed in time and then calculated PLV for each surrogate spike train given the LFP signal filtered to the given frequency band. This gave us an estimation of the distribution of PLVs for the random spike trains with the same number of spikes as the original data and the filtered LFP. The
PLV of the original trial was thenz-scored to the mean
and standard deviation of the corresponding
distribu-tion. We defined the resulting value as the SPC index.
On the other hand, the distribution of instantaneous LFP phases within a given frequency band in each trial
was not uniform (i.e., a trial’s LFP could have more
ris-ing parts rather than fallris-ing parts); therefore, we made it uniform using the following steps: for each trial, we
par-titioned the trial’s time points (1–600 ms aligned to
250 ms after the stimulus onset; sampling frequency 1000 Hz) based on their corresponding phases, into 30
equally wide phase bins ([−π,−π+ 2π/30], [−π+ 2π/30,
−π+ 4π/30], …, [π−2π/30, π]). Next, an equal number
of time points (as much as the mean number of time points in each phase bin) was randomly chosen from each phase bin (without the removal of time points from bins), providing a sequence of time points with the same length as the original signal. This selection was carried out independent of spike times. Those spikes corre-sponding to the sampled time points, together with their LFP phases, were extracted from the original pair of sig-nals, and the SPC was calculated for them as explained above. This process was repeated 50 times for each trial, and the mean SPC value was taken as the SPC index for that trial.
SPC indices calculated using the above steps could be close to zero, both when the spikes are mostly locked to two (bipolar) or more (multi-polar) specific phases equally distanced around the circle, or when they are distributed uniformly around the circle. In both of these cases, the length of the averaged vector will not vary de-pending on the distribution of random vector lengths. Our measure does not distinguish between the bipolar (or multi-polar) case and the uniformly distributed case; this is because we aimed at identifying the condition where the spikes are locked to one specific phase.
To test if the SPC difference across attention condi-tions is not due to a difference in the signal-to-noise ra-tio of low-frequency LFP, we focused on a subset of trials that reflect an opposite effect of attention on low-frequency power, i.e., where attended trials have a higher mean low-frequency power compared to un-attended trials (rather than the opposite, reported
previ-ously—see the “Results” section). To this end, we
selected those attended trials where the 2–6 Hz (within
which attention maximally modulates SPC) power was
larger than the 4th percentile of the 2–6 Hz power
dis-tribution in the unattended trials. Similarly, for the
un-attended trials, we selected those trials where the 2–
6 Hz power was in the 96th percentile of the 2–6 Hz
power distribution in the attended trials. This gave us a set of trials for each attention condition, where all attended trials had a low-frequency power higher than that of the unattended trials (rather than unattended tri-als larger than attended tritri-als).
To evaluate the correlation between attentional modu-lations of the spike rate and SPC, we considered the data from all three animals. To calculate the SPC index of each site, we averaged the SPC index calculated between
that site’s spikes and the LFP recorded simultaneously
from each of the other sites, for each attention condition separately. We next calculated the correlation between the difference of the resultant SPC index across atten-tion condiatten-tions and the attenatten-tional modulaatten-tion of the spike rate (AI) through sites, separately for each of the
To control for the effect of volume conductance, we
subtracted from each site’s LFP the average across all
other available sites’LFPs of the same time point, except
that of the spike-providing site (to exclude any contam-ination of the potential leakage of the spike waveforms into the recorded LFP in calculating the SPC index). This allowed us to address those LFP components which are localized to the LFP-providing site. This analysis in-cluded 372 site pairs across animals (a number of site
pairs reflected in Fig.3were not considered due to those
sessions with only two parallel recordings, limiting any average referencing). This analysis was performed for the 4-Hz-wide frequency bands with their centers be-tween 3 and 8 Hz.
To calculate the locking phase for each site pair, vector M was computed for each trial, and then the mean vec-tor was calculated across the attended and unattended trials separately. The phase of the given vector for each condition was taken as the locking phase. To correct for multiple comparisons, we used the Bonferroni correc-tion throughout.
Results
Three rhesus monkeys were trained to direct their covert spatial attention towards a cued eccentric position on a computer screen while maintaining their gaze on a cen-tral fixation point. They were rewarded for reporting a small direction change in the moving random dot pat-tern (RDP) presented at the cued location (target stimu-lus) while ignoring the other stimuli presented at a location in the opposite visual hemifield (the distracters). The stimulus inside the RF was the target in half of the trials (attended condition) and the distracter in the other
half (unattended condition) (Fig. 1a). To validate
whether the monkeys actually attended selectively to the cued positions, we compared the neural activity across
the different attention conditions. Figure 1b plots the
spike density functions of the multi-unit activity (MUA) for the three monkeys from the onset of the target for the attended and the unattended condition. After about 245 ms, the activity in the attended condition becomes significantly greater than the unattended condition (see the “Methods” section for details) for the remainder of the trial. For the period from 250 to 850 ms after stimu-lus onset, the response in the attended condition was on average 10% higher than the unattended condition (see the “Methods” section for details). This confirms the well-known modulation of MT neural responses by spatial attention.
Spike-phase coupling is suppressed by attention
It is well established that attention modulates
inter-neuronal synchronization; however, the neural mechanism is not well-understood. Here, we suggest
that this modulation is implemented by controlling how strong the spikes are coupled to the instantaneous state of the population synaptic activity (represented by the
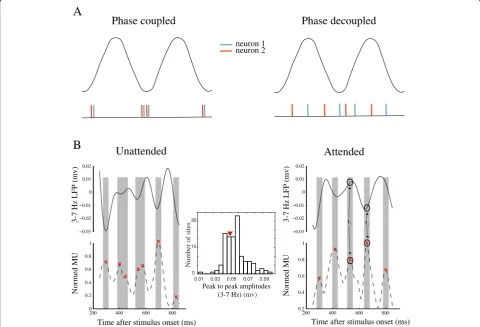
phase of the LFP). Figure2a shows how a stronger
coup-ling of spikes to LFP phase leads to a higher inter-neuronal synchrony. The left panel illustrates the spike train of two example neurons (each neuron shown in one color), where both neurons are coupled to the trough of the LFP. As shown in the lower panel, the two neurons fire with a high synchrony. On the other hand, when the two neurons are not coupled to the LFP phase,
generating spikes at different phases of the LFP (Fig.2a,
right panel), the spikes from the two neurons occur in-dependently of each other. This suggests that a higher spike-phase coupling (SPC) is a signature of a higher inter-neuronal synchrony.
To test if attention influences SPC, we analyzed the steady-state component of the neural responses, starting
250 ms after the stimulus onset, to avoid the
stimulus-locked low-frequency component of LFP. The data of a sample site recorded from monkey H are
pre-sented in Fig.2b. The left panel shows the multi-unit
ac-tivity (MUA, bottom) and the local field potentials (LFP, top) for a sample trial in the unattended condition, and the right panel shows the same signals for a sample trial in the attended condition. The MUA signals are smoothed and normalized to their maximum, and the
LFPs are filtered to 3–7 Hz (theta band). It is clear in
the left panel of this example that the peaks of the MUA are coupled to the phase of the low-frequency LFP in the unattended condition. However, in the right panel,
we observe a MUA peak int1that corresponds to a peak
of the LFP (as marked with circles), while another MUA
peak at t2 occurred with an LFP trough. Therefore, in
the attended condition, the MUA peaks show a reduced coupling to the LFP signal, i.e., MUA peaks occur at ar-bitrary phases of the LFP.
To verify the generality of the effect observed at the example site, we calculated the strength of spike-phase coupling (SPC) between the recorded MUA spikes and the recorded LFPs at low frequency ranges. In order to control any potential spectral leakage of spikes on low-frequency LFPs, we chose LFPs and MUAs from separate sites recorded at the same time. SPC strength was calculated by first assigning a vector of length 1 to each spike with the same phase as the LFP point corre-sponding to the spike time and next computing the mean vector across all vectors corresponding to a given
trial (see the “Methods” section for details). The SPC
was determined for the time interval of 250–850 ms
spikes. An index (SPC index) was used to quantify the coupling strength by comparing the SPC strength for the real signal with the SPC strength of a random signal
(see the“Methods”section for details).
Next, we filtered the LFPs into overlapping 4 Hz win-dows stepped by 1 Hz. For each frequency window, we calculated the SPC index in the two attention conditions.
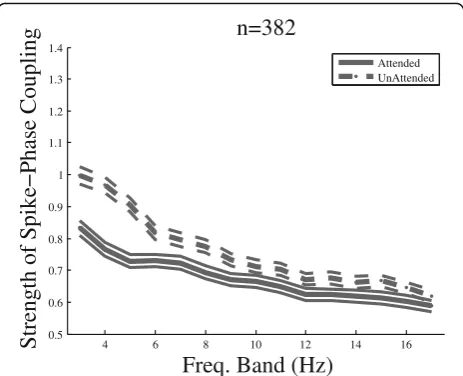
Figure 3 shows the SPC index for all pairs of sites
re-corded from the three monkeys in the two attention
conditions across different frequency bands. Thex-axis
rep-resents the center of the frequency bands, and they-axis
re-flects the corresponding value of the SPC index. The SPC index is significantly above zero for both attended and
un-attended conditions in all 3–17 Hz frequency bands (p≪
0.001ttest,p> 0.1 Kolmogorov-Smirnov test for each bin,
corrected for multiple comparisons). This shows that MUA spikes are locked to specific phases of the LFP within
frequencies below 18 Hz independently of the attention condition. The SPC index in the unattended condition is significantly larger than the attended condition for those frequency bands that are centered between 3 and 8 Hz
(17%,p< 0.01 pairedttest, corrected for multiple
compari-sons). This indicates that attention is correlated with a de-crease of SPC in the frequency bands below approximately
7 Hz. The same analyses conducted on each monkey’s data
separately showed a similar effect within the 3–8 Hz
fre-quency range, with 19, 17, and 6% higher SPC index in the unattended compared to the attended condition for mon-keys H, C, and T, respectively.
One concern might be that the SPC difference be-tween the two attention conditions is due to the differ-ence between the power of low-frequency LFP in the attended and unattended condition. Since attention sup-presses the power of low-frequency LFP oscillations
Phase decoupled
Phase coupled
neuron 1 neuron 2
Attended
Unattended
A
B
−0.03 −0.02 −0.01 0 0.01 0.02
Time after stimulus onset (ms)
t1 t2
−0.03 −0.02 −0.01 0 0.01 0.02
Time after stimulus onset (ms)
3-7 Hz LFP (mv)
200 400 600 800
0 0.2 0.4 0.6 0.8 1
Normed MU
0.01 0.03 0.05 0.07 0.09 0
15 30
Number of sites
Peak to peak amplitudes
(3-7 Hz)(mv) Normed MU
3-7 Hz LFP (mv)
200 400 600 800
0.2 0.4 0.6 0.8 1
Fig. 2Example of spike-phase coupling (SPC).aAn illustration of how SPC leads to inter-neuronal synchrony. Oscillatory curves on the top illustrate two cycles of a hypothetical LFP signal in a narrow frequency band. The spiking activity of two example neurons (artificial data) is shown in red and blue in two synchronized (spikes coupled to the LFP trough) and desynchronized (spikes distributed across LFP phases) conditions.b
(shown by us [38] and others [19]), this might reduce the signal-to-noise ratio of the low-frequency LFP in the attended condition and therefore the accuracy of the phase estimation, compared to the unattended condi-tion. To test this, we focused on a subset of trials that reflect an opposite effect of attention on low-frequency power, i.e., where attended trials have a higher mean low-frequency power compared to unattended trials. This analysis removes a considerable number of trials;
therefore, we focused on monkey H’s data, where the
animal performed enough number of trials. For each site, we selected those trials which lead to an
enhance-ment of LFP power in the 2–6 Hz band (which
under-goes the maximum SPC modulation) compared to the unattended condition averaged across trials with all
mo-tion direcmo-tions (see the “Methods” section for details).
The data show a statistically significant enhancement of
LFP power in the attended condition (p< 10−6; sign test
across sites). Comparing the SPC index using the above approach based on this selection of trials again led to an enhancement of the SPC index in the unattended
com-pared to the attended condition (15%, p< 0.01; pairedt
test across site pairs).
Furthermore, it could be argued that the suppression of SPC in the attended condition is simply induced by the increase of firing rate by attention. Assuming a given
neuron’s membrane potential that oscillates within a
low-frequency band and only a mild voltage input to the neuron, the cell is able to generate an action potential only in a small time window around the high-excitability
phase of its membrane oscillation. Obviously, an
en-hancement in the neuron’s input voltage allows the cell
membrane to reach the firing threshold voltage within a longer time window, consequently allowing the spikes to fire in a wider range of phases (equivalent to a suppres-sion of SPC). To evaluate if the decrease of SPC that we observed due to attention is a side effect of the atten-tional enhancement of firing rate, we computed the
at-tentional modulation of SPC (unattended SPC index−
attended SPC index) and the attentional modulation of
spike rate (AI) (see the“Methods”section for details) for
different recording sites. The correlation of the two pa-rameters was next computed across sites for each of the
frequency bands (as described in Fig.3). This showed no
significant correlation between the attentional modula-tion of spike rates and SPC index, within any of the
fre-quency bands (Spearman R= 0.04 ± 0.08 (SD), p> 0.05).
This suggests not only that the attentional suppression of SPC observed here is not caused by an increase of spike rate by attention but also that the neural mechan-ism underlying this attentional modulation of SPC is dis-tinct from that of the attentional enhancement of spike
rate (see the“Discussion”section).
To determine if the modulation of SPC is limited to only a specific distance between site pairs that provide the LFP and MUA, similar analyses were conducted on pairs of sites with equal horizontal distances in between, i.e., pairs of sites with one electrode in between, pairs with two elec-trodes in between, etc. Across all distances between the site pairs, SPC modulation could be found throughout the frequency bands with center frequencies between 3 and
8 Hz (Fig.4), similar to Fig.3(for data pooled across
dis-tances), indicating that SPC is modulated within the
elec-trodes as close as 305μm to as distant as 1220μm. These
results suggest that attention widely suppresses the
coup-ling between spikes and low-frequency LFPs in delta (1–
4 Hz) and theta (4–8 Hz) bands in MT, consistent with
the previous findings in other visual areas [39].
To further validate if the low-frequency component that coordinates the spikes originates within the area
MT’s local population, rather than a larger and possibly
extended structure elsewhere (transmitted by volume
conductance), we subtracted from each site’s LFP the
average LFP recorded from the neighboring sites. Using
theselocalizedLFPs, we calculated the SPC index across
attention conditions for each of the frequency bands within the range over which we have observed an
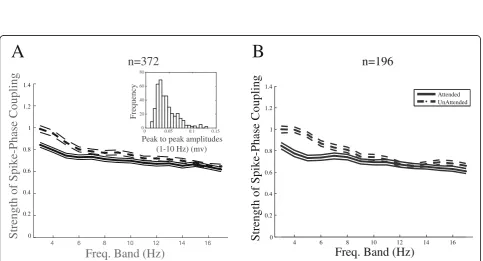
atten-tional modulation (3–8 Hz). This led to a significant
dif-ference between the SPC indices across attention
conditions for all of the above frequency bands (p< 0.05;
ttest across site pairs) (Fig.5a) (see the“Methods”
sec-tion for details). This suggests that it is a locally gener-ated low-frequency neural activity that coordinates the timing of spikes.
4 6 8 10 12 14 16
0.5 0.6 0.7 0.8 0.9 1 1.1 1.2 1.3 1.4
Freq. Band (Hz)
Strength of Spike−Phase Coupling
n=382
Attended UnAttended
4 6 8 10 12 14 16 0
0.2 0.4 0.6 0.8 1 1.2 1.4
Freq. Band (Hz)
Strength of Spike−Phase Coupling
Distance:1 (n=143)
Attended UnAttended
4 6 8 10 12 14 16 0
0.2 0.4 0.6 0.8 1 1.2 1.4
Freq. Band (Hz)
Strength of Spike−Phase Coupling
Distance:2 (n=129)
Attended UnAttended
4 6 8 10 12 14 16 0
0.2 0.4 0.6 0.8 1 1.2 1.4
Freq. Band (Hz)
Strength of Spike−Phase Coupling
Distance:3 (n=61)
Attended UnAttended
4 6 8 10 12 14 16 0
0.2 0.4 0.6 0.8 1 1.2 1.4
Freq. Band (Hz)
Strength of Spike−Phase Coupling
Distance:4 (n=49)
Attended UnAttended
Fig. 4SPC index at different low-frequency bands plotted separately for site pairs with an equal number of recording sites in between. The distance between the pairs and the number of site pairs for each distance is given above each figure
4 6 8 10 12 14 16
0 0.2 0.4 0.6 0.8 1 1.2 1.4
Freq. Band (Hz)
Strength of Spike-Phase Coupling
Attended UnAttended
4 10 12 14 16
Freq. Band (Hz)
Strength of Spike-Phase Coupling
n=372
6 8
A
B
0 0.2 0.4 0.6 0.8 1 1.2 1.4
n=196
0 0.05 0.1 0.15 0
20 40 60 80
Frequency
Peak to peak amplitudes (1-10 Hz) (mv)
Although the main effect of attentional modulation of SPC is observed in the frequency bands with the centers between 3 and 8 Hz, there are several frequency bands higher than this range that still show small differences of SPC between the two attention conditions (frequency
bands with centers of 9 and 15 Hz) (Fig. 3). However,
the effect in these bands is only marginally significant
(0.01 <p< 0.05 pairedttest, corrected for multiple
com-parisons). Thus, if we limit the analysis to sites that have a higher number of trials, the effect in these frequency bands diminishes, while the main modulation in the
fre-quency bands with centers of 3–8 Hz does not change
appreciably (Fig.5b). This suggests that the small
differ-ence between the attended and unattended SPC indices at the frequency bands above the 8 Hz band is mostly due to noise.
Locking phase is not modulated by attention
As shown in Fig. 3, MUA in MT is significantly locked
to a specific phase within the 3–17 Hz frequency bands
in each site pair, and this is true for both trials with the target inside or outside the RF. To determine whether the phases corresponding to different site pairs were similar, we extracted the locking phases for the
fre-quency band 2–6 Hz in which the SPC strength’s
modu-lation is the strongest (Fig.3) (see the“Methods”section
for details). Figure6 shows the histogram of phases that
each site pair pointed to for both attention conditions. The distribution of phases across different pairs differs significantly from the uniform distribution in both
con-ditions (p< 10−45 for both conditions; von Mises test).
The mean locking phase is 0.57 and 0.69 rad for attended and unattended conditions, respectively, and there is no statistically significant difference between
them (p> 0.1 Watson-Williams test). This suggests that
MUA spikes tend to occur mostly at a unique phase of theta LFPs independent of the attention condition.
It was shown before that attention suppresses
inter-neuronal synchrony at low frequencies [26,27].
How-ever, the neural mechanism of this modulation
has remained elusive. Here, we hypothesize that the brain uses SPC to control inter-neuronal synchrony, i.e., by de-coupling neural spikes from the population-level synap-tic activity (reflected by the LFP phase), neurons are free to fire independently of each other. We showed here that at-tention decreases SPC; however, it may be that LFP and SPC are epiphenomena reflecting the spikes and the inter-neuronal synchrony, respectively. Here, we test if the phase of the synaptic activity (reflected by LFP) or the spikes influences the other at a larger degree. Using an
ap-proach suggested previously [40], we calculated the angular
similarity of the LFP phase preceding the spikes and com-pared it to that of the LFP phase following the spikes. In case it is the phase of the LFP-linked synaptic activity that has a larger influence on the occurrence of spikes, rather than the spikes being more influential on the LFP phase, we expect a more stable LFP pattern before spikes com-pared to after spikes. This means that for the phase of the LFP-linked synaptic activity to evoke the spikes, there should be a smaller phase variability preceding spikes ra-ther than following spikes. We band pass filtered the LFPs between 1 and 10 Hz and calculated the spike-triggered LFP (STL) for 200 ms time windows centered on spike times (with the spikes and LFP coming from the same re-cording site, to avoid potential variabilities of time lags
be-tween electrodes’signals induced by the traveling of LFP
waves). Next, we calculated the instantaneous phases by
applying the Hilbert transform on each trial’s STL curve in
a given recording site and measured the phase similarity across trials for each STL time point by measuring the length of the vector given by cross-trial circular averaging. Comparison of the phase similarity preceding spikes (cor-responding to the first half of STL) to the phase similarity following spikes showed a significantly higher phase
similarity for LFPs preceding, rather than following spikes
(p< 10−5; sign test across sites from all animals) (Fig. 7a).
To further examine if it is the asymmetry of phases (differ-ent proportions of flat/steep parts) between the intervals preceding or following spikes that causes the difference in phase similarity of the two intervals, the following simula-tions were conducted: (1) We generated an artificial STL
corresponding to each trial (N= 50) in a given site (as a
simple single frequency (3.5 Hz) 200 ms sinusoid function),
where the phase instantaneous to the spike (the STL’s value
in the middle time point) equaled 0.55 rad (matching our
empirical data in Fig.6). Correspondingly, at this step, the
STLs across all trials and sites were equal. (2) The instant-aneous phases were calculated for the STLs and added by a randomly generated white noise signal ([0 1]) with the same length as the original STL, after which an additional random noise (with a 3% magnitude of the initial noise) was independently generated and summed with (a) each of the instantaneous phases preceding a spike, (b) following a spike, and (c) none of the intervals, independently in each trial, to create a higher phase variation within (a) the inter-val preceding the spikes, (b) the interinter-val following the spikes, or (c) maintain the phase variation between the in-tervals equal. (3) We finally calculated the phase similarity using the same procedure as with our empirical data across trials for each simulated site, separated for the intervals preceding and following the spike. The computed phase
similarity for each site is illustrated in Fig.7b, with each of
the noise conditions shown in a different color. This clearly
shows that a similar trial-by-trial phase variation between the intervals following and preceding spikes causes also an equal phase similarity across the two intervals, irrespective
of the asymmetry between the two intervals’phases. In line
with our hypothesis, this suggests that it is the phase of the LFP-linked synaptic activity that is more influential on the occurrence of spikes, rather than the spikes influencing this phase (equivalent to an epiphenomenal account of the phase). Therefore, the suppression of SPC by attention is an indication of a potential role of this LFP-linked synaptic activity in determining the inter-neuronal correlation.
Discussion
We investigated whether action potentials are locked to the phase of low-frequency LFPs in the extrastriate ma-caque visual cortical area MT and if spatial attention modulates this potential locking. Our data show that neuronal spike times in the MT are preferentially aligned to the falling phases of the low-frequency LFP phases and that this alignment is reduced for responses to stim-uli within the spotlight of spatial attention.
This spike-phase coupling (SPC) is consistent with the previous reports on the locking of MUA timing to the phase of ongoing low-frequency LFP in a number of dif-ferent cortical regions of macaque, such as the
hippo-campus [10], prefrontal cortex [9], and especially visual
areas including V1 [7,22] and V4 [24]. The preferred phase
of the field potential at which the MUA occurs differs across visual areas. In the primary visual area V1, MUA was
0 0.1 0.2 0.3 0.4 0.5 0.6 0.7 0.8 0.9 1
0 0.1 0.2 0.3 0.4 0.5 0.6 0.7 0.8 0.9 1
P < 10 , sign test-5
A
B
0.955 0.957 0.959 0.961
0.955 0.957 0.959 0.961
spike <-> LFP Lfp -> spike spike -> LFP
P > 0.1P << 0.01P << 0.01, sign test
Similarity of LFP phase preceding spikes
Similarity of LFP phase following spikes
shown to occur preferably at troughs [7, 22], while in the extrastriate cortex such as visual area V4, the preferred
phase is somewhat earlier in the falling phase [24]. This
similarity between the V4 and MT, areas at comparable levels of the cortical processing hierarchy suggest that the exact spike-phase alignment might depend on the level of a given area within a cortical processing pathway.
Our data show that the alignment of spikes to phases of
the 3–8 Hz frequency bands decreases with attention. This
is in line with earlier reports (e.g., [20, 39]), which found
that neurons in the visual cortex V4 lose their coupling to low frequencies (< 10 Hz) with spatial attention. They cal-culated the magnitude of locking between spikes and field
potentials by quantifying the spike-field coherence (SFC
[41]). The SFC however does not exclusively reflect the
locking of spikes to oscillation phases; rather, it computes a value between 0 and 1 for a given frequency, by comparing the power of the frequency in the spike-triggered average (STA) and the mean power of the frequency in each of the LFP segments that make up the STA. This measure how-ever does not rule out the bias to the power of a given fre-quency at different times, i.e., a spike that occurs during a high amplitude period of the LFP will have a greater influ-ence on the value of the SFC than a spike that has occurred during a low-amplitude LFP period. Therefore, the SFC re-flects the locking of spikes to both the phase and amplitude of LFPs, rather than only the phase. The SPC metric solely however considers the phases of the LFP that the spikes have occurred at and thereby directly quantifies the coup-ling of spikes and LFP phases.
The decrease of low-frequency SFC by attention has been shown to originate in the neurons of deep rather
than superficial layers [19] in area V4. We could not
look for this difference in our data due to the lack of layer information in our recordings. Also, it is not clear to what extent the stimulus onset may couple the spikes to the low-frequency LFP. In spite of our observation that SPC differs across attention conditions (irrespective of visual stimulation), and a previous report showing in V4, that SFC exists also during periods of no visual
stimulation [20], it still remains a question for future
studies, how visual stimulation could modulate the coupling of spikes to LFP phase either in V4 or MT.
Not only the spikes are locked to the phase of low fre-quencies, but the power of high-frequency oscillations is also coupled to the phase of low frequencies across many
cortical regions in humans, monkeys, and rats [7,42,43],
an effect known as phase-amplitude coupling (PAC). On the other hand, spike rate and high-frequency power have been reported to be positively correlated with each other
in the rat hippocampus [5] and monkey visual cortex [7],
including the area MT [6], but see [44] for negative
corre-lations). Therefore, our finding is consistent with our pre-vious observation of an attentional suppression of PAC in
the area MT [38]. Similarly, given the suggestion [39] that
attention decreases the locking of spikes to the low-frequency phase in the area V4, we predict that as in the MT, attention decreases PAC in the area V4 as well. It remains a question for future studies to what degree SPC influences PAC and vice versa.
Cohen and Maunsell showed that visual attention de-creases inter-neuronal correlations in the visual cortex, i.e., the correlation between the firing rate of neurons recorded simultaneously decreases when a monkey attends to a
stimulus [27]. Similarly, Mitchell et al. found that
simultan-eously recorded neurons in the area V4 of monkeys reduce their correlated low-frequency fluctuations in firing rate
when attention is directed into the RF [26]. As suggested
previously, this decrease in inter-neuronal correlations can lead to the increase of neural discrimination and
improve-ment of behavior, which are both benefits of attention [38,
45, 46]. Given the tight link between inter-neuronal
syn-chrony and LFP [47], one potential mechanism underlying
this decrease in inter-neuronal correlations might be a de-coupling of neuronal spike times to the phase of the low-frequency LFP-linked synaptic activity. Since our ana-lytical results suggest a significantly more stable pattern of LFP phase preceding, rather than following spikes, and that the low-frequency LFP is spread across plenty of
neighbor-ing cortical columns [8], the low-frequency component of
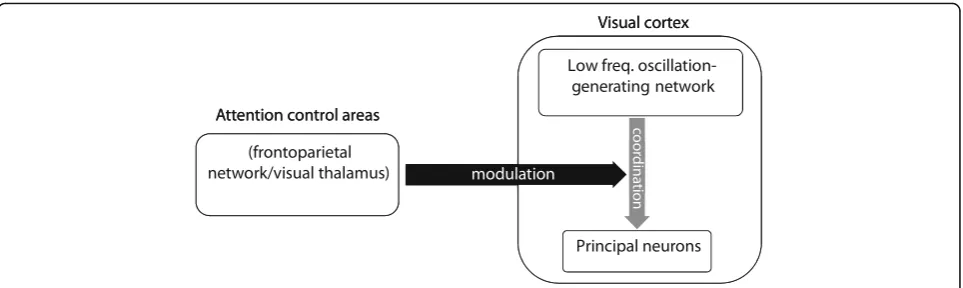
the LFP-linked population synaptic activity could be a can-didate for controlling the synchrony of neurons in different columns. One potential mechanism for this is that a regula-tory network generates the low-frequency modularegula-tory os-cillatory activity, governing the activity of the network of
principal cells [48] (reflected by the coupling of single
neuron spikes to the low-frequency LFP). The degree to which the regulatory network influences the timing of the
principal cells’ activity is presumably determined by the
strength of the synaptic inputs the regulatory network projects to the principal cells. Attention signal could
con-trol the two networks’coupling by inhibiting these
synap-ses (Fig.8). Such a low-frequency generating network has
been found before in the hippocampus, predominated by
O-LM inter-neurons (see [48] for a review). These cells
are extensively projecting to inter-neurons and principal cells (while connections in the opposite direction are sparse), activating them in an oscillatory regime. The seg-regation of the O-LM network from that of the pyramidal-basket cell recurrent circuitry (extended longi-tudinally vs. transversally, respectively relative to cortical columns) further supports the existence of a low-frequency generating network and its causal influence on principal
cells [49]. In addition to controlling the synchrony between
neurons, such a low-frequency oscillation generator may play a role in communication with the downstream areas
[24], as well as be used as a temporal window for local
Identification of the cell types constituting the low-frequency generating neural network and how segre-gated they are within the visual cortex local circuitry, as well as the brain region/mechanism via which attention
modu-lates this network’s projection on the principal cells, needs
to be addressed by future studies. There are different cortical and subcortical regions known to be involved in producing neural signatures of attention in the visual cortex. Among the cortical areas, FEF and LIP have been reported to induce
attentional effects in the extrastriate visual areas [52, 53],
and in the subcortical regions, the pulvinar has been ob-served to mediate attentional effects on the visual cortex
[54]. These areas, as well as the neuromodulatory system
[55], are prime candidates for the attentional modulation of
SPC in areas of the visual cortex.
Conclusions
In summary, our data show that spike-LFP phase coupling exists along the dorsal visual pathway and that selective attention loosens this coupling. We finally suggest that
at-tention harnesses this spike-phase coupling to
de-synchronize neurons and thereby enhance the neural representation of the attended stimuli.
Acknowledgements
We would like to thank Laura Busse and Steffen Katzner for sharing the data they recorded from monkeys C and T. Special thanks to Marlene Cohen for the insightful comments on an earlier version of the manuscript. We appreciate Dirk Prüsse, Leonore Burchardt, and Ralf Brockhausen’s expert technical assistance. The authors declare no competing financial interests.
Funding
This project was supported by the grants of the Deutsche
Forschungsgemeinschaft through the Collaborative Research Center 889“Cellular Mechanisms of Sensory Processing”to ST (Project C04) and the Federal Ministry of Education and Research (BMBF) of Germany under grant number 01GQ1005C.
Availability of data and materials
The datasets used and/or analyzed during the current study are available from the corresponding authors on reasonable request.
Authors’contributions
MRD and ST designed the experiment. MRD recorded the data. ME analyzed the data. ME, MRD, and ST interpreted the data. ME, MRD, and ST wrote the paper. All authors read and approved the final manuscript.
Ethics approval and consent to participate
All animal procedures of this study have been approved by the responsible regional government office (Niedersaechsisches Landesamt fuer
Verbraucherschutz und Lebensmittelsicherheit (LAVES)) under the permit numbers 33.42502/08-07.02 and 33.14.42502-04-064/07. The animals were group-housed with other macaque monkeys in the facilities of the German Primate Center in Goettingen, Germany, in accordance with all applicable German and European regulations. The German Primate Center has several staff veterinarians that regularly monitor and examine the animals and con-sult on procedures (see the“Methods”section for more details).
Competing interests
The authors declare that they have no competing interests.
Publisher’s Note
Springer Nature remains neutral with regard to jurisdictional claims in published maps and institutional affiliations.
Author details
1Cognitive Neurobiology Laboratory, School of Cognitive Sciences, Institute for Research in Fundamental Sciences (IPM), Niavaran, P.O. Box 19395-5746, Tehran, Iran.2Biomedical Engineering Department, School of Electrical Engineering, Iran University of Science and Technology (IUST), Narmak, Tehran 16846-13114, Iran.3Cognitive Neuroscience Laboratory, German Primate Center–Leibniz Institute for Primate Research, Goettingen, Germany.4Faculty of Biology and Psychology, University of Goettingen, Goettingen, Germany.5Bernstein Center for Computational Neuroscience, Goettingen, Germany.6Leibniz-ScienceCampus Primate Cognition, Goettingen, Germany.
Received: 21 April 2018 Accepted: 19 July 2018
References
1. Maunsell JHR, Van Essen DC. Functional properties of neurons in middle temporal visual area of the macaque monkey. I. Selectivity for stimulus direction, speed, and orientation. J Neurophysiol. 1983;49:1127–47. 2. Snowden RJ, Treue S, Andersen RA. The response of neurons in areas V1
and MT of the alert rhesus monkey to moving random dot patterns. Exp Brain Res. 1992;88(2):389–400.
3. Buzsáki G, Anastassiou CA, Koch C. The origin of extracellular fields and currents—EEG, ECoG, LFP and spikes. Nat Rev Neurosci. 2012;13:407–20.
4. Katzner S, Nauhaus I, Benucci A, Bonin V, Ringach DL, Carandini M. Local origin of field potentials in visual cortex. Neuron. 2009;61:35–41.
5. Csicsvari J, Jamieson B, Wise KD, Buzsáki G. Mechanisms of gamma oscillations in the hippocampus of the behaving rat. Neuron. 2003;37:311–22.
6. Liu J, Newsome WT. Local field potential in cortical area MT: stimulus tuning and behavioral correlations. J Neurosci. 2006;26:7779–90.
7. Whittingstall K, Logothetis NK. Frequency-band coupling in surface EEG reflects spiking activity in monkey visual cortex. Neuron. 2009;64:281–9. 8. Buzsaki G, Draguhn A. Neuronal oscillations in cortical networks. Science.
2004;304:1926–9.
9. Siegel M, Warden MR, Miller EK. Phase-dependent neuronal coding of objects in short-term memory. PNAS. 2009;106:21341–6.
10. Sirota A, Montgomery S, Fujisawa S, Isomura Y, Zugaro M, Buzsaki G. Entrainment of neocortical neurons and gamma oscillations by the hippocampal theta rhythm. Neuron. 2008;60:683–97.
11. Baluch F, Itti L. Mechanisms of top-down attention. Trends Neurosci. 2011;34:210–24.
12. Maunsell JHR, Treue S. Feature-based attention in visual cortex. Trends Neurosci. 2006;29:317–22.
13. Petersen SE, Posner MI. The attention system of the human brain: 20 years after. Annu Rev Neurosci. 2012;35:73–89.
14. Roelfsema PR, Lamme VAF, Spekreijse H. Object-based attention in the primary visual cortex of the macaque monkey. Nature. 1998;395:376–81. 15. Treue S, Trujillo JCM. Feature-based attention influences motion processing
gain in macaque visual cortex. Nature. 1999;399:575–9.
16. Katzner S, Busse L, Treue S. Attention to the color of a moving stimulus modulates motion-signal processing in macaque area MT: evidence for a unified attentional system. Front Syst Neurosci. 2009;3:12.
17. Treue S. Visual attention: the where, what, how and why of saliency. Curr Opin Neurobiol. 2003;13:4.
18. Schroeder CE, Lakatos P. Low-frequency neuronal oscillations as instruments of sensory selection. Trends Neurosci. 2009;32:9–18.
19. Buffalo EA, Fries P, Landman R, Buschman TJ, Desimone R. Laminar differences in gamma and alpha coherence in the ventral stream. PNAS. 2011;108:11262–7. 20. Fries P, Womelsdorf T, Oostenveld R, Desimone R. The effects of visual
stimulation and selective visual attention on rhythmic neuronal synchronization in macaque area V4. J Neurosci. 2008;28:4823–35. 21. Chalk M, Herrero JL, Gieselmann MA, Delicato LS, Gotthardt S, Thiele A.
Attention reduces stimulus-driven gamma frequency oscillations and spike field coherence in V1. Neuron. 2010;66:114–25.
22. Lakatos P, Karmos G, Mehta AD, Ulbert I, Schroeder CE. Entrainment of neuronal oscillations as a mechanism of attentional selection. Science. 2008; 320:110–3.
23. Landau AN, Fries P. Attention samples stimuli rhythmically. Curr Biol. 2012; 22:1000–4.
24. Liebe S, Hoerzer GM, Logothetis NK, Rainer G. Theta coupling between V4 and prefrontal cortex predicts visual short-term memory performance. Nat Neurosci. 2012;15:456–62.
25. Emadi N, Rajimehr R, Esteky H. High baseline activity in inferior temporal cortex improves neural and behavioral discriminability during visual categorization. Front Syst Neurosci. 2014;8:218.
26. Mitchell JF, Sundberg KA, Reynolds JH. Spatial attention decorrelates intrinsic activity fluctuations in macaque area V4. Neuron. 2009;63:879–88. 27. Cohen MR, Maunsell JHR. Attention improves performance primarily by
reducing interneuronal correlations. Nat Neurosci. 2009;12:1594–600. 28. Roelfsema PR, Treue S. Basic neuroscience research with nonhuman
primates: a small but indispensable component of biomedical research. Neuron. 2014;82:1200–4.
29. Berger M, Calapai A, Stephan V, Niessing M, Burchardt L, Gail A, Treue S. Standardized automated training of rhesus monkeys for neuroscience research in their housing environment. J Neurophysiol. 2017;119:796–807. 30. Calapai A, Berger M, Niessing M, Heisig K, Brockhausen R, Treue S, Gail A. A
cage-based training, cognitive testing and enrichment system optimized for rhesus macaques in neuroscience research. Behav Res Methods. 2017;49:35–45. 31. Pfefferle D, Plümer S, Burchardt L, Treue S, Gail A. Assessment of stress responses
in rhesus macaques (Macaca mulatta) to daily routine procedures in system neuroscience based on salivary cortisol concentrations. PLoS One. 2018;13: e0190190.
32. Busse L, Katzner S, Treue S. Temporal dynamics of neuronal modulation during exogenous and endogenous shifts of visual attention in macaque area MT. Proc Natl Acad Sci U S A. 2008;105:16380–5.
33. Esghaei M, Daliri MR. Decoding of visual attention from LFP signals of macaque MT. PLoS One. 2014;9:6.
34. Treue S, Maunsell JH. Effects of attention on the processing of motion in macaque middle temporal and medial superior temporal visual cortical areas. J Neurosci. 1999;19:7591–602.
35. Nelson MJ, Pouget P, Nilsen EA, Patten CD, Schall JD. Review of signal distortion through metal microelectrode recording circuits and filters. J Neurosci Methods. 2008;169:141–57.
36. Delorme A, Makeig S. EEGLAB: an open source toolbox for analysis of single-trial EEG dynamics including independent component analysis. J Neurosci Methods. 2004;134:9–21.
37. Vinck M, van Wingerden M, Womelsdorf T, Fries P, Pennartz CM. The pairwise phase consistency: a bias-free measure of rhythmic neuronal synchronization. Neuroimage. 2010;51:112–22.
38. Esghaei M, Daliri MR, Treue S. Attention decreases phase-amplitude coupling, enhancing stimulus discriminability in cortical area MT. Front Neural Circuits. 2015;9:82.
39. Fries P, Reynolds JH, Rorie AE, Desimone R. Modulation of oscillatory neuronal synchronization by selective visual attention. Science. 2001;291:1560–3. 40. Siapas AG, Lubenov EV, Wilson MA. Prefrontal phase locking to
hippocampal theta oscillations. Neuron. 2005;46:141–51.
41. Fries P, Roelfsema PR, Engel AK, Konig P, Singer W. Synchronization of oscillatory responses in visual cortex correlates with perception in interocular rivalry. Proc Natl Acad Sci U S A. 1997;94:12699–704. 42. Canolty RT, Edwards E, Dalal SS, Soltani M, Nagarajan SS, Kirsch HE, Berger
MS, Barbaro NM, Knight RT. High gamma power is phase-locked to theta oscillations in human neocortex. Science. 2006;313:1626–8.
43. Tort ABL, Komorowski RW, Manns JR, Kopell NJ, Eichenbaum H. Theta-gamma coupling increases during the learning of item-context associations. Proc Natl Acad Sci U S A. 2009;106:20942–7.
44. Ray S, Maunsell JHR. Different origins of gamma rhythm and high-gamma activity in macaque visual cortex. PLoS Biol. 2011;9:e1000610.
45. Astrand E, Wardak C, Baraduc P, Ben Hamed S. Direct two-dimensional access to the spatial location of covert attention in macaque prefrontal cortex. Curr Biol. 2016;26:1699–704.
46. Averbeck BB, Latham PE, Pouget A. Neural correlations, population coding and computation. Nat Rev Neurosci. 2006;7:358–66.
47. Denker M, Roux S, Lindén H, Diesmann M, Riehle A, Grün S. The local field potential reflects surplus spike synchrony. Cereb Cortex. 2011;21:2681–95. 48. Kopell N, Börgers C, Pervouchine D, Malerba P, Tort A. Gamma and theta rhythms in biophysical models of hippocampal circuits. In: Hippocampal microcircuits. New York: Springer; 2010. p. 423–57.
49. Tort AB, Rotstein HG, Dugladze T, Gloveli T, Kopell NJ. On the formation of gamma-coherent cell assemblies by oriens lacunosum-moleculare interneurons in the hippocampus. Proc Natl Acad Sci. 2007;104:13490–5. 50. Mizuseki K, Sirota A, Pastalkova E, Buzsáki G. Theta oscillations provide
temporal windows for local circuit computation in the entorhinal-hippocampal loop. Neuron. 2009;64:267–80.
51. Burgess N, O’Keefe J. Models of place and grid cell firing and theta rhythmicity. Curr Opin Neurobiol. 2011;21:734–44.
52. Moore T, Armstrong KM. Selective gating of visual signals by microstimulation of frontal cortex. Nature. 2003;421:6921.
53. Saalmann YB, Pigarev IN, Vidyasagar TR. Neural mechanisms of visual attention: how top-down feedback highlights relevant locations. Science. 2007;316:1612–5.
54. Saalmann YB, Pinsk MA, Wang L, Li X, Kastner S. The pulvinar regulates information transmission between cortical areas based on attention demands. Science. 2012;337:753–6.