Please cite this article as: M. Asgari, S. Tariverdilo, Investigating The Seismic Response of Structural Walls Using Nonlinear Static and Incremental Dynamic Analyses, International Journal of Engineering (IJE), TRANSACTIONS B: Applications Vol. 30, No. 11, (November 2017) 1691-1699
International Journal of Engineering
J o u r n a l H o m e p a g e : w w w . i j e . i rInvestigating The Seismic Response of Structural Walls Using Nonlinear Static and
Incremental Dynamic Analyses
M. Asgari, S. Tariverdilo*
Urmia University, Faculty of Engineering, Urmia, Iran
P A P E R I N F O
Paper history: Received 14 June 2017
Received in revised form 11 July 2017 Accepted 08 September 2017
Keywords: Bearing Wall System Building Frame System Special Shear Wall Ordinary Shear Wall Incremental Dynamic Analysis
A B S T R A C T
Structural walls commonly used as efficient structural elements to resist lateral and vertical loads. Diverse performance of bearing wall system in past earthquakes, motivates investigation on the adequacy of current seismic design provision for these walls. This study considers seismic performance of model walls of bearing wall and building frame systems designed as ordinary and special structural walls. Performance of the model walls are evaluated through static pushover and incremental dynamic analyses. Results show superior performance of the bearing wall system, which is in odd with small response modification factor given in the current design codes.
doi: 10.5829/ije.2017.30.11b.09
NOMENCLATURE
f
A Floor area R Response modification factor
w
A Wall area t thikness
c
E concrete modulus of elasticity Vd Design base shear force s
E steel modulus of elasticity Vmax Maximum base shear force
c
f concrete compression strength GreekSymbols
y
f bending reinforcement yeild stress 0 Over strength factor
ys
f shear reinforcement yeild stress rebar percentage
1. INTRODUCTION1
Reinforced concrete structural walls are frequently used in multistory buildings to resist the lateral and vertical loads. Building codes (e.g. ASCE 7 [1]) considers diverse response for structural walls in the bearing wall system and building frame system. The main geometrical difference between these structural systems is the ratio of the wall area to floor area. This ratio for the bearing wall system is about 5-6%, while for the building frame system is about 1-2%. In fact while
*Corresponding Author’s Email: [email protected] (S. Tariverdilo)
structural walls in the building frame system is only part of lateral force resisting system, in the bearing wall system they are also part of vertical force resisting system.
damage in the bearing walls. Damages includes but not limited to crushing and spalling of concrete and buckling of vertical reinforcement [3]. This under- performance again attracted attention of researchers to the seismic performance of the bearing wall systems (common in Chile) especially in comparison with the building frame system which is more common in the United States.
Paulay [4] noting that the yield displacement of structural walls is insensitive to the reinforcement area, showed that it is possible to distribute different fraction of lateral loads to different elements with disregard for element stiffness, where calculations is accompanied with large errors in the element stiffness estimation.
Dashti and Dhakal [5] simulated seismic performance of structural walls designed using NZS:3101-2006 [6], ACI-318-11 [7] and EC8 [8]. They found that smaller confinement length requirement in EC8 is accompanied with substantial reduction in curvature and displacement ductility of the walls designed by this code, while the performance of the walls designed according to ACI-318 and NZS:3101 seem satisfactory. This sensitivity of the performance to the confinment is in odd with the findings of Wallace and Moehle [2].
Islam and Saito [9] developing an estimate of confinement requirements in the structural walls, proposed a method for seismic retrofit of the structural walls using carbon fiber sheets.
Dhakal et al. [10] developing different approach for modeling of shear walls, found that commonly accepted hypothesis of plane sections remain plane after deformation, is not applicable for large drifts. They also noted that floor-slab interaction with structural wall and shear-flexure interaction could have large effect on the response.
Seo et al. [11] developing seismic fragility curves for drift limits associated with different performance levels of FEMA 356 [12], compared the seismic performance of structural walls as evaluated using FEMA 356 and Los Angeles Tall Building Structural Design Council approaches. They find that the first and second floors are the most vulnerable stories. They also reported up to 54% underestimation of the drifts as evaluated by response spectrum method in comparison with nonlinear response history method.
Creagh et al. [13] experimentally investigated the effect of loading history on the response of the shear wall boundary elements. They concluded that pre-tensioning due to cyclic loading, which leads to yielding of reinforcing bars could have devastating effect on the cyclic response of the member.
Parra and Mohle [14] investigated the lateral buckling mechanism of structural walls. They concluded that crushing of concrete rather than
softening due to tensile loading triggers the lateral buckling of the shear wall.
Wallace [15] reviewing observed damages of structural walls in Chile 2010 and New Zealand 2011 pointed out some sources for this design inadequacies. Possible reasons for this inferior performance include, underestimating the need for confinement in boundary elements (especially in nonsymmetric walls), splice of longitudinal bars leading to smaller plastic hinge length, brittle failure of structural walls in compression controlled state and buckling of longitudinal reinforcements.
Hagen [16] used ASCE 41-06 [17] analysis methods to study the performance of a 6 stories office building with lateral load resisting system comprised of slender structural walls. He found satisfactory performance meting the basic safety objective of ASCE 41-06.
Gogus and Wallace [18] investigated the seismic safety of reinforced concrete walls adopting FEMA P695 [19] methodology. They considered 20 special and 20 ordinary archetypes designed according to ASCE 7 and ACI 318 requirements. They evaluated adjusted collapse margin ratio for these archetypes using incremental dynamic analysis method. They concluded that for archetype with height to length ratio larger than 3, the response modification coefficients in ASCE 7 could be increased. Their results also indicate that the increase in the axial load of the structural wall does not have meaningful impact on the seismic safety of the archetypes. They also reported good displacement ductility even for walls with high axial load (with axial stress on the order of 0.2fc) [20]. These findings show
good sesimic safety of the structural walls and the possiblity for increase in their response modification factor.
Tiong et al. enhanced seismic performance of low ductility precast walls employing base isolation [21]. They reported low efficiency of base isolation in improving sesimic behavior of these types of structures.
Tiong et al. [21] developed a model for seismic performance of lap spliced columns and studied the effect of lap splice on the seismic performance of reinforced concrete frame structures. They concluded that lap splice significantly increases the probability of exceeding colapse limit state.
2. MODELING
Analyses are done employing OpenSees [22] finite element program, which provides an open source platform with extensive material and element library. Shear walls are modelled using fiber beam-column element nonlinearBeamColumn in OpenSees element library. Using enough number of Gauss points along member length, this element is able to capture spread of plasticity along member length. Fiber section discretization of the wall section employs concrete01 uniaxial material property for concrete and Steel02 uniaxial material property for reinforcing bars. These material properties are numerically inexpansive and suitable for studing the nonlinear beahvior in structures with extensive cracking.
There are more sophisticated models for concrete confinement in the literature, however as noted by Wallace and Moehle [2], it is anticipated that confinement will not have large impact on the response of structural walls with symmetrical geometry and reinforcement arrangement. For this reason, simpler modified Kent-Park method is used to account for confinement. Considering aspect ratio of the model walls, flexure controls the response and there is no possibility of shear failure. Existing elements in the OpenSees library are not able to account for the flexure-shear interaction in cyclic loading. For this reason and considering also the aspect ratio of the model walls, this study ignores flexure-shear interaction.
3. VERIFICATION
To verify nonlinear modeling approach, wall RW2 from experimental tests of Thomsen and Wallace is used [23]. Figure 1 gives geometry, reinforcement and loading arrangement of the specimen. Lateral load on the specimen is applied via a single concentrated load at top of the specimen. Stiff pedestal (Figure 1) which is used to anchor the specimen to the strong floor also acts as fixed foundation for the wall. The wall is a one-quarter scale of actual wall which is loaded as cantilever beam with constant axial load of about 0.07fcAg.
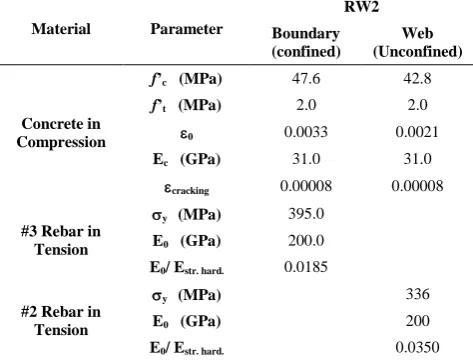
Table 1 give material properties used in OpenSees simulations. For this simulation to achieve better approximation of actual response, cracking in concrete is modeled employing Concrete02 material property. nonlinearBeamColumn in OpenSees element library is used and the wall is simulated using 4 elements and each element with 5 Gauss points.
Figure 2 compares the experimental results with the analytical model. As could be seen, there is a good correlation in terms of strength and pinching between hysteretic response of the specimen and analytical simulation.
4. MODEL WALLS
Structural walls are assumed to be 10 stories with typical length and story height of 4 and 3.5 m. The walls are designed to comply with seismic design category C requirements of ASCE/SEI 7-10 and ACI 318-14. Design is done using uniform and lumped bars arrangements. The walls designed as special or ordinary structural wall as part of two seismic force resisting systems: the building frame system (BFS) and the bearing wall system (BWS).
Figure 1. Section details of analytical RW2 [25]
(a)
(b)
Figure 2. Comparison between experimental and numerical
results, a) experimental results [23], b) numerical analysis (this study).
-80 -60 -40 -20 0 20 40 60 80
-200 -150 -100 -50 0 50 100 150 200
Top Displacement (mm)
L
at
er
al
L
o
ad
(k
TABLE 1. Numerical values of the parameters used in OpenSees model for verification
Material Parameter
RW2
Boundary (confined)
Web (Unconfined)
Concrete in Compression
f’c (MPa) 47.6 42.8
f’t (MPa) 2.0 2.0
0 0.0033 0.0021
Ec (GPa) 31.0 31.0
cracking 0.00008 0.00008
#3 Rebar in Tension
y (MPa) 395.0
E0 (GPa) 200.0
E0/ Estr. hard. 0.0185
#2 Rebar in Tension
y (MPa) 336
E0 (GPa) 200
E0/ Estr. hard. 0.0350
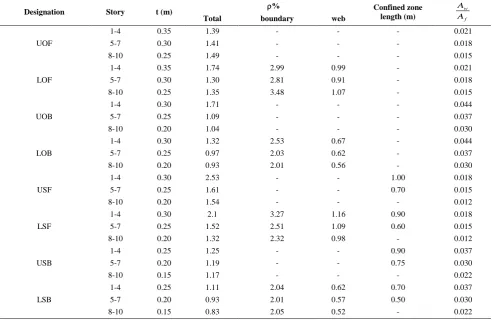
Specifications of the walls including wall designation, seismic and gravitational tributary area, design response modification coefficient and base shear are tabulated in Table 2. Material properties given in Table 3. Assumed uniform dead and live loads are 6 and 2 KN/m2, respectivley. Design information for each model wall are presented in Table 4. Each wall element is simulated using 10 elements and each element with 5 Gauss points.
5. RESULTS
5. 1. Nonlinear Static Analysis To investigate the
nonlinear behavior of the structural walls, pushover analysis is used with an inverted-triangular lateral load
pattern. Figure 3 shows the results of pushover analyses for the model walls. As could be seen, for the walls with similar design ductility and seismic force resisting system, cases with the lumped distribution of longitudinal reinforcement have slightly larger ductility than those with uniform distribution.
Table 5 also gives displacement ductility evaluated for each model as ratio of drift at descending branch corresponding to 15 percent reduction in strength to yield displacement. As it is evident, changing the distribution of the reinforcements from lumped to uniform has largest effect in the walls designed as BFS, with change of as much as 59 percent (from UOF to LOF), while the change in the displacement ductility for the walls designed as BWS is negligible.
Further examination of Figure 3 also shows that the model walls designed as BWS, generally provide poor ductility as compared to walls designed as BFS. Interesting point is that the model walls of BWS designed as special shear walls have smaller displacement ductility compared to the walls designed as ordinary wall. Both of these observations could be explained by considering the value of axial stress on the walls. Larger number of walls in the case of BWS and larger response modification factor for the walls designed as special structural wall, gives rise to smaller thickness of the wall and considering that all of the walls have nearly same vertical load, this leads to larger axial stress on the wall. As expected larger axial stress on the wall reduces the available ductility. Table 5 also gives target displacements for the model walls evaluated using ASCE/SEI 41 displacement method. Large stiffness of the walls resulted in relatively small target displacements and consequently small or even no strength deterioration is evident for displacements about structure's target displacement.
TABLE 2. Designation, seismic force resisting system, design base shear and response modification coefficients of the models.
Notations: Building frame system (BFS), Bearing wall system (BWS), Ordinary shear wall (OSW), Special shear wall (SSW)
LSB USB
LSF USF
LOB UOB
LOF UOF
Designation
Lumped Uniform
Lumped Uniform
Lumped Uniform
Lumped Uniform
Bar arrangement
(BWS) (BWS)
(BFS) (BFS)
(BWS) (BWS)
(BFS) (BFS)
Building system
SSW SSW
SSW SSW
OSW OSW
OSW OSW
Resisting system
30 30
30 30
30 30
30 30
Grav. Trib. area (m2)
30 30
67.5 67.5
30 30
67.5 67.5
Seis. Trib. area (m2)
5 5
6 6
4 4
5 5
R
7597 7597
6614 6614
10124 10124
8919 8919
Vd (kN)
TABLE 3. Material properties considered in this study
fc (MPa) Ec (GPa) fy(MPa) fys (MPa) Es (GPa)
28 26.46 400 300 199.99
TABLE 4. Design information of the model walls
Designation Story t (m) % Confined zone
length (m) f
w A A
Total boundary web
UOF
1-4 0.35 1.39 - - - 0.021
5-7 0.30 1.41 - - - 0.018
8-10 0.25 1.49 - - - 0.015
LOF
1-4 0.35 1.74 2.99 0.99 - 0.021 5-7 0.30 1.30 2.81 0.91 - 0.018 8-10 0.25 1.35 3.48 1.07 - 0.015
UOB
1-4 0.30 1.71 - - - 0.044
5-7 0.25 1.09 - - - 0.037
8-10 0.20 1.04 - - - 0.030
LOB
1-4 0.30 1.32 2.53 0.67 - 0.044 5-7 0.25 0.97 2.03 0.62 - 0.037 8-10 0.20 0.93 2.01 0.56 - 0.030
USF
1-4 0.30 2.53 - - 1.00 0.018 5-7 0.25 1.61 - - 0.70 0.015
8-10 0.20 1.54 - - - 0.012
LSF
1-4 0.30 2.1 3.27 1.16 0.90 0.018 5-7 0.25 1.52 2.51 1.09 0.60 0.015 8-10 0.20 1.32 2.32 0.98 - 0.012
USB
1-4 0.25 1.25 - - 0.90 0.037 5-7 0.20 1.19 - - 0.75 0.030
8-10 0.15 1.17 - - - 0.022
LSB
1-4 0.25 1.11 2.04 0.62 0.70 0.037 5-7 0.20 0.93 2.01 0.57 0.50 0.030 8-10 0.15 0.83 2.05 0.52 - 0.022
(a)
(b)
(c)
(d)
Figure 3. Results of pushover analyses for different model
walls analysis 0 0.05 0.1 0.15 0.2
0 100 200 300 400 500 600 700 800 900
Drift
B
as
e Sh
ear
(k
N)
UOB USB
0 0.05 0.1 0.15 0.2 0
200 400 600 800 1000 1200 1400
Drift
B
as
e Sh
ear
(k
N)
UOF USF
0 0.05 0.1 0.15 0.2
0 100 200 300 400 500 600 700 800 900
Drift
B
as
e Sh
ear
(k
N)
LOB LSB
0 0.05 0.1 0.15 0.2
0 200 400 600 800 1000 1200
Drift
B
as
e Sh
ear
(k
N)
TABLE 5. Results of pushover analyses.
Designation Drift at target displacement Vmax (kN) Drift at 0.85Vmax Displacement ductility 0
UOF 0.0031 1088 0.17 18.9 1.39
LOF 0.0030 1155 0.27 30.1 1.41
UOB 0.0021 806 0.16 17.8 1.59
LOB 0.0021 869 0.18 20.1 1.72
USF 0.0031 1177 0.26 29.0 1.42
LSF 0.0031 1192 0.33 36.8 1.44
USB 0.0024 616 0.11 12.3 1.62
LSB 0.0023 622 0.12 13.4 1.64
As could be seen, performance at target displacement will be essentially linear, which is an indication of design adequacy. As discussed in the previous paragraphs, while changing design ductility from ordinary to special, greatly improves ductility in the BFS, this is not the case for the BWS. On the other hand, the walls in BWS have larger over-strength values, which is mainly due to adoption of code's minimum dimension and reinforcement in the design.
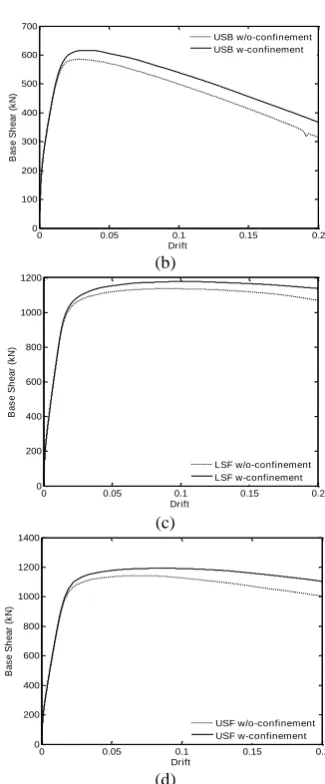
Figure 4 depicts the effect of confinement on the post peak response of the different walls. As it is evident, confinement is able to improve post peak response of the shear walls in BFS, while it has no significant impact on the walls in BWS. This is mainly due to smaller confinement length (Table 4) and smaller wall thickness in the BWS. The resulting small area of confined concrete is unable to significantly affect the nonlinear response of the wall.
5. 2. Incremental Dynamic Analysis (IDA) To
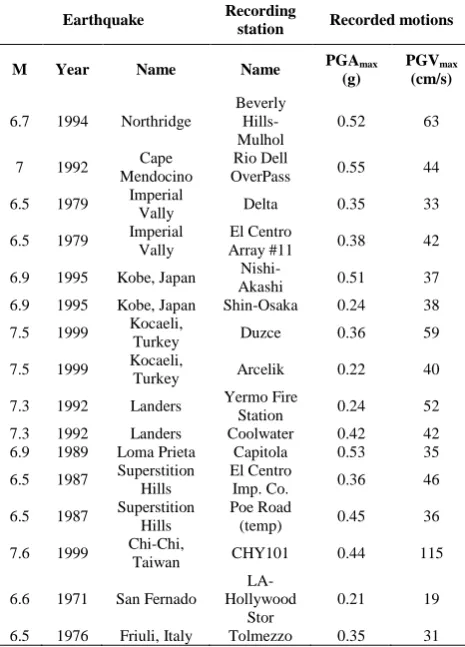
develop fragility curves, incremental dynamic analyses (IDA) are done on the model structures. Analyses are done for sixteen far field ground motions listed in Table 6. These ground motion records have been selected from the list of far field ground motions suggested by FEMA P695 [19]. As could be seen, for some events, the list includes two records.
(a)
(b)
(c)
(d)
Figure 4. Effect of confinement for different model walls
designed as special shear wall
Due to change in the record stations, in FEMA P695 these records are assumed as independent ones and consequently it is anticipated that their use will not introduce bias in the results.
0 0.05 0.1 0.15 0.2
0 100 200 300 400 500 600 700
Drift
B
as
e Sh
ear
(k
N)
LSB w/o-confinement LSB w-confinement
0 0.05 0.1 0.15 0.2
0 100 200 300 400 500 600 700
Drift
B
as
e Sh
ear
(k
N)
USB w/o-confinement USB w-confinement
0 0.05 0.1 0.15 0.2
0 200 400 600 800 1000 1200
Drift
B
as
e Sh
ear
(k
N)
LSF w/o-confinement LSF w-confinement
0 0.05 0.1 0.15 0.2
0 200 400 600 800 1000 1200 1400
Drift
B
as
e Sh
ear
(k
N)
TABLE 6. List of ground motion records used in IDA analyses
Earthquake Recording
station Recorded motions
M Year Name Name PGAmax
(g)
PGVmax
(cm/s)
6.7 1994 Northridge
Beverly Hills-Mulhol
0.52 63
7 1992 Cape Mendocino
Rio Dell
OverPass 0.55 44 6.5 1979 Imperial
Vally Delta 0.35 33 6.5 1979 Imperial
Vally
El Centro
Array #11 0.38 42 6.9 1995 Kobe, Japan Akashi Nishi- 0.51 37 6.9 1995 Kobe, Japan Shin-Osaka 0.24 38 7.5 1999 Kocaeli,
Turkey Duzce 0.36 59 7.5 1999 Kocaeli,
Turkey Arcelik 0.22 40 7.3 1992 Landers Yermo Fire
Station 0.24 52 7.3 1992 Landers Coolwater 0.42 42 6.9 1989 Loma Prieta Capitola 0.53 35 6.5 1987 Superstition
Hills
El Centro
Imp. Co. 0.36 46 6.5 1987 Superstition
Hills
Poe Road
(temp) 0.45 36 7.6 1999 Chi-Chi, Taiwan CHY101 0.44 115
6.6 1971 San Fernado
LA-Hollywood
Stor
0.21 19 6.5 1976 Friuli, Italy Tolmezzo 0.35 31
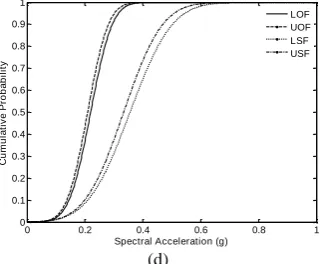
Figure 5 summarizes results of IDA in terms of fragility curves for life safety (LS) and collapse prevention (CP) limit states (due to limitation in space, results for Immediate Occupancy (IO) limit state are omitted). Drift corresponding to these limit states are assumed to be 0.5, 1 and 2 percent, respectively for IO, LS and CP limit states [17]. This figure shows meaningful increase in seismic safety due to change in the design ductility from ordinary to special structural wall in all of the model walls and limit states.
Table 7 gives 10 and 20 percent probability of failure for different model structures. As it is evident, in collapse prevention limit state, change in design ductility from ordinary to special results in about 50 percent increase in the corresponding spectral acceleration for the walls in the BFS and between 10 to 20 percent for the walls in the BWS. In the case of BWS this is in odd with the results of pushover analysis, where even there is reduction in the displacement ductility for changing design ductility from ordinary to special, as disscussed in section 5.1.
Table 7 also shows that although walls in BFS gives higher displacement ductility, they have smaller spectral acceleration corresponding to 10 and 20 percent
probability of failure (in all of the limit states), as compared to the walls in BWS.
TABLE 7. 10 and 20 percent probability of failure for the
model walls in IDA
Designation
IO LS IO
10% 20% 10% 20% 10% 20%
UOF 0.043 0.052 0.084 0.100 0.136 0.162
LOF 0.041 0.05 0.082 0.100 0.144 0.171
UOB 0.106 0.129 0.209 0.252 0.33 0.393
LOB 0.106 0.129 0.210 0.254 0.334 0.395
USF 0.085 0.100 0.166 0.200 0.199 0.244
LSF 0.087 0.103 0.176 0.209 0.211 0.26
USB 0.164 0.208 0.285 0.363 0.348 0.448
LSB 0.191 0.233 0.346 0.418 0.39 0.480
(a)
(b)
(c)
0 0.3 0.6 0.9 1.2 1.5 0 0.1 0.2 0.3 0.4 0.5 0.6 0.7 0.8 0.9 1
Spectral Acceleration (g)
Cu m u lat iv e Pr o b ab il it y LOB UOB LSB USB
0 0.1 0.2 0.3 0.4 0.5 0.6 0.7 0 0.1 0.2 0.3 0.4 0.5 0.6 0.7 0.8 0.9 1
Spectral Acceleration (g)
Cu m u lat iv e Pr o b ab il it y LOF UOF LSF UOF
0 0.3 0.6 0.9 1.2 1.5 0 0.1 0.2 0.3 0.4 0.5 0.6 0.7 0.8 0.9 1
Spectral Acceleration (g)
(d)
Figure 5. Fragility curves for the model walls, a) LS-BWS, b)
LS-BFS, c) CP-BWS, d) CP-BFS
To have a better insight on the results of IDA analyses, Figure 6 gives the median response and its scatter in terms of spectral acceleration corresponding to 16%, median and 84% fractals. Again, better seismic safety of BWS is evident in the figure for all of the limit states.
(a)
(b)
(c)
Figure 6. The spectral acceleration values for 16, 50 and 84
percent fractals for different limit states, a) IO, b) LS, c) CP
6. CONCLUSION
Seismic safety of structural walls as part of bearing wall system and building frame system designed as ordinary and special shear walls are investigated through static pushover and incremental dynamic analyses. Results confirm superior seismic safety of the bearing wall systems compared to the building frame system, which is in odd with current code prescribed response modification factor for these systems. Analyses also show that confinement have no significant impact on the response of the structural walls symmetric in reinforcement and geometry and thin in thickness.
7. REFERENCES
1. ASCE standard 7-10, Minimum design loads for buildings and other structures, American Society of Civil Engineers, (2010). 2. Wallace, J.W. and Moehle, J.P., "Ductility and detailing
requirements of bearing wall buildings", Journal of Structural Engineering, Vol. 118, No. 6, (1992), 1625-1644.
3. Lagos, R., Kupper, M., Lindenberg, J., Bonelli, P., Saragoni, R., Gueldelman, T., Massone, L., Boroschek, R. and Yanez, F., "Seismic performance of high-rise concrete buildings in chile", International Journal of High-Rise Buildings, Vol. 1, No. 3, (2012), 181-194.
4. Paulay, T., "Displacement capacity of dual reinforced concrete building systems", Pacific Conference on Earthquake Engineering, University of Canterbury, Christchurch, New Zealand, (2003).
5. Dashti, F., Dhakal, R. and , . "Comparative performance of rc shear walls designed by different standards", Advances Structural Engineering and Mechanics (ASEM13), (2013). 6. Zealand, S.N., "Concrete strucures standard, part 1: The design
of concrete strucuresed, nzs 3101: Part 1, 1995, part 2", Commentasry on th Design of Concrete Structures, (1995). 7. Institute, A.C., Building code requirements for structural
concrete (ACI 318-11) and commentary (ACI318R-11), (2011). 8. CEN, Eurocode 8: Design of structures for earthquake
resistance, part 1, (2004).
9. Islam, M.S. and Saito, T., "Displacement based evaluation for confinement requirement of boundary elements of shear wall and retrofit design using carbon fiber sheet (CFS)", in Bulletin of IISEE., (2015).
10. Sedgh, R., Dhakal, R. and Carr, A., "State of the art: Challenges in analytical modelling of multi-storey shear wall buildings", in New Zealand Society for Earthquake Engineering Annual Conference (NZSEE2015), Rotorua, New Zealand, pO-15., (2015).
11. Seo, J., Hu, J.W. and Davaajamts, B., "Seismic performance evaluation of multistory reinforced concrete moment resisting frame structure with shear walls", Sustainability, Vol. 7, No. 10, (2015), 14287-14308.
12. Council, B.S.S., "Prestandard and commentary for the seismic rehabilitation of buildings", Report FEMA-356, Washington, DC, (2000).
13. Creagh, A., Acevedo, C., Moehle, J., Hassan, W. and Tanyeri, A.C., "Seismic performance of concrete special boundary element", University of Texas at Austin and University of California Berkley, US, (2010).
0 0.2 0.4 0.6 0.8 1 0
0.1 0.2 0.3 0.4 0.5 0.6 0.7 0.8 0.9 1
Spectral Acceleration (g)
Cu
m
u
lat
iv
e Pr
o
b
ab
il
it
y
14. Parra, P. and Moehle, J., "Lateral buckling in reinforced concrete walls", in Tenth US Natl Conf Earthq Eng, Anchorage, Alaska., (2014).
15. Wallace, J.W., "Behavior, design, and modeling of structural walls and coupling beams—lessons from recent laboratory tests and earthquakes", International Journal of Concrete Structures and Materials, Vol. 6, No. 1, (2012), 3-18.
16. Hagen, G.R., "Performance-based analysis of a reinforced concrete shear wall building", California Polytechnic State University, San Luis Obispo, (2012), DOI: https://doi.org/10.15368/theses.2012.120.
17. Committee, A.S.S.R.S., "Seismic rehabilitation of existing buildings (ASCE/SEI 41-06)", American Society of Civil Engineers, Reston, VA, (2007).
18. Gogus, A. and Wallace, J.W., "Seismic safety evaluation of reinforced concrete walls through fema p695 methodology", Journal of Structural Engineering, Vol. 141, No. 10, (2015), DOI: 10.1061/(ASCE)ST.1943-541X.0001221.
19. FEMA, P., "695. Quantification of building seismic performance factors", Federal Emergency Management Agency, (2009). 20. NEHRP Consultants Joint Venture, Recommendations for
seismic design of reinforced concrete wall buildings based on studies of the 2010 maule, (2014)
http://www.nehrp.gov/pdf/GCR%2014-917-25_RecommendationsforRCWallBuildings_std.pdf.
21. Tiong, P., Adnan, A., Rahman, A. and Mirasa, A., "Seismic performance of low-ductility precast wall structure with base isolation", International Journal of Engineering-Transactions B: Applications, Vol. 26, No. 2, (2012), 153-162.
22. OpenSees, Open system for earthquake engineering simulation, opensees, (2013), http://opensees.berkeley.edu/.
23. Thomsen IV, J.H. and Wallace, J.W., "Displacement-based design of slender reinforced concrete structural walls— experimental verification", Journal of Structural Engineering, Vol. 130, No. 4, (2004), 618-630.
Investigating The Seismic Response of Structural Walls Using Nonlinear Static and
Incremental Dynamic Analyses
M. Asgari, S. Tariverdilo
Urmia University, Faculty of Engineering, Urmia, Iran
P A P E R I N F O
Paper history: Received 14 June 2017
Received in revised form 11 July 2017 Accepted 08 September 2017
Keywords: Bearing Wall System Building Frame System Special Shear Wall Ordinary Shear Wall Incremental Dynamic Analysis
ديكچ ه
هزاس یاهراوید ًلاومعم یا
یم رارق هدافتسا دروم مئاق و یبناج یاهراب یارب اراک ییازجا ناونع هب توافتم یاهدرکلمع .دنریگ
هلزلز رد ربراب یاهراوید نییآ طباوض ساسارب هدش یحارط یاهراوید ینمیا یسررب موزل ،هتشذگ یاه
همان یاه یپ رد ار یحارط
لکش طباوض ساسارب هدش یحارط ینامتخاس باق متسیس و ربراب راوید متسیس یاهراوید درکلمع هعلاطم نیا رد .دراد یریذپ
یسررب یلومعم و هژیو هدش
یسررب دروم هدنیازفا یکیمانید و یکیتاتسا زیلانآ زا هدافتسا اب هعلاطم دروم یاهراوید درکلمع .تسا
.تسا هتفرگ رارق جیاتن
، نیئاپ راتفر بیارض اب هک تسا ربراب راوید متسیس لوبق لباق درکلمع یایوگ نیئآ رد متسیس نیا رت
همان
-مه یحارط یاه .درادن یناوخ
![Figure 1. Section details of analytical RW2 [25]](https://thumb-us.123doks.com/thumbv2/123dok_us/204146.2014705/3.595.344.504.463.711/figure-section-details-analytical-rw.webp)