Non Linear Static and Dynamic Analysis of
High Rise Building with Shear Walls and
Bracings
M.Naga Maddileti 1, Narayana Reddy.S 2
P.G. Student, Department of Civil Engineering, Dr.K.V.Subba Reddy Institute of Technology, Duapdu,
Andhra Pradesh, India1
Assistant Professor, Department of Civil Engineering, Dr.K.V.Subba Reddy Institute of Technology, Duapdu,
Andhra Pradesh, India2
ABSTRACT: High rise buildings become common in the modern growing cities as the height of the building increase for the given width , the building frame becomes more flexible particularly in the case of frames with heights above 15
stories slenderness becomes more and fundamental frequency of the frames becomes less. In the present project a
building with different heights is analyzed for wind as well as for earthquake loads for different load combinations. Considering a building with height of 48 m in worst condition i.e,, in ZONE-III ZONE-V & SOIL-3 and analyzed for load combinations 1.2(DL+LL+LATERAL LOAD) in X direction with lateral load resisting systems. Results of displacement are compared for load combinations
KEYWORDS:Highrise Buiding, Earthquake Zones, Lateral Load resisting system
I. INTRODUCTION
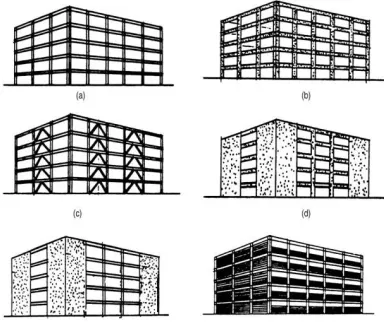
There are several systems that can be used effectively for providing resistance to seismic lateral forces. Some of the more common systems are shown in figures below. All of the systems rely on a complete, three –dimensional space frame; a coordinated system of moment frames, shear walls, or braced frames with horizontal diaphragms; or a combination of the systems.
1. In buildings where a space frame resists the earthquake forces, the columns andbeams act in bending. During
a large earthquake, storey to storey deflection (storey drift) may be accommodated within the structural systems without causing failure of columns or beams. However, the drift may be sufficient damage elements that are rigidly tied to the structural system such as brittle partitions, stairways, plumbing, exterior walls, and other elements that extend between floors. Therefore, buildings can have substantial interior and exterior non structural damage and still be structurally safe. Although there are excellent theoretical and economic reasons for resisting seismic forces by frame action, for particular buildings, this system may be a poor economic risk unless special damage-control measures are taken.
2. A braced frame building is normally more rigid than a framedstructure. With low design stress limits in shear
walls, deflection due to shear forces is relatively small. Shear wall construction is an economical method of bracing buildings to limit damage, and this type of construction is normally economically feasible up to about 15 stories. Notable exceptions to the excellent performance of shear walls occurs when the height-to-width ratio becomes great enough to make overturning a problem and when there are excessive openings in the shear walls. Also, if the soil beneath its footings is relatively soft, the entire shear wall may rotate, causing localized damage around the wall.
3. The structural systems just mentioned may be used singly or in combination with each other. When frames
load. Otherwise, it is referred to as a combined system.
Fig. 1: Elevation Irregularities (a) abrupt change in geometry (b) large difference in floor masses (c) large difference in storey stiffness.
Fig. 2: Lateral-force-resisting systems: (a) steel resisting frame; (b) reinforced concrete moment-resisting frame; (c) braced steel frame; (d) reinforced concrete shear walls; (e) steel frame building with
cast-in-place concrete shear walls; (f) steel frame building with infilled walls of nonreinforced masonry. .
II. NUMERICAL MODELLING
Height of the building : 48 m
Length of the building : 25.570 m
Breadth of the building : 25.210 m
Column size used storey 1 to 8 : 650 x 350 (in mm)
Column size used storey 9 to 15 : 500 x 300 (in mm)
Beam used in building : 450 x 250 (in mm)
Slab thickness : 110 mm
Steel used in building : HYSD500
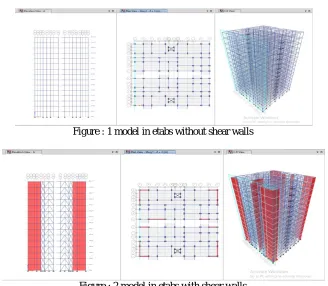
Figure : 1 model in etabs without shear walls
Figure : 2 model in etabs with shear walls III.EXPERIMENTAL RESULTS
Case-1: Comparison Of Shear In Static Analysis For Zone-3 & Zone-5 In Soil-1, Soil-2 & Soil-3
Table 1 Shear Comparison values along Z-3, S-1 in Static Analysis
1.2(DL+LL+EQX), Elevation-A Shear (KN) Z-3, S-1
Storey's Without shearwall &bracings With shearwall &bracings
storey15 5.5726 0.1021
Storey14 4.2588 0.0067
storey13 4.4862 0.0489
storey12 4.4621 0.0982
storey11 4.4628 0.1478
storey10 4.5182 0.1924
storey9 4.0187 0.2459
storey8 5.3464 0.5378
storey7 4.7325 0.5329
storey6 4.7879 0.5413
storey5 4.6856 0.5625
Graph 1 Variation of Moment along Z-3, S-1 in Static Analysis
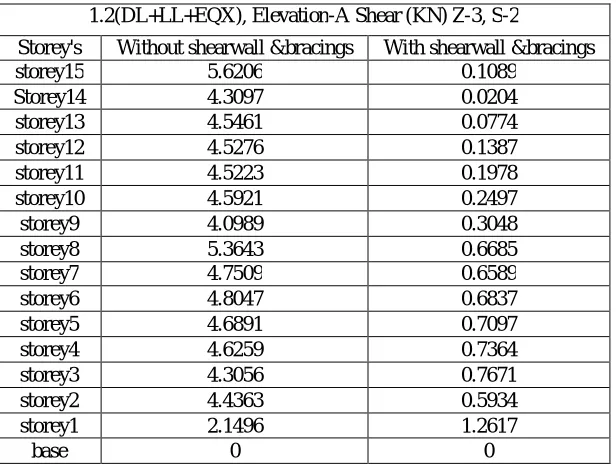
Table 2 Shear Comparison values along Z-3, S-2 in Static Analysis
0 1 2 3 4 5 6 st o re y1 5 St o re y1 4 st o re y1 3 st o re y1 2 st o re y1 1 st o re y1 0 st o re y9 st o re y8 st o re y7 st o re y6 st o re y5 st o re y4 st o re y3 st o re y2 st o re y1 b as e S H EA R ( kn )
No. of Storeys
1.2(DL+LL+EQX) Elevation-A SHEAR (KN) Z-3, S-1
Without shearwall &bracings
With shearwall &bracings
1.2(DL+LL+EQX), Elevation-A Shear (KN) Z-3, S-2
Storey's Without shearwall &bracings With shearwall &bracings
storey15 5.6206 0.1089
Storey14 4.3097 0.0204
storey13 4.5461 0.0774
storey12 4.5276 0.1387
storey11 4.5223 0.1978
storey10 4.5921 0.2497
storey9 4.0989 0.3048
storey8 5.3643 0.6685
storey7 4.7509 0.6589
storey6 4.8047 0.6837
storey5 4.6891 0.7097
storey4 4.6259 0.7364
storey3 4.3056 0.7671
storey2 4.4363 0.5934
storey1 2.1496 1.2617
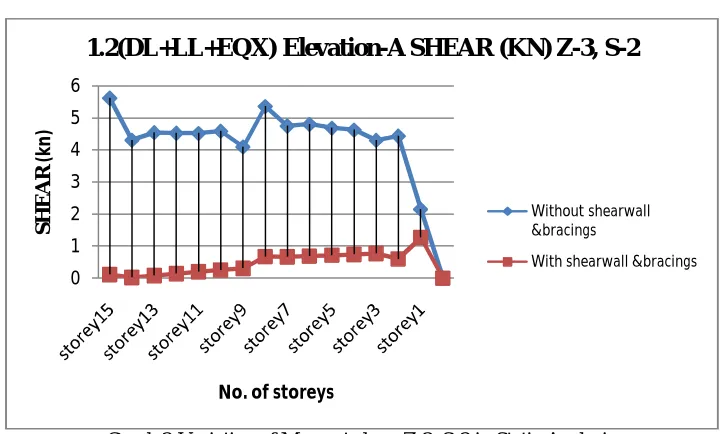
Graph 2Variation of Moment along Z-3, S-2 in Static Analysis
Table 3 Shear Comparison values along Z-3, S-3 in Static Analysis
0 1 2 3 4 5 6
S
H
EA
R
(k
n
)
No. of storeys
1.2(DL+LL+EQX) Elevation-A SHEAR (KN) Z-3, S-2
Without shearwall &bracings
With shearwall &bracings
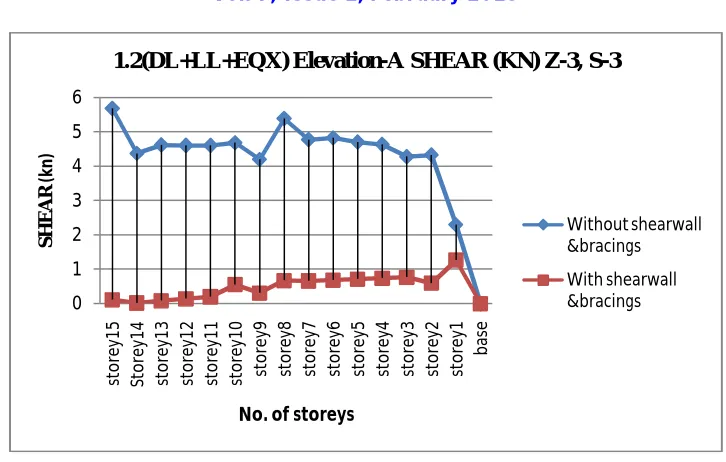
1.2(DL+LL+EQX), Elevation-A Shear (KN) Z-3, S-3
Storey's Without shearwall &bracings With shearwall &bracings
storey15 5.6768 0.1089
Storey14 4.3696 0.0204
storey13 4.6168 0.0774
storey12 4.605 0.1387
storey11 4.6047 0.1978
storey10 4.68 0.5497
storey9 4.1943 0.3048
storey8 5.3853 0.6685
storey7 4.7726 0.6589
storey6 4.8239 0.6837
storey5 4.6994 0.7097
storey4 4.6305 0.7364
storey3 4.2751 0.7671
storey2 4.3275 0.5934
storey1 2.2958 1.2617
Graph 3Variation of Moment along Z-3, S-3 in Static Analysis
Table 4 Shear Comparison values along Z-5, S-1 in Static Analysis
0 1 2 3 4 5 6 st or ey 1 5 St or ey 1 4 st or ey 1 3 st or ey 1 2 st or ey 1 1 st or ey 1 0 st or e y9 st or e y8 st or e y7 st or e y6 st or e y5 st or e y4 st or e y3 st or e y2 st or e y1 b as e S H E A R (k n )
No. of storeys
1.2(DL+LL+EQX) Elevation-A SHEAR (KN) Z-3, S-3
Without shearwall &bracings
With shearwall &bracings
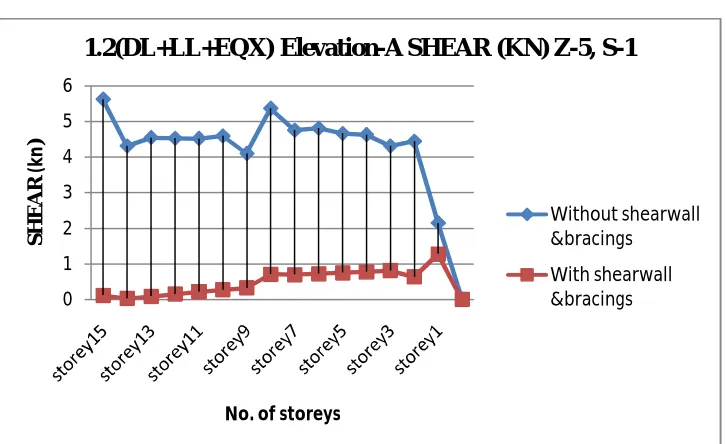
1.2(DL+LL+EQX), Elevation-A Shear (KN) Z-5, S-1
Storey's Without shearwall &bracings With shearwall &bracings
storey15 5.6188 0.1108
Storey14 4.3078 0.0242
storey13 4.5438 0.0854
storey12 4.5251 0.15
storey11 4.5196 0.2119
storey10 4.5893 0.2658
storey9 4.0958 0.3212
storey8 5.3636 0.7051
storey7 4.7502 0.6967
storey6 4.8041 0.7236
storey5 4.6588 0.7509
storey4 4.6257 0.7783
storey3 4.3066 0.8085
storey2 4.4398 0.6344
storey1 2.1449 1.2731
Graph 4 Variation of Moment along Z-5, S-1 in Static Analysis
Table 5 Shear Comparison values along Z-5, S-2 in Static Analysis
0 1 2 3 4 5 6
S
H
EA
R
(k
n
)
No. of storeys
1.2(DL+LL+EQX) Elevation-A SHEAR (KN) Z-5, S-1
Without shearwall &bracings
With shearwall &bracings
1.2(DL+LL+EQX), Elevation-A Shear (KN) Z-5, S-2
Storey's Without shearwall &bracings With shearwall &bracings
storey15 5.7088 0.1199
Storey14 4.4016 0.0426
storey13 4.6546 0.1239
storey12 4.6464 0.2047
storey11 4.6488 0.2794
storey10 4.7271 0.3431
storey9 4.2454 0.4006
storey8 5.5935 0.8814
storey7 4.7943 0.8789
storey6 4.8342 0.9158
storey5 4.7049 0.9495
storey4 4.6329 0.9806
storey3 4.2587 1.0082
storey2 4.2692 0.8324
storey1 2.374 1.3279
Graph 5 Variation of Moment along Z-5, S-2 in Static Analysis
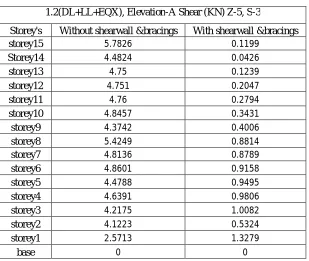
Table 6 Shear Comparison values along Z-5, S-3 in Static Analysis
0 1 2 3 4 5 6
S
H
EA
R
(k
n
)
Axis Title
1.2(DL+LL+EQX) Elevation-A SHEAR (KN) Z-5, S-2
Without shearwall &bracings
With shearwall &bracings
1.2(DL+LL+EQX), Elevation-A Shear (KN) Z-5, S-3
Storey's Without shearwall &bracings With shearwall &bracings
storey15 5.7826 0.1199
Storey14 4.4824 0.0426
storey13 4.75 0.1239
storey12 4.751 0.2047
storey11 4.76 0.2794
storey10 4.8457 0.3431
storey9 4.3742 0.4006
storey8 5.4249 0.8814
storey7 4.8136 0.8789
storey6 4.8601 0.9158
storey5 4.4788 0.9495
storey4 4.6391 0.9806
storey3 4.2175 1.0082
storey2 4.1223 0.5324
storey1 2.5713 1.3279
Graph 6 Variation of Moment along Z-5, S-3 in Static Analysis Zone Wise Comparison Of Shear In Static Analysis For Soil-1, Soil-2 & Soil-3
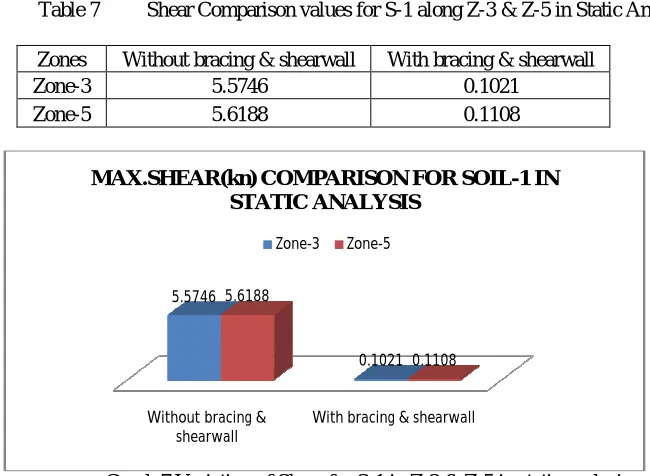
Table 7 Shear Comparison values for S-1 along Z-3 & Z-5 in Static Analysis
Zones Without bracing & shearwall With bracing & shearwall
Zone-3 5.5746 0.1021
Zone-5 5.6188 0.1108
Graph 7 Variation of Shear for S-1 in Z-3 & Z-5 in static analysis
0 1 2 3 4 5 6 7 st o re y1 5 St o re y1 4 st o re y1 3 st o re y1 2 st o re y1 1 st o re y1 0 st o re y9 st o re y8 st o re y7 st o re y6 st o re y5 st o re y4 st o re y3 st o re y2 st o re y1 b as e S H EA R (k n )
No. of storeys
1.2(DL+LL+EQX) Elevation-A SHEAR (KN) Z-5, S-3
Without shearwall &bracings
With shearwall &bracings
Without bracing & shearwall
With bracing & shearwall 5.5746
0.1021 5.6188
0.1108
MAX.SHEAR(kn) COMPARISON FOR SOIL-1 IN STATIC ANALYSIS
Table 8 Shear Comparison values for S-2 along Z-3 & Z-5 in Static Analysis
Zones Without bracing & shearwall With bracing & shearwall
Zone-3 5.6206 0.1089
Zone-5 5.7088 0.1199
Graph 8 Variation of Shear for S-2 in Z-3 & Z-5 in static analysis
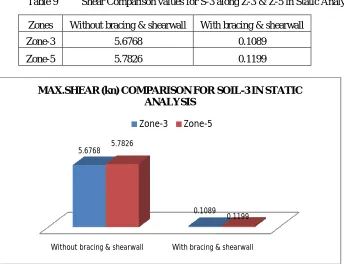
Table 9 Shear Comparison values for S-3 along Z-3 & Z-5 in Static Analysis
Zones Without bracing & shearwall With bracing & shearwall
Zone-3 5.6768 0.1089
Zone-5 5.7826 0.1199
Graph 9 Variation of Shear for S-3 in Z-3 & Z-5 in static analysis Without bracing &
shearwall
With bracing & shearwall 5.6206
0.1089 5.7088
0.1199
MAX.SHEAR (kn) COMPARISON FOR SOIL-2 IN STATIC ANALYSIS
Zone-3 Zone-5
Without bracing & shearwall With bracing & shearwall
5.6768
0.1089 5.7826
0.1199
MAX.SHEAR (kn) COMPARISON FOR SOIL-3 IN STATIC ANALYSIS
By providing shear walls to the structure on each elevation or at optimum places there is a reduction in shear is noticed on each beam at each storey level. Approximate percentage of 40% reduction is noticed.By providing shear walls stiffness of the structure is much increased.
REFERENCES
1 Aoyama, H.,2001, Design of Modern High Rise Reinforced Concrete Structures,Imperial College Press, London, UK
2 Ashraf, M.,Siddiqi, Z.A.,andJaved, M.A. (2008).”Configuration of a multi-storey building subjected to lateral forces.” Asian Journal of civil Engineering (Building and Housing), Vol. 9, No.5 Pages 525-537.
3 Anshuman, S.,DipenduBhunia, BhavinRamjiyani (2011),” Solution of shear wall location in Multi-storey building.” International Journal of civil and structural Engineering Vol. 2,No.2 Pages 493-506.