18
Journal of Economics and Behavioral Studies (ISSN: 2220-6140) Vol. 8, No. 5, pp. 18-26, October 2016
Different Crime Types in Western Cape Province: Principal Component Analysis
Kyei KA*, Tshisikhawe TH, Dube LM
University of Venda, Limpopo Province, South Africa [email protected], [email protected]
Abstract: South Africa has a very high crime rate compared to most countries. Crime affects the society, business and psychology of the people. It compels people to move out or come into a particular area. It is most prevalent in the urban areas where poverty gap is conspicuous. Western Cape and Gauteng Provinces are the best developed provinces in the country and therefore have higher crime levels. But the question is: what types of crime are prevalent in the Western Cape Province? And what are the major causes of these crimes? The purpose of this paper is to identify the different types of crimes committed in the Western Cape Province which are prominent. Principal Component analysis (PCA) has been use in this study to gauge the patterns of crime and the distinct important factors affecting the level of crime. Secondary data from a website have been used in the analysis. The results show that violence and vehicle thefts are the most committed crimes in the province. The areas where crime occurs most frequently are Bellville, Cape Town Central, Gugulethu, Harare, Khayelisha, Mitchells Plain, Nyanga and Parow. Firearms have been identified as major means for committing crime. The paper recommends that attempts be made by the provincial government to clamp down unlicensed fire arm holders/dealers. Amnesty should be granted to encourage holders of unlicensed fire arms to surrender without punishment and the public should report to the police all those dealing in unlicensed firearms in order to root out crime in the province.
Keywords: Crime, violence, vehicle hijacking, fire arms
1. Introduction
South Africa has a high level of crime with, for example, burglary at residence put at 300; malicious injury to property at 165 and drug-related crime at 518 (Statistics South Africa, 2013). Crime has become a natural phenomenon in all societies, high, middle and working class societies. It cuts across all racial groups and the effects of crime are felt by all in the society. All societies want to reduce or even get rid of social crimes that are committed in the society because crime saps the moral energy of the people. It is a global crisis affecting everybody and at all places with different intensity, though (Clarke, 1997). Crime has major effects on businesses. Businesses that are robbed suffer loss directly. The aftermath, of robbery leads to court cases, loss of working-time, disruptions and disturbances. Premiums of insurance go up increasing cost and that affects businesses indirectly (Clarke and Homel, 1997; Demombynes and Özler, 2005). According to Demombynes and Özler (2005), crime compels resources to be diverted and be used as protective mechanisms. They further allege that crime raises the cost of health matters through increased stress. Brown (2001) on the other hand, advanced that majority of South African professionals who left the country to go and live in other countries, especially to live in Australia, New Zealand, etc., cited crime as the main cause of their emigration. A study of the level, composition and distribution of crime in order to devise strategies to combat or reduce crime is hence called for.
2. Literature Review
19
economic and social down-turn which can spread out to the surroundings (Demombynes and Özler, 2005; O’Donovan, 2011). Crime makes residents to withdraw and become more defensive and less committed to the community creating a “porous” and suspicious society (CSVR, 2008; Demombynes and Özler, 2005; Factsheet, 2013). It can be prevented locally when neighbours form organized watch-dog programs. Such programs seek to improve a neighborhood’s cohesion and image through social prevention (Schlossman et al., 1984). Crime can also be prevented through situational and environmental approach where measures taken make it extremely difficult for criminal to access the premises. Access control and surveillance measures are put in place in such situations to deter criminals (Clarke, 1997; Homel, 2005).
3. Methodology
The data used in this study was obtained from the website of Statistics South Africa on crimes reported in the Western Cape Province in 2012. Factor Analysis (FA) or precisely, Principal Component Analysis (PCA) has been used in this analysis. Factor analysis defines the underlying structure in a data matrix by analyzing the structure of interrelationships among a large number of variables by reducing the variables into factors (Carey, 1998; Morrison, 2005; Johnson and Wichern, 2014).
Principal Component Analysis: Principal Component Analysis is used to identify factors which explain most variation in the data; and to determine the variations using a smaller number of new variables (principal components), (Hair et al., 1995; Grimm & Yarnold, 1995). The main goal of PCA is to find principal components which are the linear combination of the observations, i. e.,
𝒀𝒊= 𝒂𝟏𝒊𝑿𝟏+ 𝒂𝟐𝒊𝑿𝟐+ . .. +𝒂𝒒𝒊𝑿𝒒= 𝒂𝒊𝑻𝑿
Which have the greatest sample variance compared to other combinations (Hair et al., 1995)?
Before using any statistical procedure, there is always a need to test the relevance of such procedure for the data. Table 2 tests its suitability. The number of principal components is less than or equal to the number of the original variables. The first principal component explains the most variation and each succeeding component explains most of the remaining variation (Hair, Jr., et al., 1995; Morrison, 2005). All the variables are first standardized in PCA to make a fair comparison among them (Carey, 1998; Johnson and Wichern, 2007).
4. Results
From Table 1, the variables are very dispersed in terms of the variance. Some have low intensities; for example, murder, public violence, kidnapping and ill-treatment of children, while others are significantly high, e.g. common assault, burglaries and drug-related crimes. The level of assault with bodily harm is put at 166; common assault at 232; burglary at residential premises at 300; malicious injury to property at 164; theft out of motor car at 259; drug-related crime at 518 and shop-lifting at 114; all these have high intensities and give concern (Williams & Gedeon, 2004; Bello et al., 2014).
Table 1: Descriptive Analysis
Crimes Mean Std deviation
Contact crimes
Murder 15.21622 30.5949
Total Sexual Crimes 61.27703 72.60524
Attempted murder 15.63514 28.95743
Assault with the intent to inflict grievous bodily harm 165.9932 177.9845
Common assault 232.4932 296.0682
Common robbery 75.02027 133.2971
20
Property related crimesBurglary at non-residential premises 79.22973 90.73495 Burglary at residential premises 299.8986 309.241 Theft of motor vehicle and motorcycle 58.35811 95.45837 Theft out of or from motor vehicle 259.0743 426.5519 Crimes heavily dependent of police action for detection
Unlawful possession of firearms and ammunition 15.95946 30.68135
Drug-related crime 517.5811 729.5582
Driving under the influence of alcohol or drugs 116.777 120.6653 Other serious crimes
All theft not mentioned elsewhere 624.3986 829.6439
Commercial crime 81.08784 137.1666
Shoplifting 114.2973 214.4381
Crimeninjuria 55.24324 123.6795
Subcategories forming part of aggravated robbery above
Carjacking 3.662162 10.02755
Truck hijacking 0.209459 0.801812
Robbery at residential premises 9.027027 15.4162 Robbery at non-residential premises 10.4527 19.90499
Correlation Matrix: From the table in the appendix (Table A1) it can be see that a lot of the variables are correlated with the correlation coefficient between murder and robbery at non-residential premises, for example, being 0.930. Similarly, the coefficient between arson and total sexual crimes also is 0.913; therefore we can perform principal component analysis on the data set.
Table 2: KMO and Bartlett's Test
Kaiser-Meyer-Olkin Measure of Sampling Adequacy. .916 Bartlett's Test of Sphericity Approx. Chi-Square 7623.884
Df 406
Sig. .000
Kaiser-Meyer-Olkin (KMO) statistic varies between 0 and 1; and values greater than 0.7 are considered appropriate for Principal Component Analysis (Hardle & Simar, 2007). Table 2 shows that KMO is 0.916; and this KMO value of 0.916 signifies a good measure and supports the use of PCA (Johnson and Wichern, 2007).
Communalities: Table 3 presents communalities. High values of Extraction confirm that the proportion of each variable’s variance can be explained by the principal components (Steven, 2002; Johnson and Wichern, 2007, 2014).
Table 3: Communalities
Initial Extraction
Contact crimes
Murder 1.000 .967
Total Sexual Crimes 1.000 .943
Attempted murder 1.000 .893
Assault with the intent to inflict grievous bodily harm 1.000 .879
Common assault 1.000 .950
21
Robbery with aggravating circumstancesMalicious injury to property 1.000 1.000 .942 .935 Property related crimes
Burglary at non-residential premises 1.000 .792
Burglary at residential premises 1.000 .794
Theft of motor vehicle and motorcycle 1.000 .884
Theft out of or from motor vehicle 1.000 .889
Crimes heavily dependent of police action for detection
Unlawful possession of firearms and ammunition 1.000 .882
Drug-related crime 1.000 .809
Driving under the influence of alcohol or drugs 1.000 .687 Other serious crimes
All theft not mentioned elsewhere 1.000 .954
Commercial crime 1.000 .919
Shoplifting 1.000 .839
Subcategories forming part of aggravated robbery above
Carjacking 1.000 .850
Truck hijacking 1.000 .644
Robbery at residential premises 1.000 .851
Robbery at non-residential premises Crimenijuria
Kidnapping
1.000 1.000 1.000
.915 .860 .853 Extraction Method: Principal Component Analysis.
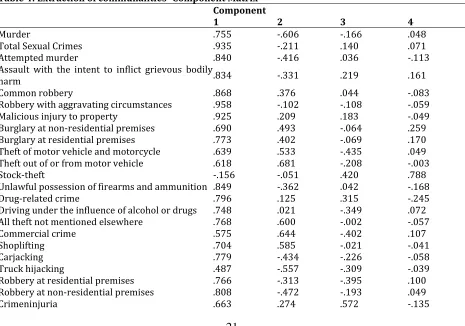
Table 4 shows the extraction of communalities from the Principal Component Analysis. The values are low so it can be concluded that the variables fit well, and should be used in the analysis.
Table 4: Extraction of communalities -Component Matrix Component
1 2 3 4
Murder .755 -.606 -.166 .048
Total Sexual Crimes .935 -.211 .140 .071
Attempted murder .840 -.416 .036 -.113
Assault with the intent to inflict grievous bodily
harm .834 -.331 .219 .161
Common robbery .868 .376 .044 -.083
Robbery with aggravating circumstances .958 -.102 -.108 -.059
Malicious injury to property .925 .209 .183 -.049
Burglary at non-residential premises .690 .493 -.064 .259
Burglary at residential premises .773 .402 -.069 .170
Theft of motor vehicle and motorcycle .639 .533 -.435 .049 Theft out of or from motor vehicle .618 .681 -.208 -.003
Stock-theft -.156 -.051 .420 .788
Unlawful possession of firearms and ammunition .849 -.362 .042 -.168
Drug-related crime .796 .125 .315 -.245
Driving under the influence of alcohol or drugs .748 .021 -.349 .072 All theft not mentioned elsewhere .768 .600 -.002 -.057
Commercial crime .575 .644 -.402 .107
Shoplifting .704 .585 -.021 -.041
Carjacking .779 -.434 -.226 -.058
Truck hijacking .487 -.557 -.309 -.039
Robbery at residential premises .766 -.313 -.395 .100
Robbery at non-residential premises .808 -.472 -.193 .049
22
Kidnapping .909 -.124 .021 -.100
Extraction Method: Principal Component Analysis.
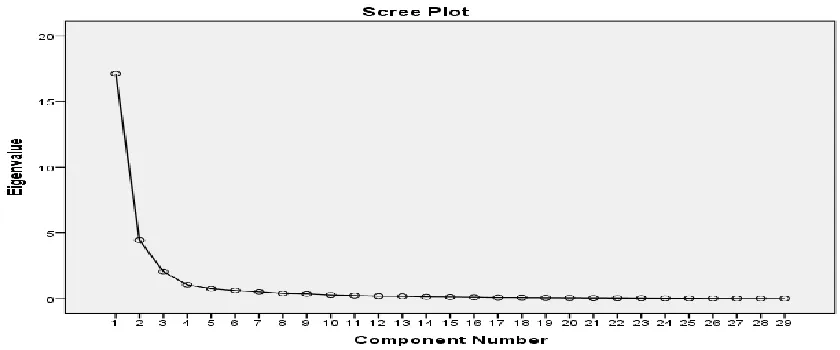
Table 5 : Total Variance Explained
Component Initial Eigenvalues Total % of Variance Cumulative % Total Extraction Sums of Squared Loadings % of Variance Cumulative %
1 17.110 59.002 59.002 17.110 59.002 59.002
2 4.444 15.324 74.326 4.444 15.324 74.326
3 2.046 7.056 81.382 2.046 7.056 81.382
4 1.048 3.615 84.997 1.048 3.615 84.997
5 .748 2.579 87.576
Extraction Method: Principal Component Analysis.
Table 5 shows that only four Principal Components have eigenvalues greater than 1 and have thus been retained. The first principal component explains 59.002% of the variance; the second explains 15.324%; the third 7.056% and the fourth 3.615%. These four principal components explain 84.997% of the total variation in the original data and are adequate to explain the overall variation in the original variables.
Figure 1: Screen plot
The screen plot also shows that only four factors are to be retained because the ‘elbow’ is at 5. Thus the scree plot agrees with Kaiser’s criterion that four principal components have to be retained (Anderson, 2013; Warne, 2014).
23
The plot in Figure 2 is a biplot for identifying which precincts have a high score in each of the principal components. The precincts with high values on the any of the components indicate that it has high crime occurrences. From the biplot, the outliers are Bellville, Cape Town Central, Gugulethu, Harare, Khayelisha, Mitchells Plain, Nyanga and Parow and these “towns” have the highest crime occurrences of all types.
Discussion: The use of PCA revealed the precincts that recorded the highest crime rates for the period that the data was collected. From Table 4, the first Principal Component (PC) is strongly related to violence. The second PC has high coefficients which are all related to vehicle theft. The scree plot (Figure 2) showing the first PC plotted against the second PC, identified police precincts with high crime rates to include Bellville, Cape Town Central, Gugulethu, Harare, Khayelisha , Mitchells Plain, Nyanga and Parow. Nyanga, Khayelisha and Harare. These have high loadings on the first PC, and suggest that those precincts have very high rates of violent crimes. Mitchells Plain, Bellville, Cape Town Central, Gugulethu and Harare also had very high loadings on the second PC which suggests that there is a lot of vehicle crime theft activity and violence happening there. It is only Mitchells Plain that has a high loading of violence and a low loading of vehicle theft, which suggests that the measures taken there against vehicle theft are effective but have resulted in an increase in violence related crimes. These observations suggest that an increase in violence and theft related crime leads to an increase in other crime types as well; but violence related crimes are inversely proportional to vehicle theft-related crimes.
5. Conclusion
Principal Component Analysis reduced the dimensionality of the data from 29 to only 4 which accounted for 84.997% of the total variation in the original data set. The study shows that violence and vehicle thefts are the most committed crimes in the province. Bellville, Cape Town Central, Gugulethu, Harare, Khayelisha , Mitchells Plain, Nyanga and Parow are the “hotspot” of occurrence of crime. In areas where there is high violence, hijackings tend to have low figures, and where there are high occurrences of hijacks, violence is lowly recorded. Firearms are easily accessible in the Western Cape, especially in the locations and that gives criminals a sense of power and scares the public. The proliferation of the firearms makes combating crime a very difficult task in the province.
Recommendations: The study recommends that attempts be made by the provincial government to clamp down unlicensed fire arm holders/dealers. Initiatives must be put in place, especially in the areas where crime is very high; so that citizens are encouraged to report owners of firearms to the police. And that the Western Cape government grants amnesty to people who are in possession of illegal firearms so as encourage them to come and surrender their firearms without having to face prosecutions.
References
Anderson, T. W. (2013). An Introduction to Multivariate Statistical Analysis. Thompson McGraw-Hill, Inc. NY. Bello, Y., Batsari, Y. U. & Charanchi, A. U. (2014): Principal Component Analysis of Crime Victimizations in
Katsina Senatorial Zone. International Journal of Science and Technology, 2(1).
Brown K. V. (2001). The determinants of crime in South Africa. S Afr. Journal of Econs., 69, 269–299.
Carey, G. (1998). Multivariate Analysis of Crime of Variance (MANOVA) I. Theory. (http://ibgwww.colorado.edu/ - Carey) (Retrieved January 8, 2015).
Centre for the Study of Violence and Reconciliation (CSVR). (2008). Adding insult to injury: How exclusion and inequality drive South Africa’s problem of Violence, Johannesburg: CSVR.
Centre for the Study of Violence and Reconciliation (CSVR). (2009). Why does South Africa have such high rates of violent crime? Johannesburg: CSVR .
Clarke, R. V. (1997). Introduction. In RV Clarke (ed.): Situational Crime Prevention: Successful Case Studies. Guiderland, NY: Harrison and Heston.
Clarke, R. V. & Homel, R. (1997). Revised Classification of Situational Crime Prevention. In S. P. Lab (ed.): Crime Prevention at a Crossroads. Cincinnati, OH: Anderson.
24
Crime affecting Business in South Africa. (2011). Available at http://www.bancrime.com/articles/crime-affecting-business-in-south-africa. (Retrieved December 10, 2014).
Demombynes, G. & Özler, B. (2005). Crime and local inequality in South Africa. Journal of Development Economics, 76(4), 265-292.
Factsheet: SA's 2012/13 crime statistics (2013):
http://www.news24.com/SouthAfrica/News/FACTSHEET-SAs-201213-crime-statistics-20130920 (Retrieved December 8, 2014).
Fajnzylber, P., Lederman, D. & Loayza, N. (2002). What causes violent Crime? European Economic Review, 46, 1323-1357.
Grimm, L. G. & Yarnold, D. (1995). Reading and Understanding Multivariate Statistics. Washington D.C.: American Psychological Association.
Hair, J. F. Jr., Anderson, R. F., Tatham, R. L. & Black, W. C. (1995). Multivariate Data Analysis. Englewood CliffN3 Prentice Hall, Inc.
Hardle, W. & Simar, L. (2007). Applied Multivariate Statistical Analysis, Springer Berlin Heidelberg. Pp. 289-303.
Homel, R. (2005). Developmental crime prevention. In Nick Tilley (Ed.), Handbook of crime prevention and community safety (pp. 71-106).Cullumpton, Devon, UK: Willan Publishing.
Johnson, R. & Wichern, D. (2007). Applied Multivariate Statistical Analysis. Prentice Hall Upper Saddle River, NJ.
Johnson, R. & Wichern, D. (2014). Applied Multivariate Statistical Analysis. Pearson Education Limited, London.
Morrison, D. F. (2005). Multivariate Statistical Methods; (Fourth Edition), Brooks/Cole, a division of Thomson Learning, Inc.
O’Donovan, M. (2011). Crime, poverty and inequality in South Africa: What the data shows. In C. Gould (ed.) National; and international perspectives on crime and policing: Towards a coherent strategy for crime reduction in South Africa beyond 2010. Pretoria Institute for Security Studies: 26-33.
Schlossman, S., Zellman, G., Shavelson, R. & Cobb, J. (1984). Delinquency prevention in South Chicago: a fifty year assessment of the Chicago Area Project, Santa Monica, Calif.: Rand.
Statistics South Africa (Stats SA). (2008). Income and Expenditure of households 2005/2006. Unit record, Pretoria: Statistics South Africa.
Statistics South Africa (Stats SA). (2011). Available at http://www.beta2.statssa.gov.za and http://www.statssa.gov.za/crime (Retrieved on December 12, 2013).
Statistics South Africa (Stats SA). (2013). Methodological Report on the development of the poverty lines for statistical reporting. Technical report DO 300. Pretoria: Statistics South Africa.
Stevens, J. P. (2002). Applied Multivariate Statistics for the Social Sciences, Fourth Edition. Mahwah, New Jersey: Lawrence Erlbaum Associates, Inc.
Warne, R. T. (2014). A primer on multivariate analysis of variance (MANOVA) for behavioral scientists. Available at (http://www.pareonline.net/getvn.asp. (Retrieved December 10, 2014).
25
AppendixTable A1: Correlation Matrix
Murder
Total Sexual
Crimes Attempted murder
Assault with the intent to inflict grievous bodily
harm Common assault Common robbery
Robbery with aggravating
circumstances Arson
Malicious injury to property
Burglary
at
non-residential premises Burglary at residential premises
Murder 1 .824** .880** .812** .502** .432** .805** .729** .525** .232** .341**
Total Sexual
Crimes .824** 1 .845** .920** .840** .732** .884** .913** .830** .549** .654**
Attempted
murder .880** .845** 1 .808** .674** .595** .854** .806** .711** .357** .456**
Assault with the intent to inflict grievous bodily harm
.812** .920** .808** 1 .767** .603** .773** .883** .748** .470** .543**
Common
assault .502** .840** .674** .767** 1 .834** .794** .823** .925** .657** .732**
Common
robbery .432** .732** .595** .603** .834** 1 .829** .671** .866** .715** .725**
Robbery with aggravating
circumstances .805** .884** .854** .773** .794** .829** 1 .790** .833** .569** .660**
Arson .729** .913** .806** .883** .823** .671** .790** 1 .815** .521** .618**
Malicious
injury to
property .525** .830** .711** .748** .925** .866** .833** .815** 1 .741** .823**
Burglary at
non-residential premises
.232** .549** .357** .470** .657** .715** .569** .521** .741** 1 .795**
Burglary at
residential
premises .341** .654** .456** .543** .732** .725** .660** .618** .823** .795** 1
Theft of
motor vehicle and
motorcycle
.229** .424** .308** .246** .475** .714** .605** .353** .632** .741** .769**
Theft out of or from motor
vehicle .103 .395** .239** .256** .565** .840** .566** .343** .654** .726** .716**
Stock-theft -.115 -.056 -.132 .042 -.003 -.150 -.200* -.037 -.130 -.046 -.119
Unlawful possession of firearms and ammunition
.849** .839** .945** .783** .685** .624** .837** .815** .741** .379** .471**
Drug-related
crime .466** .743** .694** .628** .819** .774** .703** .759** .842** .530** .595**
Driving under the influence of alcohol or drugs
.586** .674** .590** .566** .523** .586** .686** .605** .645** .553** .688**
All theft not mentioned
26
Commercialcrime .129 .358** .186* .201* .457** .734** .524** .265** .558** .743** .681**
Shoplifting
.186* .530** .339** .355** .716** .841** .633** .466** .739** .724** .695**
Carjacking
.887** .767** .805** .694** .525** .532** .841** .707** .575** .300** .370**
Truck
hijacking .725** .488** .654** .512** .237** .195* .557** .441** .286** .104 .120
Robbery at
residential
premises .843** .745** .724** .655** .488** .502** .820** .623** .574** .376** .561**
Robbery at
non-residential premises
.930** .831** .853** .786** .580** .500** .872** .732** .604** .343** .449**
Culpable
homicide .742** .774** .675** .710** .616** .522** .738** .686** .606** .518** .523**
Public
violence .710** .693** .646** .722** .521** .498** .652** .610** .558** .337** .428**
Crimeninjuria
.231** .613** .444** .527** .874** .699** .587** .646** .766** .502** .540**
Neglect and ill-treatment
of children .505** .806** .659** .741** .820** .648** .684** .823** .779** .464** .570**
Kidnapping