IJPAR |Vol.6 | Issue 4 | Oct- Dec-2017
Journal Home page: www.ijpar.com
Research article
Open Access
Development and validation of the quantitative analysis of lisinopril
dihydrate in tablet formulation by fourier transform infrared spectroscopy
Shital Dange*
1, Shailesh Wadher
2, Tukaram Kalyankar
2, M. Krishna Yadav
1 1Department of Pharmaceutical Analysis, Sree Dattha Institute of Pharmacy, Hyderabad.
2Department of Quality Assurance, School of Pharmacy, Swami Ramanand Teerth Marathwada
University, Nanded- 431605, Maharashtra, India.
*Corresponding Author: Shital Dange
Email: [email protected]
ABSTRACT
A simple, precise, non accurate, rapid, inexpensive, ecofriendly and reproducible FTIR spectrophotometric method for quantitative determination of lisinoprildihydrate in tablet formulation was developed and validat ed. This method concerned with measurement of absorbance measurements of bands corresponding to OH stretch centered by 3625-3490 cm-1. Analytical method validation was carried out to study the parameters as linearity, repeatability, precision and accuracy. The linearity range was found to be 0.3-1.8 % w/w (regression equation: y=0.300x-0.030, r2 = 0.994). The data show good precision results of this method, since the RSD values observed less than 2 %. The proposed FTIR method was successfully applied to the assay of lisinoprildihydrate in bulk drugs and tablet formulation.
Keywords:
Fourier Transform Infrared Spectroscopy, Quantitative Determination, Quality Control, LisinoprilDihydrate.
INTRODUCTION
Chemically, lisinoprildihydrate (LD) (CAS No. 83915-83-7), (s)-1-[N2-(1-carboxy-3-phenyl propyl)-L-lysyl]-L-proline dihydrate (empirical formula C21H31O5N3.2H2O) is lysine derivative of enalaprilat and ACE inhibitor, the active metabolite of enalapril and used as antihypertensive [1]. Literature reported various methods like spectrophotometric [2-4], fluorimetric[5, 6], RP-HPLC[7-12], stability indicating RP-HPLC[13, 14], HPTLC[15], LC [16], and FTIR-13C NMR[17] for
determination of lisinoprildihydrate, but no method is available for its determination using Fourier Transform Infrared Spectroscopy. Hence an endeavor was made to develop ecofriendly, green, cost effective, simple, rapid and non destructive method using FTIR for the assay of lisinopril dihydrate in pure and tablet forms.
Experimental
Chemicals and reagents
Standard sample of LD was obtained as gift from Lupin Limited, Aurangabad. For recording spectra, IR spectroscopic grade of KBr obtained from Merck KGaA, Germany. Single dosage form (5 mg dose) of different brands was procured from local market.
FTIR Instrumentation
FTIR analyses were carried out on IR Affinity-1 (00722) FTIR spectrophotometer, (Shimadzu, Japan) with IR Solution 1.50 version of software for data analysis having single beam optical system and DLATGS detector with ceramic light source of high luminance. KBr disc spectra recorded in mid IR region 4000 cm-1- 400 cm-1, with average 45 scans having resolution of 4 cm-1. To carry out the forced photo degradation study, photochemical reactor (Shrinivasan Griffin-Rayonet type) was used.
Calibration curve
Calibration curve was prepared for the different concentrations of lisinoprildihydrate in range of 0.3-1.8 % w/w. Appropriate quantity of lisinoprildihydrate was mixed homogenously with KBr to get 1000 mg and it was triturated. The intensity corresponding to OH stretching centered at 3625-3490 cm-1 is used for calibration curve.
Accuracy
To the preanalyzed tablet powder, known amount of lisinopril standard powder corresponding to 80, 100, and 120 % of label claim was added. The sample was mixed with KBr and analyzed by making 1 % w/w dilution. Standard addition method was applied with recovery of pure drug from excipients at three different quantities (80, 100, 120 % w/w) to the tablet powder, Lisoril-5 (pure LD) and Lipril 5.
Linearity
Linearity of the method studied for six samples of concentration range 0.3-1.8 % w/w. Calibration curve linearity assessed by the linear regression line equation for the API. The solid state sample in concentration range of 0.3-1.8 % w/w was prepared as described about sample of different concentration in six replicates.
Precision
Repeatability for API (In single of each as well as combination of both) was studied with pure API at 1 % w/w concentration six times on same day (day 1). Intermediate precision assessed for precision of pharmaceutical formulations on interday (day 3).
Analysis of Marketed Tablet Formulations
Two different marketed brands of single dose of LD (Lisoril-5, Lipril-5) label claim 5 mg of lisinoprildihydrate were used for estimation of drug content. Twenty tablets were weighed and average weight determined then triturated to fine powder. Appropriate amount of each tablet diluted to potassium bromide for getting 1 % w/w concentration. Readings were taken in triplets. The results are shown in Table 5 and 6.
Interference study
Literature revealed that no such method reported for LD. No sample pretreatment, no use of hazardous chemicals, less time consuming with no requirement of special efficiency to develop the method. The effect of other components commonly excipients analyzed in pharmaceutical formulation for these studies. Excipients and API separated from marketed preparation of different brands mentioned above with chloroform and spectra were taken. LD standards had no interference with absorption bands present in mixture as shown in Figure 2 (h)
RESULTS AND DISCUSSION
Outcome for reported method brings to considerable reimbursement in case of speed, ease, lengthy procedure, use of costly hazardous chemicals and expediency by use of FTIR for quality control and analysis of pharmaceutical finished products. The FTIR spectrum for pure sample of lisinopril dihydrate exhibited absorbance bands in the range of 3552, 3500-3100, 1725-1705, 1340, 3000, 1200, 1600-1450, 4000-2500, and 1650-1800 cm−1.
for LD was used for the preparation of calibration curve.
The calibration curve is described by the equation 𝑦 = c + 𝑏𝑥, where 𝑦 represents peak area and 𝑥 represents concentration of drugs (AB and LD). Initially the samples in the concentration range of 0.5–5.0% w/w, 1-6% w/w, 2-24% w/w were analyzed to determine the linearity. The calibration curve with good linearity was
established ranging from 0.3 to 1.8% w/w for lisinopril dihydrate in potassium bromide. The corresponding linear regression equation for LD was 𝑦 = - 0.030+0.300x and the correlation coefficient for calibration curve was 0.994. The degradation studies were carried out using thermal degradation, UV light and direct sunlight exposure.
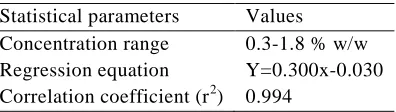
Table 1: Linear regression data for lisinopril dehydrate
Statistical parameters Values Concentration range 0.3-1.8 % w/w Regression equation Y=0.300x-0.030 Correlation coefficient (r2) 0.994
Table 2: Precision data of marketed formulation (Lipril 5) Sr. No. Interval of Time Concentration(% w/w) % Recovery
LD 99.36
I 5 99.04
II Day 1 5 99.68
III 5 100
I 5 99.36
II Day 3 5 100.31
III 5 99.36
Table 3: Statistical validation of day 1 precision data Name of the drug Mean* SD* % RSD*
LD 99.36 0.32 0.322
Table 4: Statistical validation of day 3 precision data Name of the drug Mean* SD* % RSD*
LD 99.89 0.484 0.484
Table 5: Analysis data of different marketed brands of Lisinopril Dihydrate Name % Recovery Amount found % label claim
LD
LIPRIL-5 101.59 5.07 101.4
101.6 5.08 101.6
101.64 5.08 101.6
Table 6: Statistical data for analysis of different brands of LD
BRANDS % RECOVERY % LABEL CLAIM
Mean SD* %RSD* Mean SD* %RSD*
Figure 2 a) : Spectra for 0.3 % w/w LD pure drug with KBr
Figure 2 b) : Spectra for 0.6 % w/w LD pure drug with KBr
Figure 2 d): Spectra for 1.2 % w/w LD pure drug with KBr
Figure 2 e) : Spectra for 1.5 % w/w LD pure drug with KBr
Figure 2 g): Spectra for LD pure drug with KBr
Figure 2 h): Spectra for LD pure drug with excipients
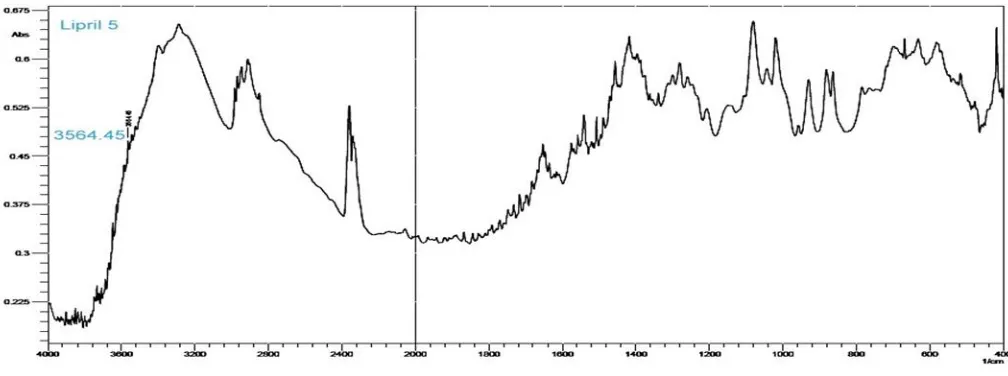
Figure 4: Spectra for Lipril 5 tablets (Label claim 5 mg LD)
CONCLUSION
The proposed method is inexpensive and environmental friendly method. It eliminates complexity of usual extraction methods allowing faster analysis without using hazardous organic chemicals in accordance with the green chemistry needs and fulfils industrial demand of rapid and economical method. FTIR spectroscopy is employed for the qualitative analysis of pharmaceuticals; with advent in sampling techniques, DRIFT spectroscopy may serve as useful technique for qualitative and quantitative analysis of solid-state pharmaceuticals. The development and validation of eco-friendly FTIR method for the quantitation of solid-state API and its successful application to pharmaceuticals. This new approach of using transmission FTIR for direct determination of lisinoprildihydrate in pharmaceutical preparations where several excipients are present provides an alternate to expensive and time consuming procedure. The proposed FTIR method is simple, accurate, precise, validate ecofriendly and reproducible. It can be
used for referring quality control analysis of lisinoprildihydrate in pharmaceutical dosage form.
ACKNOWLEDGEMENT
ACKNOWLEDGEMENT I would like to express my sincere thanks to Chairman Sri G. Pandu Ranga Reddy, Vice - chairman Sri G.N.V. Vibhav Reddy of Sree Dattha Educational Institution, Sheriguda, Ibrahimpatnam. Hyderabad, India, for providing required support in carrying the research work. I would like to express my special thanks to Dr. S. A. Sreenivas, Principal Sree Dattha Institute of Pharmacy, Sheriguda, Ibrahimpatnam. Hyderabad, Telangana, India.
Authors are very grateful to Lupin Pvt. Ltd., Aurangabad (MS), India for providing gift samples as well as to the Director, School of Pharmacy, S R T M U, Nanded (MS), India for providing necessities to carry out work.
CONFLICT OF INTERESTS
The authors declared that there is no conflict of interests in the publication of the paper.
REFERENCES
[1]. C. O.Wilson and O. Gisvold, Textbook of Organic Medicinal and Pharmaceutical Chemistry, rev. by J.H Block, J. M. Beale,Jr., Lippincott Williams and Wilkins Pbs., Philadelphia 11, 2004.
[2]. N. Rahman, M. Singh, and M. N. Hoda, J. Braz. Chem. Soc., 16(5), 2005, 1001-1009.. [3]. Ahmed Ali, and A. A. Elbashir, ISESCO J. Sci. Technol., 8(13), 2012, 30-36.
[5]. M. Jamakhandi, C.Javali, S. Kumar, S. Kumar, and S. D.S. Kumar, Int. J. Pharm. Sci. Drug Res., 2(3), 2010, 182-187.
[6]. M. Jamakhandi, C. Javali, Santoshkumar, D. S. Sanjaykumar, and D. Kadadevar, Int. J. Pharm. Pharm. Sci., , 2(4), 209-211.
[7]. Ivanovic, M. Medenica, B. Jancic, N. Knezevic, A. Malenovic, J. Milic, ActaChromatogr., 18, 2007, 143-156.
[8]. N. Nalluri, V. L. Padmini, S. K. Firdose, Madhavi S., and M. J. Mohammed, J. Chem. Pharm. Res., 5(8), 2013, 195-202.
[9]. D. Wagh, P. Dhore, D. S. Jain, and D. R. Mundhada, Int. J. PharmTech Res.,4(4), 2012, 1570-1574. [10]. L. Rao, and V. R. Bhaskara, E-J. Chem., 9(1),2012,340-344.
[11]. V. Maslarska, L. Peikova, and B. Tsvetkova, Int. J. Pharm. Sci. Rev. Res., 22(1), 46, 2013, 253-256. [12]. A. Siddiqui, N. Sher, N. Shafi, and S. S. Bahadur, Arabian J. Chem2013.
[13]. E. H. K. Adam, Am. J. Anal. Chem., 5, 2014, 316-322.
[14]. C. A. Beasley, J. Shaw, Z. Zhao, and R. A. Reed, J. Pharm. Biomed. Anal., 37, 2005, 559-567.
[15]. El-Gindy, A. A. Ashour, L. Abdel-Fattah, and M. M. Shabana, J. Pharm. Biomed. Anal., 25, 2001, 923-931. [16]. El-Gindy, A. Ashour, L. Abdel-Fattah, and M. M. Shabana, J. Pharm. Biomed. Anal., 25, 2001, 913–922. [17]. Olaru, G. Borodi, I. Kacso, M. Vasilescu, I. Bratub, and O. Cozar, Spectrosc.,23, 2009, 191-199.
[18]. S. T. H. Sherazi, M. Ali, and S. A. Mahesar, Vib. Spectrosc.,55, No. 1, 2011, 115-118.
[19]. S. A. Mahesar, A. Bendini, L. Cerretani, M. B. Carboginin, and S. T. H. Sherazi , Eur. J. Lipid Sci. Technol., 112(12), 2010, 1356-1362.
[20]. European Pharmacopoeia, 2002. [21]. United States Pharmacopoeia, 2002.
[22]. S. R. Matkovic, G. M. Valle, and L. E. Briand, Latin Am. Appl. Res., 35, 2005, 189-195. [23]. European Pharmacopoeia, 5, 2005.
[24]. H. Qasim, J. Eng. Technology, 28, 2010, 15, 1-5.Eng.
[25]. E. Konoz, A. H. M. C. M. Samadizadeh, and S. Boreiri, E-J. Chem., 9, (4), 2012, 2232-2238. [26]. K. C. Patraa, K. J. Kumar, S. K. Sahooa, and P. Suresha, Eur. J. Anal. Chem., 5(1), 2010, 73-80.t
[27]. R. R. Prasad, K. Bhuvaneswari, Muralilal, and K. Rajani, Int. J. Res. Pharm. Biomed. Sci., 3(4), 2012, 1523-1525.
[28]. Bhongade, S. Talath, and S. Dhaneshwar, Int. J. Spectrosc., 2014, 1-6.
[29]. C. M. Vieira, P. C. Ricarte, and H. R. N. Salgado, Adv. Anal. Chem., 2(6), 2012, 80-87.
[30]. S. T. H. Sherazi, M. A. Mallah, S. A. Mahesar, A. R. Khaskheli, Am. J. Anal. Chem., 3, 2012, 503-511. [31]. ICH. Q2 (R1), Validation of Analytical Procedures: Text and Methodology.