R E S E A R C H
Open Access
The myth and truth of a comprehensive
stroke scale
Hani M. Zakieldine, Mohamed A. Turk , Rana F. Hashem and Mohamed A. Shafik
*Abstract
Background and purpose:The National Institutes of Health Stroke Scale (NIHSS) has been found to be biased toward the left hemispheric and motoric functions providing minimal assessment to the right hemispheric language and cognitive functions. The need to complement the role of the NIHSS is necessary in accurate and rapid assessment of AIS patients and better management. We hypothesized that combining the NIHSS with a quantitative analysis of Spoken Picture Description scale of Comprehensive Aphasia Test (SPD-CAT) could provide valuable data regarding side, site, and size of stroke.
Subjects and methods:Eighty-six AIS patients presented within 48 h of onset of stroke were enrolled from Stroke Units of Ain-Shams University Hospitals (ASUHS). Clinical Assessment with NIHSS and SPD-CAT were correlated with the radiological MRI Brain lesions of stroke regarding (site, side, size/volume and lesion volume percent to the whole brain volume“LV% WBV”).
Results:Total and subscale scores of NIHSS and SPD-CAT have a highly statistically significant correlation with the ischemic“LV% WBV.”Quantitative analysis (content units) of SPD-CAT may help in prediction of the lobar site of the stroke with higher significance in the tempro-parietal and brainstem regions. Right hemispheric strokes have clinically and statistically significant scores on SPD-CAT in comparison to NIHSS scores. Also, the left to right ratio of content units of information carrying words (ICWs) in SPD-CAT gives a significant difference between right and left hemispheric strokes. Recording and analysis time of SPD-CAT makes it easy and rapidly applicable in emergency room (ER) and stroke units.
Conclusion:Combining the quantitative analysis of NIHSS and SPD-CAT can better predict the side, size, and site of AIS within reasonable time table and without urgent MRI for AIS assessment and management.
Keywords:AIS (acute ischemic stroke), NIHSS (National Institue of Health Stroke Scale), SPD-CAT (Spoken Picture Description of Comprehensive Aphasia Test)
Introduction
Cerebrovascular stroke is the second leading cause for both mortality and disability in Egypt [1]. The phrase “time is brain”emphasizes that human nervous tissue is rapidly lost as stroke progresses and emergent evaluation and therapy are required [2]. Thorough neurological assessment of pa-tients experiencing acute stroke and consistent use of a stan-dardized assessment tool designed for stroke patients assists in the achievement of lesser time of assessment and man-agement throughout patient track toward proper care [3].
The National Institutes of Health Stroke Scale (NIHSS) is a systematic assessment tool that provides a
quantitative measure of stroke-related neurologic deficit. The NIHSS was originally designed as a research tool to measure baseline data on patients in acute stroke clinical trials. Now, the scale is also widely used as a clinical as-sessment tool to evaluate acuity of stroke patients,
deter-mine appropriate treatment, and predict patient
outcome [4]. However, a criticism of the NIHSS relates to its validity in certain non-dominant-hemisphere stroke syndromes. It is well recognized that an individual can score less than 5 on the NIHSS, despite having evi-dence of ischemic stroke, particularly in the posterior circulation territory [5]. Examination of the component subscales of the NIHSS reveals a focus on limb and speech impairments and relatively little attention to, for
© The Author(s). 2020Open AccessThis article is distributed under the terms of the Creative Commons Attribution 4.0 International License (http://creativecommons.org/licenses/by/4.0/), which permits unrestricted use, distribution, and reproduction in any medium, provided you give appropriate credit to the original author(s) and the source, provide a link to the Creative Commons license, and indicate if changes were made.
* Correspondence:[email protected]
example, cranial nerve lesions [6]. There are radiological correlates, when quantifying extent of cerebral damage for a specified NIHSS score; the median volume of right-hemisphere strokes is larger than the volume of left-hemisphere strokes, suggesting non-dominant strokes are required to be more severe to reach the same grad-ing on the NIHSS [7,8].
An emerging trend to complement the role of the NIHSS score with another score primarily assessing the non-dominant hemispheric functions in the initial assess-ment of the stroke patient has been started in the world’s stroke institutes. This expansion of the NIHSS may be es-pecially valuable in settings where imaging is not available or not possible, to better estimate lesion volume [9].
Among these scales assessing non-dominant hemi-spheric functions, Turc and others showed a statistical sig-nificance role of quantitative analysis of Cookie Theft Picture Description Test (originally as a part of Boston Diagnostic Aphasia Examination) with valuable benefit in initial assessment of AIS. However, such application espe-cially in different population still needs validation and sub-sequent modification and culture adaptation [10]. Similar quantitative analysis of the picture description tasks for patients having right hemispheric functions deficits is inte-grated within the comprehensive aphasia test (CAT) under the spoken picture description subscale which has been modified and culturally adapted for the Egyptian Population and been validated very recently [11,12]. The more accurate and rapid prediction of the site, size, and side of the lesion using these scales, the more efficient and suitable to be clinically implemented [13].
Aim of the study
Assessment of the additive predictive value of the pic-ture description tasks as in spoken picpic-ture description subscale of the modified comprehensive aphasia test (SPD-CAT) to that of the NIHSS as regards the main characteristics of the AIS (site, side, and size).
Subjects and methods
Study design
This study is a cross-sectional observational study.
Study site
This study was done in Stroke Units in Ain Shams Uni-versity hospitals (ASUHS).
Study period
The study started from October 2016 till August 2017.
Study subjects
Eighty six consecutive patients with AIS were examined within 48 h of onset of stroke.
Inclusion criteria
1. AIS within first 48 h
2. Premorbid language and communication fluency
Exclusion criteria
1. Patients with disturbed conscious level 2. Patients presented after first 48 h of stroke 3. Patients with premorbid neurological or
non-neurological disorder affecting the language or communication
4. Patients contraindicated to undergo MRI investigation
Methods
Patients were subjected to the following clinical and in-vestigative panel:
History (detailed history including demographic data and risk factors for ischemic stroke including age, sex, handedness, diabetes mellitus, hypertension, ischemic and rheumatic heart disease, atrial fibrillation, and smoking).
NIHSS within 48 h of stroke onset.
Spoken picture description subscale of the SPD-CAT quantitatively analyzed within 48 h of stroke onset.
Magnetic resonant imaging brain (MRI brain) within first 48 h, including diffusion weighted, T1, T2, flair, and ADC cuts.
Spoken picture description subscale of the SPD-CAT analysis includes:
A. Quantitative analysis according to
Appropriate information carrying words (ICWs)
Inappropriate information carrying words
Syntactic variety
Grammatical well-formedness
Speed of speech
The recordings and their corresponding analyses have been done according to the guidelines of ana-lysis in the modified CAT, Arabic version (5)
book-let, and revised in consensus with Phoniatrics
physicians of Phoniatrics department Ain Shams University [13] (Additional file 1).
B. Left to right ratio of the content units of ICWs of the spoken picture description
Analyzed for only 40 patients (cannot be assessed for global aphasic or incommunicable patients) ac-cording to a previously designed checklist to assess the predictability of this step for the neglect and in-attention [12].
Data from MRI brain imaging
1. Determining the hemispheric side (right, left, and bilateral hemispheric strokes) and lobar site of stroke (parietal and temporal lobes; occipital lobe; cerebellum; brain stem; basal ganglia and thalamus; periventricular and internal capsule and other multiple sites).
2. Determining the lesion volume by the equation of brain lesion volume (LV) estimation in the ADC cuts:
LV¼ðABCÞ=2
A= longest dimension in axisx
B= longest perpendicular dimension to axisx(y)
C = number of slices in which lesion appears × slice
thickness
Axisx: the longest axis of the lesion on a slice Axis y: an axis perpendicular to the axisx
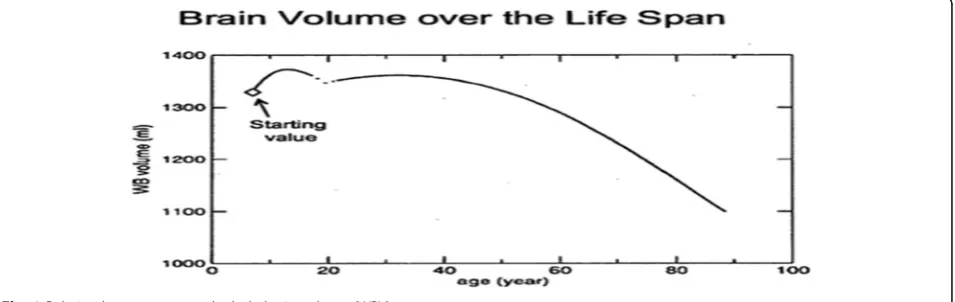
Relating the estimated lesion volume to the whole brain volume (WBV) according to the Virginia Institute of Neuropsychiatry patient application for estimating brain volume [14]
The main graph of this application shown in Fig.1
has been converted into a table containing the ages from 1 to 90 years old and their corresponding Whole brain volume values (Table1)
The lesion volume in the MRI is calculated in cubic
mm (mm3) and has been converted to ml to calculate
the percent of the lesion volume to the whole brain vol-ume by the following equation:
1mm3¼0:001ml;1ml¼1000mm3
Statistical methodology:
Table 1Showing an age range sample (50–59 years) of the relation between the age in years and the whole brain volume (WBV) in ml according to the graph of Virginia institute (Ross et al. 2016)14
Age (years) 50 51 52 53 54 55 56 57 58 59
Brain volume (ml) 1331.25 1328.75 1326.25 1323.75 1321.25 1318.75 1312.5 1306.25 1300 1293.75
Table 2Demographic data distribution of the study group
Demographic data Total (N= 86)
Age (years) 22–87 (62.34 ± 12.01)
Sex
Male 49 (57.0%)
Female 37 (43.0%)
Handedness
Right handed 85 (98.8%)
Left handed 1 (1.2%)
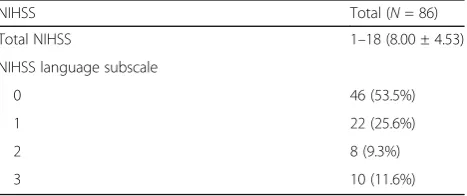
Table 3NIHSS total and language subscale scores among study group
NIHSS Total (N= 86)
Total NIHSS 1–18 (8.00 ± 4.53)
NIHSS language subscale
0 46 (53.5%)
1 22 (25.6%)
2 8 (9.3%)
Sample size was calculated using PASS® version 11 pro-grams with a minimal sample size of 81 stoke cases approx-imated to 85 cases and actual patients recruited are 86.
Data were analyzed using Statistical Program for the Social Sciences (SPSS) version 20.0.
The following tests were used for different statistical purposes:
Independent-samplesttest of significance was used when comparing between two means.
A one-way analysis of variance (ANOVA) when comparing between more than two means.
Chi-square (X2) test of significance was used in order to compare proportions between two qualitative parameters.
Pearson’s correlation coefficient (r) test was used for correlating data.
Quantitative data were expressed as mean ± standard deviation (SD) and qualitative data were expressed as frequency and percentage.
Confidence interval was set to 95% and the margin of error accepted was set to 5%. So, the probability (Pvalue) was considered significant (Pvalue≤0.05); highly significant (Pvalue≤0.001) and insignificant (Pvalue > 0.05).
Results
Demographic data distribution of the study group
Eighty-six patients enrolled with age range from 22 to 87 years with mean age (62.34 ± 12.01). Male patients
Table 4SPD-CAT total and content units scores among study group
SPD-CAT Total (N= 86)
Total SPD-CAT −29–57 (17.13 ± 27.89)
Appropriate ICWs 0–142 (16.33 ± 27.27)
Inappropriate ICWs 0–38 (3.15 ± 6.55)
Syntactic variety 0–6 (2.29 ± 2.47)
Grammatic WF 0–6 (2.51 ± 2.73)
Speed of speech 0–3 (1.02 ± 1.19)
Left/right ratio 0–1 (0.47 ± 0.49)
Table 5Total test and recording time for SPD-CAT in seconds and minutes
Total test time Recording time
In seconds In minutes In seconds In minutes
Mean 244 04:04 99.7 01:40
Median 227 03:47 87.5 01:28
Std. deviation 118.1 01:58 61.9 01:02
Minimum 50 00:50 11 00:11
Maximum 700 11:40 340 05:40
Table 6MRI lesion volume (LV), side and site among study group
MRI data Total (N= 86)
LV (ml) 0.01–712.84 (119.25 ± 182.85)
WBV (ml) 1104.69–1362.50 (1264.13 ± 63.99)
LV% 0.001–53.85 (9.32 ± 14.23)
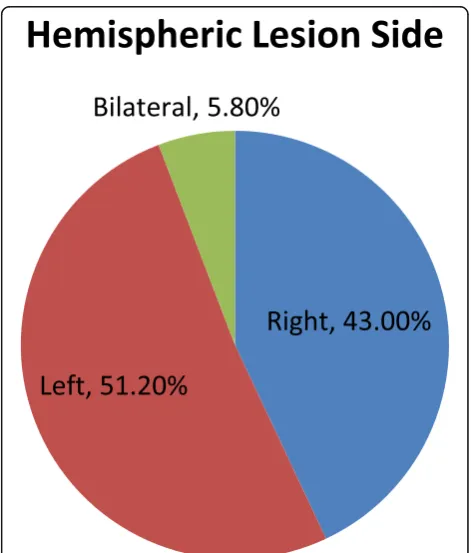
Side
Right 37 (43.0%)
Left 44 (51.2%)
Bilateral 5 (5.8%)
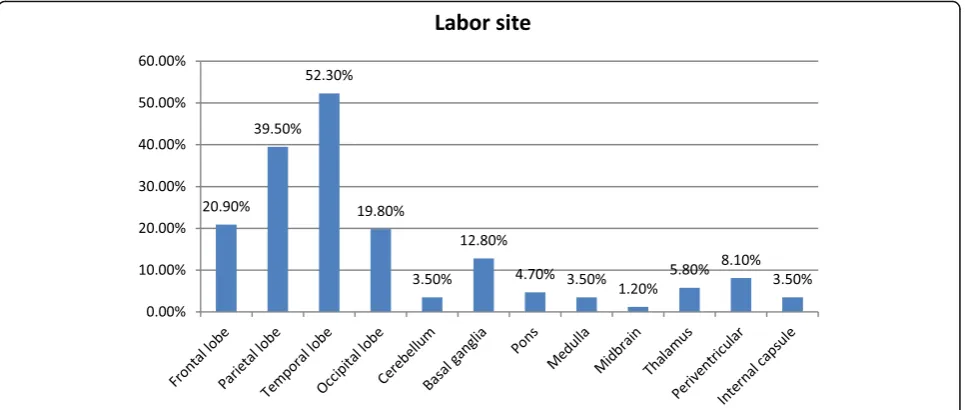
Lobar site
Frontal lobe 18 (20.9%)
Parietal lobe 34 (39.5%)
Temporal lobe 45 (52.3%)
Occipital lobe 17 (19.8%)
Cerebellum 3 (3.5%)
Basal ganglia 11 (12.8%)
Pons 4 (4.7%)
Medulla 3 (3.5%)
Midbrain 1 (1.2%)
Thalamus 5 (5.8%)
Periventricular 7 (8.1%)
Internal capsule 3 (3.5%)
constituted 57% of study cohort, while female patients represented 43%. Eighty-five patients were right handed (98.8%) (Table2).
NIHSS and SPD-CAT scores among study group
NIHSS total scores among study group ranged from 1 to 18 with mean (8.00 ± 4.53). Language subscale scores of NIHSS ranged from 0 to 3 with 53.5% (46 patients) having the score 0 indicating no aphasia, 25.6% (22 patients) scored 1 indicating mild to moderate aphasia, 9.3% (eight patients) scored 2 indicating severe aphasia while ten pa-tients (11.6%) scored 3 indicating global aphasia (Table3).
Spoken picture description of the comprehensive aphasia test (SPD-CAT) total scores among study
group ranged from −29 to 157 with mean (17.13 ±
27.89). While, content units of SPD-CAT (i.e., sub-scale scores) varied, where appropriate ICWs score ranged from 0 to 142 with mean (16.33 ± 27.27). In-appropriate ICWs ranged from 0 to 38 with mean (3.15 ± 6.55); speed of speech ranging from 0 to 3 with mean (1.02 ± 1.19). Syntactic variety score ranged from 0 to 6 with mean (2.29 ± 2.47) and grammatic word forming scores ranged from 0 to 6 with mean (2.51 ± 2.73). The left to right ratio were calculated in ratio formulation and then converted to
single figure to be statistically analyzed. The results were ranged from 0 to 1 with mean (0.47 ± 0.49) (Table 4).
The recording times of the SPD-CAT varied in length from 11 to 340 seconds with mean (99.7 ± 61.9) seconds. Total test time including recording time, re-listening, and analysis ranged from 50 to 700 s with mean (244 ± 118.1) seconds. The median total test time is 227 s, i.e., (3 min and 47 s) and the median recording time is 87.5 s (1 min and 28 s) (Table5).
MRI brain ischemic lesions volume (LV) hemispheric side and lobar site distribution among study group
MRI brain ischemic lesion volumes (LV) ranged from 0.01 to 712.84 ml with mean (119.25 ± 182.85 ml) repre-senting 0.001 to 53.85% of the whole brain volume (LV %WBV) with mean (9.32 ± 14.23%).
Thirty-seven patients (43.0%) had their lesion in the right side, while 44 patients (51.2%) had their lesions in the left side and only five patients (5.8%) had bilateral lesions.
Ischemic lesions lobar site distribution were 20.9% in the frontal lobe; 39.5% in the parietal lobe. Further, 52.3% of the stroke patients had temporal lobe le-sions. Then, 19.8%in the occipital lobe. Cerebellum was affected in only three patients (3.5%), whereas 12.8% had their ischemic lesions in the basal ganglia. Brain stem was affected in 9.4% of the cohort. Pons was affected among 4.7% of cohort patients, while medulla was affected in 3.5%. Only one patient (1.2%) had his ischemic lesion in the midbrain. Thalami were affected among five patients representing (5.8%). Further, 8.1% in the periventricular area and 3.5% in
the internal capsule (Table 6 and Figs. 2 and3).
Fig. 3Lobar site distribution of ischemic lesion among study group
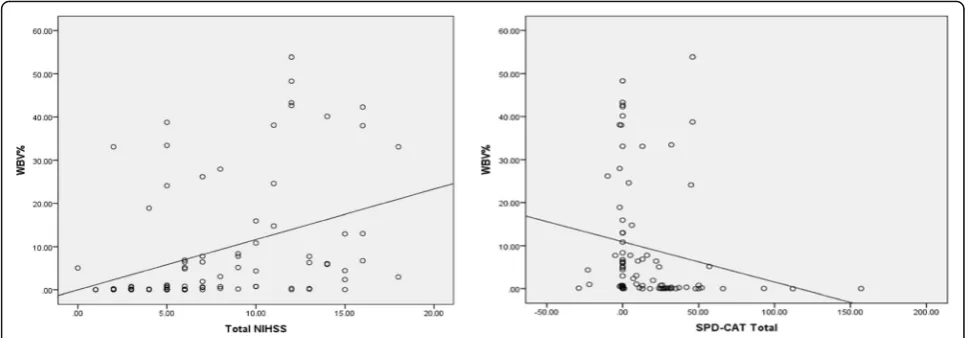
Table 7Correlation between total NIHSS and total SPD-CAT with LV%
LV%
R pvalue
Total NIHSS 0.372 < 0.001**
Total SPD-CAT −0.437 < 0.001**
Total NIHSS, SPD-CAT scales, and size of stroke in MRI brain (lesion volume LV %)
There is a statistically positive highly significant correl-ation between total score of NIHSS and ischemic lesion volume % to the whole brain volume (LV %WBV) indi-cating that the more increase in total score of NIHSS, the larger is the LV%. In the contrary, there is a statisti-cally negative highly significant correlation between total score of SPD-CAT and (LV % WBV) indicating that the more decrease in the total score of SPD-CAT suggestive of more language deficit, the larger is the LV%, which is clinically meaningful (Table7and Fig.4).
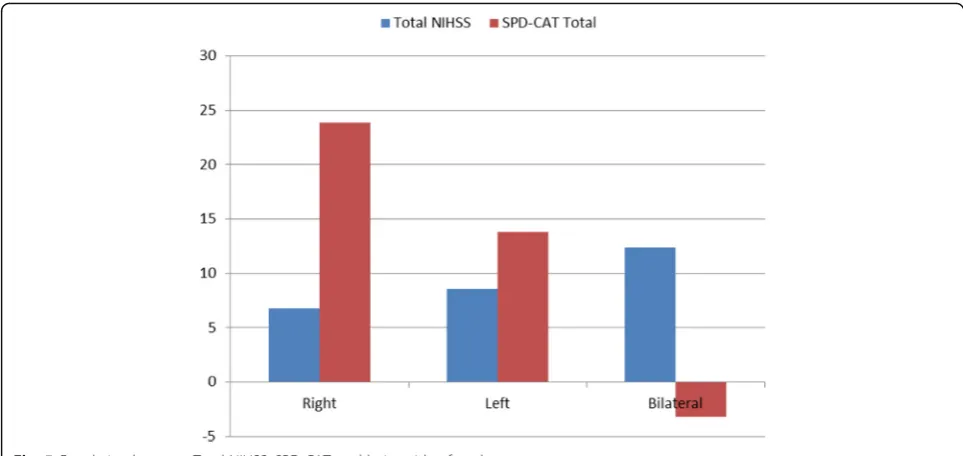
Total NIHSS, SPD-CAT, and hemispheric lesion side of stroke
There is a statistically significant relation between total score of NIHSS and hemispheric lesion side of stroke. Where bilateral hemispheric strokes had higher NIHSS scores (12.40 ± 2.51), followed by left-sided strokes (8.55 ± 5.04), then right-sided strokes with lower scores (6.76 ± 3.59).
On the other hand, there is also a statistically signifi-cant correlation between total score of SPD-CAT and le-sion side. Where bilateral hemispheric strokes had the
lower scores of SPD-CAT (−3.20 ± 11.48) indicating
higher language deficit, followed by left sided strokes (13.80 ± 16.43) and lastly right-sided lesion with the higher mean score of (23.84 ± 18.49) indicating lower language deficit (Table8and Fig.5).
NIHSS and SPD-CAT language subscale scores (i.e., language deficit distribution) across hemispheric lesion side
There is a statistically highly significant difference in lan-guage deficit distribution according to NIHSS lanlan-guage subscale scores among right-sided, left-sided, and bilat-eral hemispheric strokes, where bilatbilat-eral strokes showed the highest language deficit (3) among 40% of its cohort, while Rt. sided strokes showed no language deficit (0) among 78.4% of its cohort (Table9and Fig.6).
According to SPD-CAT, the cutoff point of significant language deficit according to this scale was less than 30 (< 30). There was a statistically significant difference in SPD-CAT total score among right-sided, left-sided, and bilateral strokes. Despite of bilateral strokes had the low-est SPD-CAT score (< 30) indicating highlow-est language deficit among 100% of its population followed by left-sided strokes 84% and lastly right-left-sided strokes among 65% of its cohort. However, the significant percentage of left-sided strokes 84% and right-sided strokes 65% Fig. 4Correlation between total NIHSS and LV% and total SPD-CAT and LV%
Table 8Correlation between total NIHSS, SPD-CAT, and lesion side
Side ANOVA
Right Left Bilateral F pvalue
Total NIHSS
Mean ± SD 6.76 ± 3.59 8.55 ± 5.04 12.40 ± 2.51 4.386 0.015*
Range 1–13 1–18 10–15
Total SPD-CAT
Mean ± SD 23.84 ± 18.49 13.80 ± 16.43 −3.20 ± 11.48 3.831 0.047*
having marked language deficit according to SPD-CAT in comparison to 60% of left-sided strokes and only 22% of right-sided strokes having mild to severe language deficit in NIHSS, suggesting that SPD is more sensitive in detecting the subtle language deficits than NIHSS es-pecially in the right-sided lesions (i.e., negligible lan-guage deficits) (Table9and Fig.6).
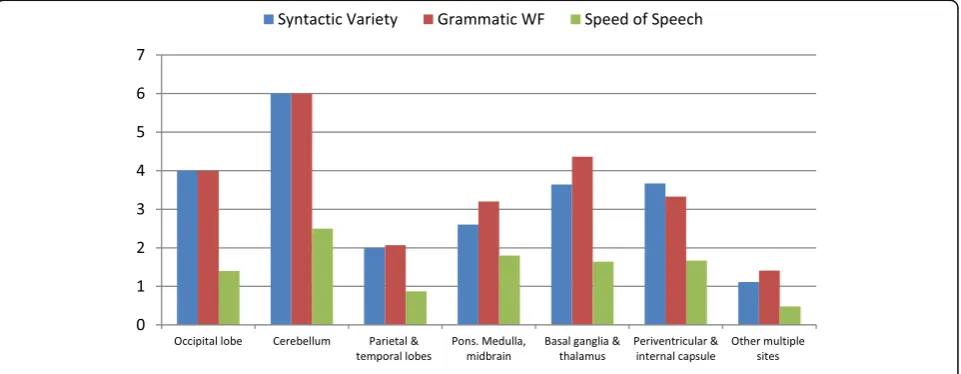
Language deficit distribution according to SPD-CAT subscale score (i.e., content units of SPD-CAT) and hemispheric lesion side of stroke
There is a statistically significant correlation between the syntactic variety, grammatic well-formedness, and speed
of speech content units “subscale scores” of SPD-CAT
and hemispheric lesion side of stroke. Where bilateral strokes had the lowest scores suggestive of more
language deficit followed by left sided strokes and lastly right sided strokes (Table10and Fig.7).
Left to right ratio of the content units of information carrying words (ICWs) of the picture of SPD-CAT and lesion side of stroke
There is a statistically significant relation between left to right ratio of the content units of information carrying words (ICWs) of the same picture of SPD-CAT and le-sion side of stroke. Right-sided lele-sions were associated with a higher mean left to right ratio score of (0.62 ± 0.48) while left-sided lesions were associated with a lower mean left to right ratio score of (0.39 ± 0.49) (P< 0.05) (Table11and Fig.8).
Total NIHSS, total SPD-CAT, content units of SPD-CAT (subscale scores), and lobar site of stroke
There is a statistically significant correlation between total score of NIHSS, total SPD-CAT, content units of SPD-CAT(subscale scores), and lobar site of stroke. Where ischemic strokes with multiple lesion sites had the highest NIHSS score (10.04 ± 4.78) and the lowest score in total SPD-CAT with more language deficit (8.85 ± 15.88) and the lowest subscale scores of content units of SPD-CAT of syntactic variety (1.11 ± 1.95) and gram-matic well formedness (1.41 ± 2.41) and speed of speech (0.48 ± 0.94) (Table12and Figs.9and10).
Discussion
In the current study, we tested the hypothesis of the effi-cacy of combining the traditional NIHSS with the SPD-CAT on prediction of the volume, site, and side of AIS Fig. 5Correlation between Total NIHSS, SPD-CAT, and lesion side of stroke
Table 9Correlation between NIHSS and SPD-CAT language subscale scores with hemispheric lesion side of stroke
Side Chi-square test
Right Left Bilateral
No. % No. % No. % X2 pvalue
Language
0 29 78.38% 17 38.64% 0 0.00% 22.904 < 0.001**
1 7 18.92% 13 29.55% 2 40.00%
2 0 0.00% 7 15.91% 1 20.00%
3 1 2.70% 7 15.91% 2 40.00%
SPD total
within reasonable time table of the initial assessment and in the settings of unavailable or delayed MRI.
We studied 86 patients recruited from ASUSHS stroke units. The patients’age ranged between 22 and 87 years with Male predominance 57% in comparison to females 43%. Most of the patients had a right handedness pre-dominance 98%. The study cohort had a variable NIHSS total and subscales scores and SPD-CAT total and sub-scales (content units) scores as well as variable sites, size, and side of ischemic lesions as shown in MRI Brain im-ages taken within first 24 h of stroke.
The statistical analysis of these data revealed that ei-ther individually or in combination to each oei-ther, NIHSS (total and subscale scores), and SPD-CAT (total and “content units”) can efficiently predict the ischemic le-sion volume and its percent to the whole brain volume (LV%WBV). In addition to valuable information about other characteristics of the AIS like lesion side and lobar site of stroke.
A similar study took place in the Department of Neur-ology, Johns Hopkins University by Agis and colleagues in 2016 [12]. They enrolled 67 patients and another 35 healthy matched controls. In comparison to our study, we enrolled 86 patients with no control group [12]. We
hypothesized that comparison between different
ischemic stroke patients in characteristics like side, site, and size does not need the comparison with healthy controls especially if the cutoff points between normal and abnormal scores of the used scales either SPD-CAT or NIHSS are already determined and validated (normal values of SPD-CAT starting from 32 and above; and normal individuals score 0 in NIHSS).
Agis and colleagues studied the significant difference between left and right strokes as well as the significant correlation with the lesion volume [12]. They used what is called regions of interest (ROI) as a determent of stroke site in contrary to our study in which we used the lobar site.
We used similar set of inclusion and exclusion criteria to enroll the patients to the study sample. Also, we depended on NIHSS total score as a validated and world-wide used tool for assessment of acute stroke held by cer-tified personnel. MRI Brain including DWI, ADC, FLAIR, T1, and T2* images were used in both studies as a solid reference for the ischemic stroke characteristics. A tech-nical difference between our study and Agis and col-leagues was in imaging processing. Where they used a computerized tool for MRI analysis using MRI Studio software to determine (lesion volume, site“ROI”and side) [12]. While in our study, we depend on the equation of Fig. 6Language deficit distribution among right, left, and bilateral hemispheric strokes according to NIHSS language subscale and total SPD
Table 10Correlation between SPD-CAT language content units“subscale scores”with hemispheric lesion side of stroke
Side ANOVA
Right Left Bilateral F pvalue
SPD-CAT total 23.84 ± 29.49 13.80 ± 26.43 −3.20 ± 11.48 3.831 0.047*
Appropriate ICWs 22.97 ± 33.00 12.45 ± 21.86 1.20 ± 2.68 2.387 0.098
Inappropriate ICWs 2.84 ± 4.30 3.18 ± 7.56 5.20 ± 11.08 0.283 0.754
Syntactic variety 3.14 ± 2.65 1.80 ± 2.19 0.40 ± 0.89 4.938 0.009*
Grammatic WF 3.46 ± 2.81 1.95 ± 2.53 0.40 ± 0.89 5.088 0.008*
lesion volume LV= (A×B×C)/2 to calculate the lesion volume and we used the patent application of brain vol-ume provided by Virginia Institute of Neuropsychiatry to be a reference for the whole brain volume [14].
Regarding the picture description tasks of SPD-CAT which considered the mile stone of both studies, Agis and colleagues used the quantitative analysis of the Cookie Theft Picture which is a part of the NIHSS scale and originally a part of Boston Diagnostic Apha-sia Test but with a simple inefficient qualitative ana-lysis. In this analysis, they used the concept of content units (CUs) which is previously used by Trupe and colleagues for a research purpose in as-sessment of right hemispheric communication deficits
in 1985 [15]. While we used the validated scale which
became culturally adapted to the Egyptian population with an Arabic native language, the spoken picture description subscale of the modified comprehensive aphasia test (SPD-CAT) with its already designed and approved quantitative analysis very recently by Aboella and colleagues in 2013 [13].
Regarding the hemispheric lesion side of stroke, we found that among 37 patients having right hemi-spheric strokes (43.0%), 24 patients have less than 30 in the total score of SPD-CAT (below the cutoff point of normal score) and only eight patients have scores of language deficit (1, 2, or 3) in language subscale of NIHSS, indicating the potential role of communica-tion processing of the right hemisphere that is
underestimated by the total and language subscale scores of the NIHSS and best accounted for by other fine, detailed assessment as provided by the picture description tasks of the SPD-CAT.
Determining the hemispheric lesion side of stroke by language deficit assessment rather than motor deficit as-sessment was one of the common aims of our study and Agis and colleagues; they generally adopted the NIHSS bias toward the left hemispheric and motoric functions and that analysis of cookie theft picture of the SPD-CAT may give an idea about right hemispheric functions in-cluding neglect, attention, integration and topic main-tenance; yet, with no specific guidance to be used in clinical practice [12].
On the other hand, our study showed statistically sig-nificant difference between left, right, and bilateral strokes in both total score of NIHSS and SPD-CAT. Right hemispheric strokes were associated with higher SPD-CAT (but not exceeding 24) and lower NIHSS score (around 6). Left hemispheric strokes were associ-ated with lower SPD (around 13) and higher NIHSS (around 9). Bilateral hemispheric strokes were mostly
as-sociated with very low SPD total score (around −3) and
a very high NIHSS score (around 13). On the levels of subscales, we found that the language subscale of NIHSS can differentiate between the right and left strokes. As high scores (2–3) are mostly associated with left hemi-spheric strokes while lower scores (0–1) are mostly asso-ciated with right hemispheric strokes.
Also, SPD-CAT showed that right strokes had the highest scores indicating the least language deficit, while left strokes had lower scores than the right and bilateral hemispheric strokes indicating the most language deficit. However, on a more detailed language subscale assess-ment, we found that SPD-CAT content units“CU”, i.e., subscale scores especially (syntactic variety, grammatic
well-formedness and speed of speech), showed
Fig. 7Relation between syntactic variety, grammatic well formedness, speed of speech, and lesion side of stroke
Table 11Relation between Left to right ratio of ICWs of SPD-CAT and lesion side of stroke
Left:Right ratio
Side ttest
Right Left T pvalue
Mean ± SD 0.62 ± 0.48 0.39 ± 0.49 4.761 0.011*
statistically significant difference between right, left, and bilateral strokes.
Regarding the left to right ratio of the content units of picture description tasks in SPD-CAT, our study re-vealed a statistically significant relation between higher ratios and right hemispheric strokes. This finding was reported independently by Agis and colleagues and can be used as a rough indicator for side of lesion [12].
Regarding the prediction of the ischemic lesion vol-ume of stroke, Agis and colleagues studied the correl-ation between the total score of NIHSS and lesion volume and found that total NIHSS score has a positive correlation with the lesion volume. Also, they studied the correlation between the lesion volume and the spoken description of cookie theft scale and found that the total content units (CUs) of SPD-CAT can Fig. 8Relation between left:right ratio of ICWs of SPD-CAT and lesion side of stroke
Table 12Relation between total NIHSS, total SPD-CAT, content units of SPD-CAT (subscale scores), and lobar site of stroke Occipital
lobe
Cerebellum Parietal and temporal lobes
Pons. Medulla, midbrain
Basal ganglia and thalamus
Periventricular and internal capsule
Other multiple sites
ANOVA pvalue
Total NIHSS
Mean ± SD
6.00 1.50 7.97 8.60 5.45 7.00 10.04 2.680 0.020*
3.08 2.12 4.44 3.78 2.73 4.69 4.78
SPD-CAT total
Mean ± SD
23.40 27.00 14.40 11.00 37.82 26.67 8.85 2.789 0.011*
18.27 4.24 29.25 25.52 45.13 22.41 15.88
Appropriate ICWs
Mean ± SD
12.20 13.50 14.53 41.20 31.27 21.50 7.44 1.918 0.088
10.71 2.12 26.17 55.72 41.28 15.63 12.66
Inappropriate ICWs
Mean ± SD
1.20 1.00 3.50 8.80 4.18 3.50 1.74 1.002 0.430*
2.17 1.41 7.35 16.41 6.54 4.72 2.65
Syntactic variety
Mean ± SD
4.00 6.00 2.00 2.60 3.64 3.67 1.11 3.717 0.003*
2.83 0.00 2.46 2.41 2.16 2.34 1.95
Grammatic WF
Mean ± SD
4.00 6.00 2.07 3.20 4.36 3.33 1.41 3.027 0.010*
2.83 0.00 2.65 2.68 2.34 3.01 2.41
Speed of speech
Mean ± SD
1.40 2.50 0.87 1.80 1.64 1.67 0.48 3.185 0.007*
independently contribute information about the lesion volume with a negative significant correlation [12].
In the current study, we reached the same results. We found a positive statistically highly significant cor-relation between total score of NIHSS and ischemic lesion volume % to the whole brain volume (LV %WBV) and a negative statistically highly significant correlation between total score of SPD-CAT and (LV % WBV).
The above finding can efficiently help preliminary clin-ical assessment of lesion volume in the absence of MRI and help in accelerating the triage process of patients, choosing the effective way of management.
Regarding the site of stroke, Agis and colleagues used MRI studio software as a computerized tool to label spe-cific regions of interests (ROIs) which were predeter-mined in a previous study and assess their significance
of correlation with NIHSS and analysis of cookie theft picture description [12].
In the current study, we used the lobar sites to deter-mine the correlation between different lobar sites and total scores of NIHSS and SPD-CAT and the content units of SPD-CAT (subscale scores). These significant correlations were found in the parietal and temporal re-gion, brainstem and periventricular and internal capsule region.
The potential role played by the picture description tasks in adding valuable information about characteris-tics of acute ischemic stroke to the standard assessment tool NIHSS and its subscales and its applicability in clin-ical setting is confirmed by measuring the mean time consumed for doing the scale. Agis and colleagues men-tioned that analysis of cookie theft picture takes less than 2 min [12].
Fig. 9Relation between lobar site and total NIHSS, SPD-CAT
In the current study, we assessed both the recording time which was found to be around 1 min and 40 s and the total test time including recoding; re-listening and analysis time and found to be around 4 min and 4 s. These findings support the idea of applicability of using such scale in ER settings as it add no significant time to NIHSS scale but adding much valuable information sav-ing the time consumed in MRI processsav-ing and help in settings where MRIs are not available.
Conclusion
Combining the quantitative analysis of both NIHSS and SPD-CAT (total and subscale scores) can better predict the site, size and side of AIS without added time or the need of urgent MRI processing to help in different as-sessment and management steps.
Supplementary information
Supplementary informationaccompanies this paper athttps://doi.org/10.
1186/s41983-019-0139-y.
Additional file 1:.SPD-CAT test.
Acknowledgments
We acknowledge Dr. Mona Sameeh Khoudiar, Lecturer of Phoniatrics Ain Shams University for her help in analysis and interpretation of (SPD-CAT) test.
Authors’contributions
MT proposed the study idea. HZ put the study design. RFH analyzed and interpreted the patient data. MS write the manuscript. All authors read and approved the final manuscript.
Funding
No funding body (not applicable).
Availability of data and materials
The datasets used and/or analyzed during the current study are available from the corresponding author on reasonable request.
Ethics approval and consent to participate
All subjects were informed of the general aim of the study and their participation was fully voluntary. Informed consent had been obtained and approved by the ethics committee for clinical research of faculty of medicine ASU. Date of Ethical Approval: 6/7/2016. Reference Number: FMASU Msc 260/2016.
Consent for publication
Not applicable.
Competing interests
The authors declare that they have no competing interests.
Received: 10 June 2019 Accepted: 19 December 2019
References
1. Institute for Health Metrics and Evaluation. Global burden of diseases, mortality and risk factors. 2010;http://www.healthdata.org/sites/. 2. Saver JL. Time is brain“Quantified”. Stroke. 2006;37:263–6.
3. Evenson KR, Rosamond WD, Morris DL. Prehospital and in-hospital delays in acute stroke care. Neuroepidemiology. 2001;20(2):65–76.
4. Richardson J, Murray D, House CK, Lowenkopf T. Successful implementation of the National Institutes of Health Stroke Scale on a stroke/neurovascular unit. The Journal of Neuroscience Nursing. 2006;38(4):309–14.
5. NIH Stroke Scale (NIHSS). NIH stroke scale International; 1999;http://www. nihstrokescale.org/.
6. Martin-Schild S, Albright KC, Tanksley J, Pandav V, Jones EB, Grotta JC, et al. Zero in the NIHSS does not equal the absence of stroke. Ann Emerg Med. 2011;57:42–5.
7. Sato S, Toyoda K, Uehara T, Toratani N, Yokota C, Moriwaki H, et al. Baseline NIH stroke scale score predicting outcome in anterior and posterior circulation strokes. Neurology. 2008;70:2371–7.
8. Woo D, Broderick JP, Kothari RU, Lu M, Brott T, Lyden PD, et al. Does the National Institutes of Health Stroke Scale favor left hemisphere strokes? Stroke. 1999;30(11):2355–9.
9. Harrison JK, McArthur KS, Quinn TJ. Assessment scales in stroke: clinimetric and clinical considerations. Clin Interv Aging. 2013;8:201–11.
10. Turc G, Maïer B, Naggara O, Seners P, Isabel C, Tisserand M, et al. Clinical scales do not reliably identify acute ischemic stroke patients with large-artery occlusion. Stroke; http://strokeblog.strokeahajournal.org/2016/05/ predicting large vessel occlusions in.html.
11. Bruce B. Letting the CAT out of the bag: a review of the Comprehensive Aphasia Test. Commentary on Howard, Swinburn, and Porter,“Putting the CAT out: What the Comprehensive Aphasia Test has to offer”. Aphasiology. 2010;24(1):79–93.
12. Agis D, Goggins MB, Oishi K, Oishi K, Davis C, Wright A, et al. Picturing the size and site of stroke with an expanded National Institutes of Health Stroke Scale. Stroke. 2016;47:1459–65.
13. Abou Ella MY, Alloush TK, Shobary AM, Dien Hafez NG, AI AEL-H, El-Rouby IM. Modification and standardisation of Arabic version of the Comprehensive Aphasia Test. Aphasiology. 2013;27(5):599–614. 14. Ross DE. System and method for calculating brain volume. United stated
virginia institute of neuropsychiatry. available fromhttp://www. freepatentsonline.com/y2016/0051178. html.
15. Hillis AE, Wityk RJ, Barker PB, Ulatowski JA, Jacobs MA. Change in perfusion in acute nondominant hemisphere stroke may be better estimated by tests of hemispatial neglect than by the National Institutes of Health Stroke Scale. Stroke. 2003;34(10):2392–6.
Publisher’s Note