31
A REVIEW ON METHOD DEVELOPMENT BY HPLC
*G. Aruna and P. Munisekhar
*Krishna Teja Pharmacy College, Chadalawada Nagar, Tirupati-517605, Andhra Pradesh, India.
Seven Hills College of pharmacy, Tirupati-517605, Andhra Pradesh, India.
ABSTRACT
This review in analytical method development by HPLC is aimed at analysts who have been performing HPLC troubleshooting and method development in Pharmaceuticals. We are trying to present an in depth study of method development primarily by HPLC method. The technique that we are discussing here is RP-HPLC. This technique offers flexibility in the use of a variety of columns, detectors, pumps etc. as per the drug requirement.
Keywords: HPLC, Method development, Validation, Chromatography.
INTRODUCTION
High-pressure, or high-performance, liquid chromatography (both are abbreviated as HPLC or simply LC is predominantly used in the pharmaceutical industry for evaluations of a large variety of samples [1,2]. It is the method of choice for checking purity of new chemical entities, monitoring changes. in synthetic procedures or scale up, evaluating new formulations, and carrying out quality control/assurance of the final drug product.
It is important to pay special attention to the following:
Develop methods that would resolve unknown potential impurities and degradation products.
Develop strategies for instrument qualification and validation to meet regulatory requirements.
Provide stringent validation of HPLC methods before they are utilized routinely.
THEORETICAL CONSIDERATIONS
Selectivity and detectability optimization have been the primary goals in HPLC separations for some time; however, HPLC practitioners who are not trained in the physical sciences are reluctant to use theoretical considerations in method development. Two main aspects comprise HPLC theory:
kinetic aspect of chromatographic zone migration is responsible for band broadening
Thermodynamic aspects are responsible for the analyte retention in the column.
The process of chromatographic zone dispersion in the column, usually called efficiency, is one of the important descriptors of chromatographic system. The rate of chromatographic zone migration is determined by the analyte competitive interactions with the stationary phase. In the isocratic separation mode this rate is constant, and the common analyte retention characteristic is the retention time (the ratio of the column length to the migration rate). Various equations have been provided to help the reader achieve optimal separations [3].
BASIC CHROMATOGRAPHIC DESCRIPTORS
Four major descriptors are commonly used to report characteristics of the chromatographic column, system, and particular separation [4].
1. Retention factor (k') 2. Efficiency (N) 3. Selectivity (~) 4. Resolution (R)
Corresponding Author: - G. Aruna Email: [email protected]
International Journal of
Medicinal Chemistry & Analysis
www.ijmca.com
e ISSN 2249 - 7587
32
Retention factor (k')Retention factor (k') is the unit less measure of the retention of a particular compound in a particular chromatographic system at given conditions defined as
k' = Vr - Vo or Tr-To
Vo To
where Vr is the analyte retention volume, V0 the
volume of the liquid phase in the chromatographic system, Tr the analyte retention time, and to sometimes defined as the retention time of non-retained analytes. Retention factor is convenient since it is independent of the column dimensions and mobile phase flow rate. Note that all other chromatographic conditions significantly affect analyte retention [4,5].
Efficiency (N)
Efficiency is the measure of the degree of peak dispersion in a particular column, as such it is essentially the characteristic of the column.
Efficiency is expressed as the number of theoretical plates (N) calculated as
N=16(Tr/w)2
where T r is the analyte retention time and w the peak width at the baseline.
Selectivity (α)
Selectivity (α) is the ability of chromatographic system to discriminate two different analytes. It is defined as the ratio of corresponding capacity factors.
α =k2/k1
Resolution (R)
Resolution (R) is a combined measure of the separation of two compounds and includes peak dispersion and some form of selectivity.
Resolution is defined as
R=T2-T1/W2+W1
NORMAL-PHASE CHROMATOGRAPHY [6]
Also known as normal-phase HPLC (NP-HPLC), or adsorption chromatography, this method separates analytes based on adsorption to a stationary surface chemistry and by polarity. It was one of the first kinds of HPLC that chemists developed. NP-HPLC uses a polar stationary phase and a non-polar, non-aqueous mobile phase, and works effectively for separating analytes readily soluble in non-polar solvents. The analyte associates with and is retained by the polar stationary phase. Adsorption strengths increase with increased analyte polarity, and the interaction between the polar analyte and the polar stationary phase (relative to the mobile phase) increases the elution time. The interaction strength depends not only on the functional groups in the analyte molecule, but also on steric factors. The effect of
sterics on interaction strength allows this method to resolve (separate) structural isomers.
The use of more polar solvents in the mobile phase will decrease the retention time of the analytes, whereas more hydrophobic solvents tend to increase retention times. Very polar solvents in a mixture tend to deactivate the stationary phase by creating a stationary bound water layer on the stationary phase surface. This behavior is somewhat peculiar to normal phase because it is most purely an adsorptive mechanism (the interactions are with a hard surface rather than a soft layer on a surface).
NP-HPLC fell out of favor in the 1970s with the development of reversed-phase HPLC because of a lack of reproducibility of retention times as water or protic organic solvents changed the hydration state of the silica or alumina chromatographic media. Recently it has become useful again with the development of HILIC bonded phases which improve reproducibility.
REVERSE-PHASE CHROMATOGRAPHY (RPC) A chromatogram of complex mixture (perfume water) obtained by reversed phase HPLC
Reversed phase HPLC (RP-HPLC or RPC) has a non-polar stationary phase and an aqueous, moderately polar mobile phase. One common stationary phase is silica which has been treated with RMe2SiCl, where R is a
straight chain alkyl group such as C18H37 or C8H17. With
these stationary phases, retention time is longer for molecules which are more non-polar, while polar molecules elute more readily. An investigator can increase retention time by adding more water to the mobile phase; thereby making the affinity of the hydrophobic analyte for the hydrophobic stationary phase stronger relative to the now more hydrophilic mobile phase. Similarly, an investigator can decrease retention time by adding more organic solvent to the eluents. RPC is so commonly used that it is often incorrectly referred to as "HPLC" without further specification. The pharmaceutical industry regularly employs RPC to qualify drugs before their release.
RPC operates on the principle of hydrophobic forces, which originate from the high symmetry in the dipolar water structure and play the most important role in all processes in life science. RPC allows the measurement of these interactive forces. The binding of the analyte to the stationary phase is proportional to the contact surface area around the non-polar segment of the analyte molecule upon association with the ligand in the aqueous eluents. This solvophobic effect is dominated by the force of water for "cavity-reduction" around the analyte and the C18
33
eluent (water: 7.3 × 10⁻⁶ J/cm², methanol: 2.2 × 10⁻⁶ J/cm²) and to the hydrophobic surface of the analyte and the ligand respectively. The retention can be decreased by adding a less polar solvent (methanol, acetonitrile) into the mobile phase to reduce the surface tension of water. Gradient uses this effect by automatically reducing the polarity and the surface tension of the aqueous mobile phase during the course of the analysis [7].
SOLVENTS
Acetonitrile, LC/MS grade:
Ideal for HPLC separations of peptides
Thermo Scientific Pierce LC/MS Grade Acetonitrile is specially purified by a proprietary method and tested to ensure lot-to-lot consistency with a low UV absorbance to provide you with the most sensitive detection across all wavelengths. Pierce Acetonitrile is 0.2-micron filtered, packaged in solvent-rinsed amber glass bottles and sealed under a nitrogen atmosphere with Teflon TFE-lined fluorocarbon caps for ultimate protection.
37 quality tests ensure low, stable baselines and lot-to-lot consistency
Low UV absorbance yields low baselines and high detection sensitivity
Low impurities protects columns and simplifies analysis by eliminating extraneous peaks
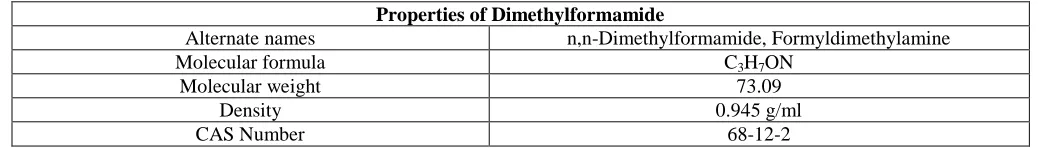
Dimethylformamide (DMF), Sequanal grade
Ideal for peptide and protein sequencing and analysis
Pierce Sequanal grade dimethylformamide is specially purified by a proprietary method and tested to ensure lot-to-lot consistency with a low UV absorbance to provide you with the most sensitive detection across all wavelengths. DMF is packaged in solvent-rinsed amber glass bottles and sealed with PTFE-lined fluorocarbon caps for ultimate protection.
Dimethylsulfoxide (DMSO), Sequanal grade
A highly stable solvent developed for use in amino acid analyzers
Pierce Sequanal grade Dimethylsulfoxide is specially purified by a proprietary method and tested to ensure lot-to-lot consistency with a low UV absorbance to provide you with the most sensitive detection across all wavelengths. DMSO is packaged in solvent-rinsed amber glass bottles and sealed with PTFE-lined fluorocarbon caps for ultimate protection.
Formic Acid Ampoules
Preparing to analyze peptides and proteins using LC/MS
High-purity Formic Acid Ampoules are a convenient, contamination-free alternative for preparing
elution solvents for HPLC separations of proteins and peptides. Open and use the vial when you need it, assuring that the formic acid has not been compromised.
Pierce high-purity formic acid is sealed in amber glass ampoules under a dry nitrogen atmosphere. A pre-measured aliquot of acid greatly simplifies preparation of liter quantities of mobile phases at the standard 0.1% formic acid concentration. The quality of this formic acid coupled with ampoule packaging provides reliability and convenience that adds value to both the chromatographic and MS results.
Heptafluorobutyric Acid
An ion pair reagent for the reverse-phase HPLC separation of proteins and peptides.
Heptafluorobutyric Acid (HFBA) Highlights
Purity > 99.5% HFBA purity and exceptional clarity, allowing sensitive, nondestructive peptide detection at low UV wavelengths in reverse-phase HPLC protein and peptide separation systems
High-performance packaging – HFBA packaged under nitrogen in amber glass ampules or bottles
Economical convenience – Choose the HFBA format that works best for your application. In just a few seconds, 1 ml ampules can be used to prepare 1 liter of fresh 0.1% heptafluorobutyric acid solution for the mobile phase in reverse-phase chromatography
Applications for HFBA:
Ion pair reagent for reverse-phase HPLC
Protein/peptide sequencing
Protein/peptide solubilizing agent
Solid-phase peptide synthesis
Amino acid analysis
Pyridine
Ideal for sequencing and analysis of proteins and peptides
Pierce pyridine is specially purified and each lot is tested to the highest specifications to ensure the integrity of your data, maximize sensitivity in your assay and to prolong the life of your equipment. Each lot of pyridine is tested to meet the following minimum specifications.
Triethylamine (TEA)
Ideal for HPLC separation and analysis of peptides
34
designed to meet the special requirements for peptide sequencing and analysis.
> 99.5% Triethylamine purity, allowing sensitive peptide detection at low UV wavelengths in reverse-phase HPLC peptide separation systems
Packaged in amber glass bottles with protective PTFE-lined fluorocarbon caps for reagent integrity.
Trifluoroacetic Acid (TFA)
Trifluoroacetic acid (TFA) is the most commonly used ion pairing agent for use in reverse-phase HPLC peptide separations because it:
Sharpens peaks and improves resolution
Is volatile and easily removed
Has low absorption within detection wavelengths
Has a proven history
High purity and exceptional clarity – allows sensitive, nondestructive peptide detection at low UV wavelengths in reverse-phase HPLC protein and peptide separation systems
High-performance packaging – TFA packaged under nitrogen in amber glass ampules or bottles with protective Teflon TFE-lined fluorocarbon caps to ensure TFA integrity
Economical convenience – Choose the TFA format that works best for your application. In just a few seconds, 1 ml ampules can be used to prepare 1 liter of fresh 0.1% v/v Trifluoroacetic acid solution for the mobile phase in reverse-phase chromatography
EFFECTS OF PH
PH in Buffer Preparation and Solubility
In pharmaceutical sample preparation, pH adjustment is possibly the most commonly used tool for adjusting and controlling the solubility of analytes and interferences. For ionizable compounds, the pH of the solvent system will have profound effects on the solubility, the chemical form of the compound and its behavior in both sample preparation and instrumental analysis, especially in LC. The acid-base equilibria that govern the pH of pharmaceutical samples are the same as those discussed in most undergraduate general chemistry and quantitative analysis textbooks, so they are not repeated in detail here. In short, control and equilibrium of the ionization of the weak acids and bases that are common pharmaceutical analytes is a critical component of effective sample preparation. Typically, analytes are either fully ionized by adjusting solution conditions to high pH for acids or low pH for bases, or ionization is fully suppressed by adjusting to low pH for acids or high pH for bases.
In developing a buffer system, the need to either fully ionize or fully suppress ionization of the analyte governs preparation of the buffer. For most pharmaceutical applications, buffer preparation is governed by the Henderson-Hasselbalch equation, which relates the desired buffer pH to the amount of an acid (acid) and its corresponding salt (base) that are mixed to make the solution:
PH = pK a + log [base] ∕[acid]
Bufers have the capacity to resist changes in pH due to additions to the solution such as analytes; this capacity is related to the buffer's total ionic strength, which for pharmaceutical applications usually need not be greater than 10 mM. The Henderson-Hasselbalch equation is effective for determining buffer components within about 2 pH units of the buffer pK a. If this equation is rearranged to solve for the base-acid ratio, it can be used to determine the percent ionization of any compound in solution for which the solution pH and analyte pK a are known. As a result, for an acidic analyte to be termed fully ionized, the pH of the solution must be at least two pH units above the pK a of the analyte, or for ionization to be fully suppressed, the pH should be at least two pH units below the analyte pK a. This idea is often used in HPLC method development and is the key reason why HPLC methods for acidic analytes are usually carried out at low pH.
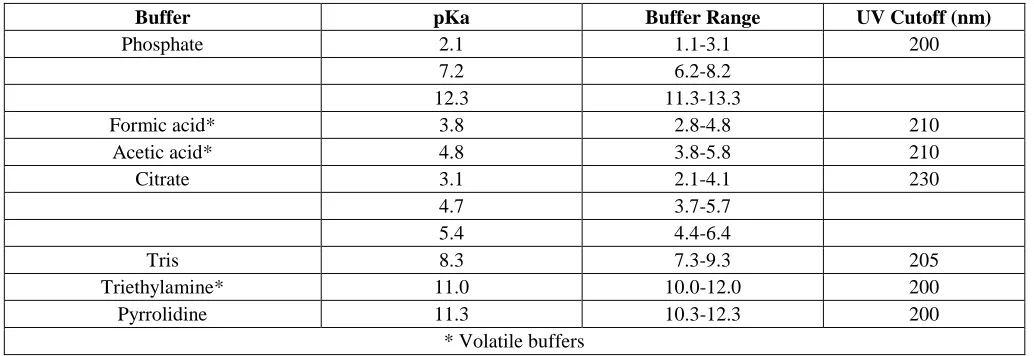
Procedure for buffer selection
Set up the HPLC method and run trials at different pH’s to establish the effect of pH change. Establish the optimum pH for the separation. Using the table, obtain a list of suitable buffers with their pKa within 1 pH unit of the desired pH. If using UV or fluorescence detection, check the UV cut-off of the buffer to ensure that it does not conflict with the detection wavelength being used.
Buffer Concentration
The buffer concentration is important for three reasons. Firstly, selectivity is affected by buffer concentration. As the concentration increases, the faster that polar species are eluted. However the rate at which their elution time decreases may be different for different sample components. Hence by changing the buffer concentration, peaks may be caused to co-elute. Conversely, it also follows that co-eluting peaks may be resolved at a different buffer concentration.
If the buffer concentration is too low, it will not be able to act as a buffer. Hence the pH will no longer be held at the required level, and as a consequence, results may be different from one day to the next. Generally speaking a buffer should be present at at least 0.005M.
35
solution becomes viscous (and hence the back-pressure becomes unacceptable), a silica based column packing will tend to dissolve, even below pH7, and solubility of the buffer becomes an issue when mixed with an organic solvent, making eluents hard to make up and gradients a risky business. Normally 0.1M would be the maximum.
If in doubt, use about 0.05M. Provided that selectivity is not an issue that should be fine. If peaks are co-eluting, try 0.1M and 0.05M.
FFECT OF TEMPERATURE
Using High Temperature HPLC for Improved Analysis: Operating HPLC at higher than ambient temperatures can improve peak shapes and enable faster run times. Preheating the mobile phase is significant in high temperature liquid chromatography as the relationship between temperature and viscosity strongly influences the mobile phase flow profile and the diffusion characteristics.
Temperature programmed liquid chromatography (TPLC) has had limited use in the pharmaceutical manufacturing laboratory because of instrument and column limitations. Traditional silica-based column packing materials are only stable up to 60 ºC under reversed conditions; however, with the creation of temperature stable column stationary phases and high temperature column hardware, TPLC has become a more routine laboratory technique. Now, instrumentation is available that allows operation up to 200 ºC with mobile phase preheating eliminating the negative effects of thermal mismatch - TPLC is set to break new ground in liquid chromatography technology. The increased regular use of high temperature to tune selectivity in separation work is gradually becoming more apparent, although column selection is still rather limited [9].
HPLC COLUMNS AND COLUMN PACKINGS
The section on column chemistry deals with modern options of base materials as well as the commonly used approaches to evaluate the surface chemistry of a packing. Specific subsections are dedicated to the selectivity of reversed-phase pickings, hydrophilic-interaction chromatography (HILIC), monolithic structures, and the reproducibility of modern packing [8].
COLUMN SELECTION
Reversed-phase (RP) LC methods are extensively utilized in the pharmaceutical industry. During HPLC method development, one of the biggest challenges is to select the stationary phase that has the desired [10,11].
Selectivity
Suitable repeatability
Stability
Since more than 600 RP-LC column (brands or types) are available on the market, the selection of appropriate columns presents significant difficulties. Selectivity of the column and peak shapes of injected compounds is highly dependent on the characteristics of the column. Better understanding of the most significant features of the columns can facilitate fast solution of chromatographic problems that occur during method development (e.g., bad peak shape or poor resolution). Properties such as column efficiency, hydrophobicity, silanol activity, ion-exchange capacity,steric selectivity, and the effect of metal impurities can be characterized by simple chromatographic tests. Calculating representative parameters of the tests allows classification of stationary phases with similar or dissimilar characteristics [12]. The classification of stationary phases can be beneficial if a column has to be replaced with a similar selectivity column or with an orthogonal stationary phase. Such chromatographic test pro- cedures can also be used to control the performance of a column at any time of its life cycle [11].
CHEMISTRYO COLUMN CHEMISTRYLUMN
COLUMN CHEMISTRY
All but few particles used in HPLC are fully porous packing. Fully porous packing have a large specific surface area, and this creates a larger retention and a larger loadability, i.e. fully porous packing are less prone to exhibit broad peaks with increased injection (with respect to both volume and mass). A typical specific surface area is in the range of 200-300 m2/g. This quite sizeable surface area resides in the pores of the packing. The pore size must be sufficiently large to allow access of the analytes to the surface of the packing. For the analysis of small molecules (molecular weight 100-500), a pore size of 10nm is about right. Some packing have a slightly smaller pore size (around 8 nm), some have a bit larger pores (about 13 nm).One needs to be careful with some of these designations though, since the methods used for the pore size measurements are not consistent from manufacturer to manufacturer, and often only nominal values are given. The 10nm (or 100 A) packing can be used for peptide analysis as well, but for larger molecules (proteins) a larger pore size, nominally 30nm (or300 A), is needed. The larger pore size provides a smaller specific surface area, therefore these larger pore packing are less retentive, and they are not commonly used for small molecules.
36
packing. Chromatographers are usually more interested in which packing would result in more retention or less retention. The retentivity of a particle can be estimated quickly by looking at the ratio of the specific surface area to the specific pore volume. This is called the particle phase ratio.
Column Characterizationand Selection
Today, the separation mode of choice for the majority of high-performance liquid chromatography (HPLC) analyses is reversed-phase liquid chromatography (RPLC).Chromatographers within the industrial settings mostly use RP-LC systems of conventional size, i.e. columns with internal diameters of 4-5mm and 10-25cm length. Many HPLC methods are described in the official compendia (e.g. European Pharmacopoeia (Ph. Eur.), United States Pharmacopoeia (USP)) and almost all use RP columns. As is the case today, most of the columns for RP-LC separations are manufactured from silica substrates. Silica has many favorable properties, making this material nearly ideal as a support for RP columns. The broad range of compounds that can be analyzed (e.g. non-ionic, ionizable and ionic compounds) has caused this widespread applicability. Other main contributions are the short equilibrium times and the possibility to perform gradient analysis [13]. The opportunity to use water rich eluents and samples during RP-LC separations is also beneficial from and environmental point of view. Today, an overwhelming number of RP columns are available on the market. Although they belong to the same type of column category, they differ in type of ligand, end-capping, type of silica, residual silanol, bonding density, pore size, etc. Several papers have been published that show the great differences in chromatographic properties between different brands of RP-LC columns. Consequently, the selectivity of stationary phases of various manufacturers is considerably diverse. Since more than 600 different RP-LC columns [14,15] are available, it is extremely difficult to select the optimal column for a given application. One has to find a stationary phase that retains the compound(s) of interest with a reasonable retention factor. The column has to have certain selectivity in order to obtain good separation of the analytes and peak shapes of the compounds have to be acceptable [16].
It is often the case that the stationary phase, which is optimal for a certain separation, cannot be used any longer. For example, sometimes the ideal column is no longer available on the market or difficult to purchase. The lot-to-lot reproducibility of the chromatographic support is occasionally not sufficient enough to transfer a method from one laboratory to another. In these and other cases, the analyst has to find a replacement stationary phase that has very similar characteristics to the original one [17].
The pharmaceutical industry often employs more than one chromatographic condition with different selectivity for impurity profiling of drugs. Applying in parallel two or more methods maximizes the possibility that all substances can be unveiled. The type of stationary phase has one of the most important influences on the orthogonality of chromatographic systems. In this case, the goal is to select few supports with significantly different selectivity. Efficient column selection is essential in order to decrease the orthogonal method development time [18].
Engelhard et al. performed the determination of impurities of salicylic acid according to the Ph. Eur. on three different commercially available RP columns. With one of the columns, all acidic solutes co eluted with the solvent; in the other columns changes in the elution sequence were observed. This example demonstrates the problem that may occur if the column properties are not sufficiently described. Faster method development procedures have used aggressive eluents under elevated temperature conditions in order to improve selectivity, efficiency and resolution, reduce solvent consumption and also decrease analysis time. Since chemical and thermal stability of silica-based phases is limited, the chromatographic characteristics of stationary phases change during usage. Therefore, the selectivities of the columns are not constant. it is not guaranteed that a used stationary phase from the same brand would give the same separation and vice versa [17].
Statistical methods facilitate the interpretation of these databases. In the literature, the chromatographic approaches have been combined with different chemometric tools such as principal component analysis (PCA), cluster analysis and radar plots. These tools further visualize groupings in order to characterize RP packing materials and to try to gain a better understanding of the underlying molecular interactions between the analyte and the stationary phase material. Especially, PCA has been shown to be extremely useful in simplifying the "data mining" process for large amounts of data. PCA provides a simple graphical comparison of the phases within the database. The stationary phases, which appear close to each other on the PCA plot, have similar characteristics. The greater the distance between two columns on the PCA plot, the more different they are. It has been also verified that columns having closely related characteristics as determined by these chromatographic tests are suitable for the same chromatographic application [13,15,16,17].
Characteristics Of Rp-Hplc Columns
37
Particle diameter,
Specific surfacearea,
Pore diameter,
Pore volume,
Chemical purity and acidity.
The silane bonding (e.g. length of the alkyl group, the usage of mono-, di- or trichlorosilanes, the surface concentration of bonded alkyl groups and the amount of unreacted, accessible silanol groups) also affects the properties of the RP stationary phases. Properties of RP-LC columns can be characterized by nonchromatographic, spectroscopic and chromatographic methods. Carbon-content, amount of metal impurities, particle size, particle shape, specific surface area, pore size, porosity, packing density and acidity can be determined by non-chromatographic methods. However, these techniques are not easy to perform and cannot be carried out on the packed column without destruction. It has also been proven that the physical parameters (e.g. carbonload, particle size and surface area) often show little correlation with the performance of the column [20]. Spectroscopic characterization of stationary phases is usually performed using
Infrared (IR) and
Nuclear magnetic resonance (NMR) spectroscopy.
Bonded phase, silanols and silanes on the solid support can be identified and information about the type of bonding can be qualitatively obtained using diffuse reflectance infrared Fourier transform IR. The various types of silanols (isolated, geminal and vicinal) can be determined using Si solid state NMR, whereas the type of bonding (mono, di or trifunctional) and type of end-capping can be determined using 13C solid state NMR. 27 A disadvantage of spectroscopic techniques, however, is that they can be used only to determine bulk characteristics of the stationary phase. Spectroscopic techniques (e.g. Si NMR) deliver complex data of surface characteristics for which the relation to chromatographic observations is uncertain [21,22].
The chromatographic approaches measure physicochemical interactions between simple well-characterized analytes and a stationary phase.Since subtle differences between the phases may have a large impact on the shape of the chromatographic peak, a chromatographic characterization is preferred. Another advantage of the chromatographic characterization is that the stationary phases can be tested under the same condition as they are used in daily practice, such as in packed columns. The chromatographic characterization of stationary phases can be divided into three classes [15].
1. Empirical-based evaluation methods
This section can be sub divided into two groups-
(i) Evaluation based on chromatographic data of test compounds chosen according to a certain line of thought, and
(ii) Evaluation based on chromatographic data of dedicated test compounds. In the case of testing columns for the applicability in analyzing basic compounds, basic compounds are used as test probes.
2. Thermodynamically based methods
The obtained information is based on studying enthalpies and entropies of transfer of solutes from the mobile to the stationary phase.
3. Evaluation methods based on a retention model
The obtained information is based on a specific retention model such as quantitative structure retention relationship (QSRR) studies [15].
Column Efficiency
Column efficiency is the degree to which species flow through the column as "bands," without being spread; less band broadening implies a less likely overlap of peaks in the chromatogram. The efficiency terms are derived from the treatment of the chromatographic column as being made up of a number of discrete narrow bands called theoretical plates, similar to a distillation column. The efficiency gives information about the quality of the filling process and the physical properties of the particles. The efficiency mostly depends on the particle size and on the alkylchain density on the silica surface. Efficiency is generally characterized in terms of theoretical plate number, theoretical plate height or reduced theoretical plate height. Column efficiency is usually measured using non-polar compounds, especially aromatic hydrocarbons. McCalley used benzene, Engelhardt employed toluene and ethylbenzene, Tanaka used propylbenzene, butylbenzene and amylbenzene, Neue used acenaphthene, Goldberg used terphenyl and biphenyl; 5-(p-methylphenyl)-5-phenylhydantoin (MPPH) was employed by Daldrup. Methanol-water, acetonitrile-water or aqueous buffer mixtures are generally used as eluent [18].
Optimizing Column Length
38
run your analysis on a shorter column.
Flow Rate Consideration
Electro spray ionization LC/MS is a popular technique for high throughput applications. Most commercial instruments are designed to accept flow rates between 10 and 1,000 µl/minute. However, flow rates around 200 µl/minute are optimal for most ESI-LC/MS interfaces. Since columns with 2.1 mm ID are operated in the flow rate range of 200 to 400 µl/minute, the optimal range for most ESI-LC/MS instruments, columns of this ID are the ones most often used for LC/MS.
The Effect of the Stationary Phase on Efficiency and Resolution
A common cause of poor column efficiency in reversed phase HPLC is interference from secondary retention that occurs when an ion-exchange interaction takes place between positively charged analytes and acidic silanols on the surface of silica stationary phase support particles. Occasionally, acidic compounds may also exhibit poor efficiency due to adsorption onto the silica support. These interactions cause peak broadening and peak tailing that interfere with the column’s ability to provide adequate resolution of all compounds of interest in a short period of time.
To minimize analysis time and maximize sample throughput:
Decrease column length
Use columns packed with high efficiency stationary phases so that column length can be reduced to minimize analysis time while maintaining acceptable resolution. Highly inert stationary phases, 3 microns in size, are recommended.
Increase flow rate
Reduce analysis time by operating at higher flow rates. Three micron size particles are recommended for high flow applications because their efficiency is less adversely affected by higher flow rates. When using gradient elution, high flow rates also shorten column equilibration times.
Use fast gradient elution
Using fast gradients allows for rapid analysis of even complex mixtures. Use with high flow rate to minimize column equilibration time. Be sure to adjust gradient time when column volume or flow rate is changed.
Contemporary liquid chromatographic systems For method development [19,23,24]
There are many different approaches to method development used in LC, from simple "trial-and-error", to
more complex multivariate approaches involving experimental design and/or chemometrics. Regardless of the approach, however, most of the basic instrument components remain the same; the solvent manager (pump), the sample manager (injector), the column and column module, the detector, and some means of recording the results; these days this is most likely to be a chromatography data system (CDS). For the most part, LC systems and components have remained unchanged for at least the last 30 years. New detectors have been introduced, and refinements made, but until recently, any LC method in use could be run on systems of early 70's vintage.
In 2004, the first LC system capable of operation up to 15,000 psi (1000 bar) was introduced, 1-6 one of the first true advancement of LC technology in three decades. The combination of a system capable of high pressure operation and columns packed with sub-2 lxm particles has been termed ultra performance liquid chromatography (UPLC) to differentiate it from HPLC. Improvements in resolving power (1.7x), sensitivity (3x)dand separation speed (9x) were demonstrated for many different applications.
There are several key components of any HPLC system, and systems used for method development are really no different. HPLC systems can be modular or integrated, and use either isocratic or gradient solvent delivery. Modular systems, as the term implies, consist of separatemodules connected in such a way as to function as a single unit.Modular systems can provide a degree of flexibility to exchange differentcomponents in and out of the system, sometimes necessary for maintenance purposes or experimental requirements. In regulated laboratories this flexibility may not be viewed as an advantage however due to compliance issues with instrument validation/qualification. In integrated systems, the individual components can share electrical, communication and fluid connections and control, and can operate in ways that provide better solvent and sample management than modular systems. Modern integrated systems are holistically designed to take advantage of managing both the sample and the solvent in ways that can significantly decrease injection cycle time and provide increased precision and accuracy while still providing flexibility in detection choices.
39
mobile phases are often more robust and accurate than premixed mobile phases when methods are in routine use [27].
Automated HPLC Method Development Systems
While scouting systems are a step in the right direction, they leave out the critical last step of method optimization. The final automation of the optimization is a natural extension of a methodical, planned method development process. But why automate? The desire to automate method development stems from the simple reason that traditional manual HPLC method development is a labor intensive, time consuming, and often imprecise process, resulting in lost time, money, and productivity, since it can take weeks or longer to develop a method manually. Automated method development systems provide an alternative to the traditional slow, manual, and unreliable trial-and-error method development approach and can often reduce method development time to as little as a few hours. Recently, systems have been developed that utilize external modeling software (e.g. DryLab | Rheodyne Inc., Rohnert Park, CA and LC Simulator or AutoChrom, Advanced Chemistry Development, Toronto), which either partially or completely automate the rest of the HPLC method development process [25].
Using theoretical based modeling software allows analysts to evaluate a much wider range of experimental conditions than would ever be practical by running experiments in the laboratory, significantly decreasing method development time. With this type of software, the effects of variables like the organic concentration, pH, temperature, and buffer concentration can be easily observed. In addition, analysts can:
Evaluate method robustness to decrease the cost of revalidating methods.
Transfer gradient methods from one instrument to another, eliminating method redevelopment time.
Model two separation variables simultaneously for faster method development.
Shorten run times to increase sample throughput.
Train new chromatographers and establish laboratory method development SOP's.
The critical component to a completely automated system is software that can make decisions from both real and predictive data; software that bridges the gap between the modeling software and CDS software that runs the system and generates data. In these systems the process of methoddevelopment starts with the help of a Windows-based wizard, an interface between the modeling software (e.g. DryLab) and the CDS. The wizard asks for specific information about separation needs, and using software protocols suggests actual starting conditions, including pH, solvent, and column. The wizard also facilitates the setup of the method in the CDS and the
system completes the analyses. A PDA spectral-based peak-tracking algorithm allows more accurate identification of sample components during the method development process, identifying peaks as selectivity and therefore elution order changes over the course of a few "chemistry calibration" runs. Once the calibration runs are processed the chromatography variables are quickly modeled, and an optimized chromatographic method prediction is obtained. Using systems of this type, with intelligent decision-making software, it is not uncommon to optimize a method in as little as four or five chromatographic runs over a just few hours [25,26].
DETECTION
Photodiode Array (PDA) Detection
Photodiode array (PDA) detection is commonly used in the laboratory to determine peak identity and purity/homogeneity. Modern detector hardware that achieves 1.2 nm resolution can yield spectral fine structure that, when analyzed by mathematical software algorithms, can reveal spectral differences between compounds with similar structures. Spectral information of this type can be used to track peaks and look for co-elution during method development as selectivity is manipulated, and identify related compounds in impurity profiles; while at the same time still being used for routine single wavelength quantitative analyses. With the advent of high speed UPLC techniques, new detector technology had to be developed to keep pace. Traditional PDA detectors have suffered from a lack of sensitivity, and an increase in bandspread that resulted in a loss of resolution. A new detector cell that did not contribute to system bandspread and much faster data rates were required to take full advantage of PDA detection in UPLC [27].
Flow Cell Technology
40
still maintains a 10 mm flow cell path length with a volume of only 500 nL. For high sensitivity work, a second cell is available with a longer path length (25 mm) without introducing additional noise. The light-guiding flow cell design results in exceptional signal to noise ratios, enabling the use of the UPLC system to, for example, determine trace levels of impurities as demonstrated .In this example, the PDA detector allows quantitation of impurities down to 0.0004%. Combining low noise, wide linear range and excellent spectral resolution at both high and low signal levels is also required for high sensitivity trace analyses. In the typical impurity profile shown in Figure 10, the active ingredient (prilocaine) is present at 1.6 absorbance units (AU), while a 0.01% known impurity (o-toluidine) shows an absorbance of 0.002 AU. Both can be quantitated in a single analysis with excellent spectral resolution for both, saving time and making the method more robust [27].
Data Rate and Filtering Constants
With 1.7 ~tm particles, halfheight peak widths of less than one second are obtained, posing significant challenges for the detector. In order to accurately and reproducibly integrate an analyte peak, the detector sampling rate must be high enough to capture enough data points across the peak, generally 25-50 for reproducible quantization.
. Typically detectors have a base sampling rate which is generally the highest data rate available. In order to get the lower data rates, points are averaged to give the lower data rate. For example, if the base data rate is 20Hz, to get 10 Hz every 2 data points are averaged, to get 5 Hz, every 4 data points are averaged. The resulting "filtered" data gives lower noise levels and lower data rates. However, filtering must be balanced against the need to collect enough data points to adequately quantitate the peak of interest and the desired signal to noise or sensitivity, requiring independent optimization. In general, the best filtering constant is the reciprocal of the sampiing rate. If increased sensitivity is desired, or if the baseline noise is interfering with integration, the filtering constant should be increased. If resolution is compromised, it should be decreased [27].
PDA Method Development Example
The PDA detector can be a valuable tool during method development. One of the ways PDA detection proves its usefulness is in tracking peaks during method development, tracking peaks when migrating methods from HPLC to UPLC. Sometimes transferring methods from HPLC to UPLC will result in selectivity changes [27].
SAMPLE PREPARATION
Samples requiring HPLC analysis of pharmaceuticals can come in many forms: as neat
chemical compounds such as APIs or drug substances, in a simple tablet or liquid matrix (the drug product) comprising a few solid or liquid excipients, complex drug delivery systems, and possibly pharmaceutical devices. In order to develop a rugged method, a statistically valid sampling plan should be developed. The sample preparation method can be labor-intensive and require considerable planning to save time [28]. Sample preparation is a critical step in the analysis of pharmaceutical products. In addition to developing methods to support these specific dosage forms, methods are required to support discovery and toxicological studies, requiring the isolation of pharmaceutical analytes from reaction byproducts, animal feed, biological fluids and tissues, waste streams, and environmental samples. All of these require sample preparation prior to analysis [29]. Sample preparation can be as simple as transferring the liquid analytes from the source container to an HPLC sample vial, or it can be quite complex requiring multiple steps such as
Solubilization
Extraction
Concentration
Cleanup
Solvent transfer
Chemical modification.
Regardless of the complexity, when the final sample is ready for injection into the HPLC it should be
An accurate representation of the original sample.
In a solvent that is the same as the mobile phase or at least compatible with the mobile phase.
In a solvent that provides sufficient stability for the duration of the analysis and any potential investigations free of particulates that could damage the HPLC system at a concentration appropriate for the method of detection and in a chemical form that is compatible with the mode of detection.
Finally, it is important to remember that sample preparation is an integral part of method development and validation. In order to develop a rugged method, a proper statistically valid sampling plan should be developed and each step of the sample preparation process should be validated in accordance with validation guidelines [28,29].
CHOICE OF SAMPLES PREPARATION
41
analyzed. For analytes in a liquid sample matrix such as syrups or saline solutions the analyte is typically in an aqueous matrix and the sample is either analyzed directly or extracted from the liquid by partitioning into an organic phase, which can be liquid or solid. For solids such as, tablets, capsules, feeds and natural products, the analytes must be removed from the solid matrix and dissolved into a liquid compatible for analysis.
The common techniques for extraction of analytes from solid matrixes are listed in Table and all have a similar approach- dissolve or suspend the matrix in a solvent, separate that solvent from the insoluble materials and then analyze the isolated solution or analyte. Regardless of the type of sample to be analyzed and the technique used, the goals of sample preparation are to cleanup or concentrate the sample prior to analysis. Each of the techniques listed in Table will be described to provide the basic concepts of their use [28].
DIRECT INJECTION
The simplest form of sample preparation is direct injection of the analyte into the HPLC system. Even if this is possible there will be sample preparations required unless the analyst can sample directly from the sample container, which is rare. Normally, the sample must be transferred to a sample vial compatible with the HPLC injection system. Even this simple step is considered sample preparation. While this is straightforward the choice of vial used for analysis may have an impact on the method if the analytes are not stable or if they interact with the container. The analyst should demonstrate through validation that there is no loss of sample due to analyte instability or interactions with the container. Furthermore, although samples may appear to be completely dissolved it is a good practice to centrifuge or filter the samples to remove particulates that may damage the LC injectors or plug the column inlet A large number of filters are commercially available and the analyst should check the vendor specifications to ensure compatibility of the filter with the solvents being used. Additionally, the analysis of blank extractions and performing recovery studies to demonstrate that the filters do not affect the assay results is an important step in method development and validation. Filters can introduce impurities and adsorb the analyte of interest.
LIQUID-LIQUID EXTRACTION
LLE is a classic sample preparation technique, and is the basis for most modern extraction methods. LLE involves the transfer of dissolved analytes from one liquid phase to another; typically LLE involves the transfer of analytes from an aqueous phase to an organic phase for purposes of
pre-concentration or cleanup, or to move the analyte to a solvent compatible with the method of analysis [30]. The main requirement is that the two liquid phases be immiscible. In general, analytes with limited solubility in an aqueous media are transferred from an aqueous phase to an organic solvent by placing both solvents in a flask or separation funnel, shaking and then removing the organic layer for analysis. While the basic technique is straightforward, understanding the fundamentals of chemical equilibrium is essential when troubleshooting extraction methods where the recoveries or precision are not meeting the expected validation criteria of the method.
LLE has long been associated with the use of large volumes of solvents (hundreds to thousands of milliliters) and long extraction times [31,32]. Modern sample preparation techniques have been developed to address this and is an attempt to replace LLE. However, due to the effectiveness of LLE, rather than employ alternative sample preparation methods such as solid-phase extraction (SPE) or solid-phase micro-extraction (SPME), many analysts have chosen to miniaturize the technique performing extractions using only a few hundred micro-liters of sample and extraction solvent. One effective approach, semi-automated LLE for biological samples, uses a 96-well LLE. Here up to 96 micro-LLE can be performed at once by using an automated system to introduce the internal standard, make pH adjustments and add organic solvents. Following shaking, the organic layer can be removed and transferred to a clean 96-well plate where the samples are dried and reconstituted for analysis by LC/MS. One example is the analysis of plasma samples where LLE is performed in 1.2-mL, 96-well format micro-tubes. Other systems have been developed to perform micro-size LLE where the contact between the aqueous phase and the organic phase, and the separation of the phases is carried out in a micro-batch glass extraction chamber. The sample, any reagents and organic solvent are introduced into a glass extraction chamber using a peristaltic pump where air carries the solutions to the chamber. The system allows for a 2-10-fold enrichment factor. Another interesting approach is hollow fiber liquid-phase micro-extraction (LPME). This method submerges an Accurel Q3/2 polypropylene tubular membrane (600 gm i.d., 200 lam wall thickness and 0.2 lam pore size), which is filled with acceptor solution, into the sample. After the analytes pass through the walls of the fiber into the extractor solution, the solution is transferred to an HPLC sample vial for analysis. For simpler automation micro-LLE (less than i mL of extraction solvent) the analyst can simply use a micro-volumetric flask, conical test tube or an HPLC sample vial [33].
42
SPE is a separation technique that uses a small cartridge packed with a sorbent (stationary phase) to trap the analytes of interest from a liquid matrix. Once trapped on the sorbent, the analytes are then eluted using a strong solvent. The mechanism is essentially an HPLC separation using mobile phases at extreme capacities. There are numerous publications that describe the application of SPE in pharmaceutical analysis for sample preconcentration [34,35], cleanup of mobile phases [36], isolating analytes from biological samples like urine [37], human plasma [38] and blood [39], or to transfer the analyte to a solvent compatible with the type of analysis to be performed. SPE is often compared to LLE since both of these techniques are used to transfer analytes from a weak to a strong solvent. Since SPE is similar to HPLC, it has potential advantages over LLE such as selective extractions and ease of automation.
SOLID SAMPLES EXTRACTION A. Liquid Extraction
For solid samples that are either the pure compound, tablet or capsule, the sample analyzed is often a sub-sample of the powder or a composite of several tablets or capsules (often <20) with a portion prepared for injection. To extract the analytes from the solid samples and transfer to a liquid for HPLC analysis requires a solvent extraction. There are two options: 1. Directly dissolve the entire sample into an appropriate solvent.
2. Pass the solvent through the sample and remove the analyte.
Common examples are the shake-flask method and Soxhlet extraction [40]. Typically, the analyst has the advantage of knowing the composition of the matrix of the pharmaceutical samples to be analyzed, which will lead to the rapid development of a sample preparation method. The conventional approach to preparing less complex solid samples is to dissolve in an appropriate solvent, filter or centrifuge the sample and inject into the HPLC. The simplicity of this approach can be misleading. The key to this approach is to assure that there are no losses of the analytes of interest during this process. Sample loss can occur during sampling (from the container provided to the testing lab), grinding, transferring, dissolving, filtering or injecting the sample. All of these steps will affect the method precision and can be evaluated together by well-designed recovery studies. If acceptable recoveries are achieved then the losses from these steps are not likely to affect the method. However, if the recoveries are not acceptable then each step of the sample preparation and the solubility parameters may need to be evaluated to determine the mechanism that results in the loss of analyte [41].
B. Shake-Flask
The shake-flask method works well when the analyte is soluble in the extraction solvent and the matrix is soluble or porous enough to allow all of the analyte to move into the solvent [40]. This technique works well for the analysis of tablets and capsules and has the advantages of eliminating the need to grind the sample. Placing whole tablets directly into the extraction flask minimizes the potential loss of analyte. Several different approaches can be employed to reduce the time required to break up the tablets such as type of shaking (shaker-box or wrist action), swirling, heating, homogenizing and sonication. For tablets that dis- solve too slowly for the whole tablet approach, practical grinding may be necessary. The use of mechanical or manual grinders presents the potential for loss of sample. The analyte can be adsorped to the container wall. Stratification of the ground particles may also occur, which may lead to uneven distribution of the analyte in the sample matrix. For example, the smaller particles may have a disproportionate concentration of the analyte, relative to the large particles. Therefore, it is necessary to remove a representative sample from the container [40-43].
C. Soxhlet Extraction
Soxhlet extraction is a classic technique for the transfer of analytes from solid sample into an organic solvent. This method is often used as the accepted standard when evaluating newer techniques such as
Microwave-assisted extraction (MAE)
Accelerated solvent extraction (ASE)
Supercritical fluid extraction (SFE).
43
available and depending on the time required to perform the extraction the most efficient and reliable approach may be to run several Soxhlet extractions simultaneously [44].
ADDITIONAL SAMPLE PREPARATION
METHODS
The traditional approaches to sample preparation are still the most commonly used procedures for pharmaceutical analysis. However, there are several additional techniques that may be considered when developing methods. Most of these techniques are useful when developing HPLC methods to extract analyte from complex matrices such as natural products, animal feed, biological fluids and tissues or from products where traditional methods are not as efficient. These situations are more common in preclinical and toxicological studies than in quality control environments.
INSTRUMENT QUALIFICATION
Equipment qualification programs implemented by the pharmaceutical industry vary considerably in the responsibilities assigned to the groups that perform and the procedures that govern the qualification activities [45,46]. These variations are caused by:
The absence of clear authoritative guidance.
The lack of detail in internationally recognized quality standards.
In addition, many factors lead to competing interpretations of the requirements and/or confusion about what exactly is required and how to achieve compliance, including voluntary standards.
Different terminologies used and different levels of support provided by suppliers, varying levels of awareness of the Food and Drug Administrations (FDAs) and their European counterparts Good Manufacturing Practices (GMPs).
Varying levels of experience on how to implement an effective equipment qualification program.
Equipment
A device or collection of devices, including their firmware and computerized controllers used to perform a mechanical process or produce a result. The term equipment encompasses instruments, e.g. blenders, high-performance liquid chromatographs (HPLCs), (tapped) density meters, particle counters, viscometers, etc.
Instrument
A device (chemical, electrical, hydraulic, magnetic, mechanical, optical, pneumatic) used to test, observe, measure, monitor, alter, generate, record,
calibrate, manage, or control physical properties, movements, or other characteristics. Examples include timers, balances, pressure gauges, chart recorders, refrigerators, water baths, voltmeters, tachometers, temperature controllers, etc. [47].
Standardization
The process of assigning a value to one standard based on another standard. For example, thermometers, sieves, and pH meters are standardized. The terms standardization and calibration are often incorrectly used interchangeably. Standardization of equipment assures precision, the closeness of agreement (degree of scatter) between a series of measurements; while calibration assures accuracy, the closeness of agreement between the value that is accepted either as a conventional true value or an accepted reference value and the value found [48].
Calibration
Calibration is defined by the EU regulators [49] as "the demonstration that a particular instrument or device produces results within specified limits by comparison with those produced by a reference or traceable standard over an appropriate range of measurements" and by ANSI/ISO as "the set of operations that establish, under specified conditions, the relationship between values indicated by a measuring instrument or measuring system, or values represented by material measure and the corresponding values of the measurand." Calibration is performed on instruments that are used to determine an absolute value to assure accuracy of this value. For example, equipment that requires wavelength accuracy (radiation sources, detectors), balances, and temperature recording devices are calibrated. Calibration must be performed by utilizing references standards and materials traceable to national or international standards (NIST, ASTM, etc.) to ensure accuracy of the data produced [50].
Verification
Verification is defined as "a means of confirming by examination and provision of objective evidence that specified requirement have been fulfilled [50].
Qualification
44
qualification (EQ) provides documented evidence that the equipment is suitable for its intended use, improves confidence that the data produced by qualified equipment is reliable, and provides the basis for all subsequent analytical work (including method validation). Once equipment comprising different modules has been qualified, it must be treated as one unit. For example, a detector of a qualified HPLC cannot be transferred from one qualified system to another. The firmware versions of both units could be different and the exact impact of minor difference in firmware can only be assessed by the manufacturer/supplier of the equipment.
ROLE OF HPLC IN PHARMACEUTICAL
DEVELOPMENT
FROM PRE-CLINICAL TO POST APPROVAL
High performance liquid chromatography (HPLC) is a very powerful and flexible tool that forms the analytical backbone for the entire drug development process, from discovery to the final release of commercial product. One of the key advantages of HPLC is that this technique is extremely flexible and can be adapted to fulfill the analytical needs of each stage in the drug development process. The drug development process first begins with unknown and uncharacterized compounds, or mixtures of compounds, that have not been fully characterized. The methodologies that are utilized at this stage to first characterize the substance, must then be employed later in the development phase, in a more regulated good manufacturing practices (GMP) environment. In this role the HPLC technique will still solve analytical problems, but the added burden of doing so in highly regulated and controlled manner, creates new hurdles for the development laboratory. Finally, the analytical technique will need to be transferred to the quality control laboratory to ensure the purity, and efficacy of the commercial product. This technique will need to be simple, rugged, and robust and can be used in the quality control laboratory with minimal training. The method must also be "QC" friendly, in that it must be cheap, fast, and should not generate errors, since these will lead to costly manufacturing investigations [51,52].
Driving Factors for HPLC Method Development in Drug Discovery
During the discovery phase the key driving factor is the scientific requirements. The HPLC methods that are utilized at this stage generate information about the compounds that are being screened. During the discovery phase, as much knowledge about the compounds must be collected as quickly as possible. The goal is to eliminate candidates that will fail at later (and more expensive) clinical
stages of development, as early as possible. The analytical tools at this stage represent the cutting edge of analytical science. As much information is collected, as rapidly as possible about the compounds being screened, so that the key decisions can be made.
Advanced techniques such as HPLC-MS and HPLC-NMR will be employed to identify, quantify, and characterize the compounds being screened. The advanced techniques utilized also require that highly skilled individuals be part of the drug discovery process. Highly trained (doctorate level) and experienced scientists will be responsible for all of the analytical work conducted at this stage, to ensure that the best science that can be done is conducted. The end goal is to make accurate and rapid decisions about as many compounds as possible, so that only the most likely candidates are promoted to development. Since no humans will be exposed to these compounds in a clinical setting, there are no regulatory requirements for these methods. As a result, the typically cumbersome requirements of cGMP work, such as change control, method validation, and system qualification, are not required (although some validation may be needed from a business perspective). This means that HPLC methods at this stage can be much more flexible and can be changed when deemed scientifically necessary. The analytical tools are used to make the critical decisions to decide which compounds should be promoted to full development status.
Because of this it is absolutely critical from a business perspective that any compound that would not be safe or effective be screened out during the discovery phase. If a candidate compound, which would not be safe or effective, is not screened out during the discovery phase and makes it to the development phase, then it will likely fail one of the much more expensive clinical trials. This not only hurts the company in terms of the cost of the failed clinical study, and other development costs, but it also wastes some of the company's pipeline resources. The discovery phase is a collaboration of the scientific and business functions of a pharmaceutical company. The best science that is available must be brought to bear in order to screen as many potential drug candidates as possible. The scientific tools must be able to screen out as many compounds as possible that will fail later stages. This is the most cost effective and safest approach to drug discovery/development.