Int. J. Industrial Mathematics Vol. 1, No. 2 (2009) 175-181
Lagrange Two-Dimensional Interpolation Method
for Modeling Nanoparticle Formation During
RESS Process
A. R. Bozorgmanesha, M. Otadi b, A. A. Safe Kordic, F. Zabihid, M. Barkhordari Ahmadie
(a) Department of Chemical Engineering, Science and Research Branch, Islamic Azad University, Tehran, Iran
(b) Department of Chemical Engineering, Central Branch, Islamic Azad University, Tehran, Iran
(c) Department of Chemical Engineering, Sharif University of Technology, Tehran, Iran (d) Department of Chemical Engineering, Ayatollah Amoli Branch, Islamic Azad University, Amol, Iran
(e) Department of Mathematics, Bandar Abbas Branch, Islamic Azad University, Bandar Abbas, Iran
||||||||||||||||||||||||||||||||-Abstract
In the pharmaceutical industry, a great number of products are in the form of particulate solids. Since the mid-1980s, a new method of powder generation has appeared involving crystallisation with supercritical uids (SCF). The rapid expansion of supercritical solu-tions (RESS) is a promising new process for the production of small and uniform particles. Several variables can inuence the RESS process: the nozzle temperature, preexpansion pressure, the nozzle diameter, and geometry. In this work, a two-dimensional Lagrange in-terpolation method has been proposed to describe the size of nanoparticle forming through the rapid expansion of supercritical solutions, as a function of preexpansion pressure and nozzle temperature.
Keywords: 2D-Lagrange interpolation, RESS, Modeling, Nanoparticle generation.
||||||||||||||||||||||||||||||||{
1 Introduction
2.1 A two-step process: Solubilisation and particle formation
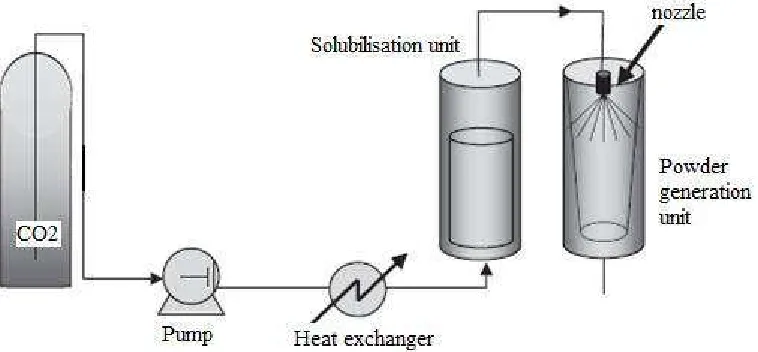
RESS is a two-step process: after having solubilised a substance in an SCF, the mixture is suddenly depressurized in a nozzle, causing fast nucleation and ne particle genera-tion(Fig.1).
Fig. 1. The key parameters of the extraction step are obviously the operation T and P.
3 Mathematical modeling
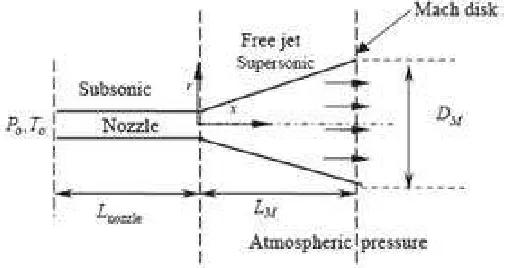
Fig. 2. Schematic presentation of the RESS expansion device.
An understanding of the underlying physical phenomena of the relationship between the mechanisms of particle formation and growth during the RESS process is still at a rather early stage. It sounds that tting an adequate mathematical equation by experi-mental results, can predict the general trends of particle size.
3.1 2D-Lagrange interpolation
2D-Lagrange interpolation is based on 1D-Lagrange interpolation. In this method, one of the variables is forced to be constant and, with another variable, the Lagrange polynomials can be written by using the given data. Then, this value can be complicated for the nal form of 2D-Lagrange interpolation. The result is a 2D-Lagrange polynomial whose functional agents are replaced by Lagrange polynomials. The interpolation formula of Lagrange may be a more straightforward way for obtaining a function in explicit form. 2D-Lagrange polynomials can be described as follows:
Lij = Li(x)Lj(y) 0 i n; 0 j m
Li(x) = n
Y
s=0;s6=i
(x xs)
(xi xs); Lj(y) = m
Y
s=0;s6=j
(y ys)
(yi ys)
So we have
Lij(xr; ys) =
1 i = r; j = s
0 otherwise
And then we have:
P (x; y) =Xn
i=0 m
X
j=0
f((xi; yj))Lij(x; y)
1
9375(p 80)(p 90)(p 100)(p 110)
[ 91
15000(T 85)(T 90)(T 95)(T 100) 375096 (T 80)(T 90)(T 95)(T 100)+
315
2500(T 80)(T 85)(T 95)(T 100) 3750498(T 80)(T 85)(T 90)(T 100)
+15000769 (T 80)(T 85)(T 90)(T 95)]+
1
10000(p 80)(p 85)(p 100)(p 110)
[ 89
15000(T 85)(T 90)(T 95)(T 100) 375093 (T 80)(T 90)(T 95)(T 100)+
251
2500(T 80)(T 85)(T 95)(T 100) 3750479(T 80)(T 85)(T 90)(T 100)
+ 701
15000(T 80)(T 85)(T 90)(T 95)]
1
3000(p 80)(p 85)(p 90)(p 110)
[15000287 (T 85)(T 90)(T 95)(T 100) 3750330(T 80)(T 90)(T 95)(T 100)+
405
2500(T 80)(T 85)(T 95)(T 100) 3750551(T 80)(T 85)(T 90)(T 100)
+ 812
15000(T 80)(T 85)(T 90)(T 95)]
1
15000(p 80)(p 85)(p 90)(p 100)
[2690
15000(T 85)(T 90)(T 95)(T 100) 32003750(T 80)(T 90)(T 95)(T 100)+
3600
2500(T 80)(T 85)(T 95)(T 100) 10503750(T 80)(T 85)(T 90)(T 100)
+1150
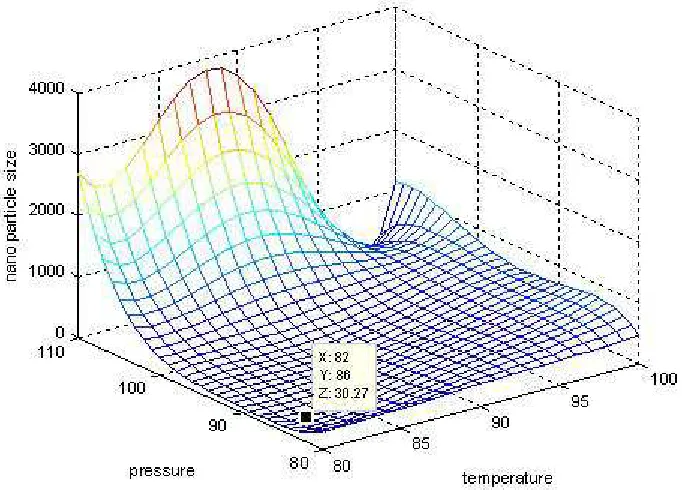
Fig. 3. Calculated size of nanoparticles as a function of nozzle temperature and preexpansion pressure.
4 Optimization
Fig. 5. SEM image and PSA results for the sample processed in P=103 bar and T=86 0C.
5 Conclusion
A mathematical model has been used as a novel method for data prediction. Actually, we matched a 2D-Lagrange interpolation model with our experimental data. The calculated data was checked with the experimental data in the optimal condition and other conditions, and a comparison between them conrms that the interpolated and experimental results are in good agreement with each other.
References
[1] A.I.Cooper, Polymer synthesis and processing using supercritical carbon dioxide, J. Mater. Chem. 10 (2000) 207-234.
[2] J. Jung, M.Perrut, Particle design using supercritical uids: literature and patent survey, J. Supercrit. Fluids 20 (2001) 179-219.
[3] U.B.Kompella, K. Koushik, Preparation of drug delivery systems using supercritical uid technology, Crit. Rev. Ther. Drug Carrier Syst. 18 (2001) 173-199.
[4] R. Marr, T. Gamse, Use of supercritical uids for dierent processes including new developments-a review, Chem. Eng. Proc. 39 (2000) 19-28.
[5] S. Palakodaty, P. York, Phase behavioral eects on particle formation processes using supercritical uids, Pharm. Res. 16 (1999) 976-985.
[6] E. Reverchon, Supercritical antisolvent precipitation of micro- and nano-particles, J. Supercrit. Fluids 15 (1999) 1-21.
[7] T.L. Rogers, K.P. Johnston, R.O.Williams III, Solution-based particle formation of pharmaceutical powders by supercritical or compressed uid CO2 and cryogenic spray-freezing technologies, Drug Dev. Ind. Pharm. 27 (2001) 1003-1015.
[9] B. Subramaniam, R.A. Rajewski, K. Snavely, Pharmaceutical processing with super-critical carbon dioxide, J. Pharm. Sci. 86 (1997) 885-890.