Temporal and spatial variation of hardness and total dissolved
solids concentration in drinking water resources of Ilam City
using Geographic Information System
Zabihollah Yousefi1, Reza Ali Mohammadpour Tahmtan2, Farzad Kazemi3*
1Professor, Department of Environmental Health Engineering, School of Public Health, Mazandaran University of Medical Sciences, Sari, Iran
2Associate Professor, Department of Biostatistics, School of Public Health, Mazandaran University of Medical Sciences, Sari, Iran 3MSc Student, Department of Environmental Health Engineering, School of Public Health, Mazandaran University of Medical Sciences, Sari, Iran
Abstract
Background: In recent times, the decreasing groundwater reserves due to over-consumption of water resources and the unprecedented reduction of precipitation, during the past 1 decades, have resulted in a change in the volume and quality of water with time. The aim of this study was to determine the spatial and temporal variations of hardness and total dissolved solids in drinking water resources of Ilam city, using the GIS system.
Methods: This cross-sectional study was carried out on 20 sources of drinking water in Ilam and the results of 5 years archived by the Water and Sewage Co were analyzed using geographic information system (GIS) software version 9.3, SPSS version 16 and one-way analysis of variance (ANOVA). The sampling and measurement were also performed in this study based on the Standard Method book. Results: The ordinary kriging method and spherical model are the best interpolation methods for hardness and total dissolved solid, due to the normal distribution of data. The highest values of parameters in most cases are related to the western parts based on maps. The one-way ANOVA test showed that the average amount of total hardness (P = 0.68) and total dissolved solids (P = 0.6) in different seasons of the year are the same.
Conclusion: Overuse of groundwater due to illegal digging and permanent easy access to water, increased the salinity of water in the central sections of the studied area. Proper planning that allows the withdrawal of water from authorized underground aquifers or water supply from surface water or dams should be done to overcome this problem.
Keywords:Geographic information system (GIS), Temporal and spatial variation, Hardness, Total dissolved solid, Drinking water resources, Ilam city.
Citation:Yousefi Z, Mohammadpour Tahmtan RA, Kazemi F. Temporal and spatial variation of hardness and total dissolved solids concentration in drinking water resources of Ilam City using Geographic Information System. Environmental Health Engineering and Management Journal2015; 2(4): 203–209.
*Correspondence to: Farzad Kazemi
Email: [email protected] Article History:
Received: 2 September 2015 Accepted: 17 December 2015
ePublished: 24 December 2015
Introduction
Water electrical conductivity is a total parameter for sol-uble materials and ion separation, its ability have a deter-mined ratio with the total dissolved solid (TDS) of water, for this reason, it is important for simple control of water quality. The amount of TDSs is calculated by multiplying the electrical conductivity ability by an experimental coef-ficient (0.7 to 0.55) (1). The extreme amounts of TDS can have different negative effects such as increase of soap us-age, create speckle on dishes, blasting vapor pots, etc (2). Hard water is defined as water that requires a considerable amount of soap for spume and creates germ in warm wa-ter pipelines, heawa-ters, boilers and other units, when warm water comes in contact with them (3). Water with hard-ness greater than 200 mg/L can create germ deposit in
the distribution and consumption system of soap; on the other hand, water with hardness of less than 100 mg/L is corrosive to pipes (4).
Water can cause sedimentation problems when associated with the digestive system. Studies have shown that the cor-rosion products at the surfaces of pipes can be deposited or accumulated in distribution networks and may protect microorganisms from being disinfected, resulting in the multiplication of these microorganisms and problems such as taste and odor, mass biological and increase in corrosion may occur (5,6).
The corrosive waters rise to secondary pollutants, such as iron, zinc, copper and manganese, in concentrations higher than the standard drinking water, problems, such as taste, smell, color and stains on the toilet may occur
© 2015 The Author(s). Published by Kerman University of Medical Sciences. This is an open-access article distributed under Environmental Health
Engineering and Management Journal HE
M J
Original Article
(7). A review by Avazpour et al (8) on Ilam city’s drinking water revealed that it is corrosive.
Due to the significant expansion of carbonate rocks in the province and several appropriate conditions, the aquifer water potential fit with the rock formations. The major factors in the formation of limestone aquifers in the prov-ince are “open striking limestone, performance of tectonic forces that result in the collapse of the compact and close together, average annual temperatures in mountainous ar-eas and good rainfalls.
TDS is one of the most important factors in water qual-ity and has impact on transport, chemical transformation and ionization of material. The quality of irrigation wa-ter, TDS, salinity risk can be divided into four namely low risk (<500 mg/l), medium risk (500-1000 mg/l), high risk (1000-2000 mg/l) and very high risk (>2000 mg/l)(9). Hardness is a concept by which the amount of calcium and magnesium ions is expressed and is a measure of wa-ter quality. Despite the importance of hard wawa-ter to the body, its disadvantages are numerous. Hard water causes loss of taste to drink. The late maturation of crops as a re-sult of water hardness is another complication (10). Studies that stressed on the hydrological and hydro dy-namical aspects of water resources have been carried out, however, it was reported that a qualitative research on underground resources is a fundamental and applied movement for obtaining qualitative information on water resources (3).
In a study by Ehsani et al (11), the total amount of dissolve solids throughout the plateau was investigated and infor-mational layers were designed. In a study by Rahmani and Shokohi (3) on the quality of Hamadan underground wa-ter, the results obtained showed that, according to aqui-fer quantity drop off, the quality changes of underground water resources are yet to attain an intensive state and one third of the stations have TDS that are more than the standard level (3). Therefore, the aim of this study was to determine the spatial and temporal variations of hardness and TDSs in the drinking water of Ilam city using geo-graphical information system (GIS).
Methods
According to the “geographical situation and political di-vision of Ilam city” in Ilam province, 19086 km2 forms 1.4% of the total area of the country. It is placed in the west edge of Zagrous mountains between 31°58' and 34°15' N in width from the equator, and 45°24' to 48°10'
E longitude from the Greenwich meridian, in the west of Iran. Ilam shares a common border with Khozestan from the south, Lorestan from the east, Kermanshah from the north (inside provinces) and Iraq with 425 km from the west (has common border). According to the recent po-litical divisions in 1996, Ilam has 7 city, 17 town, 15 state, 36 rural district and 753 villages.
In determining the region in this descriptive research,, the maps of management and programming organization were used. Wells sampled according to latitude and
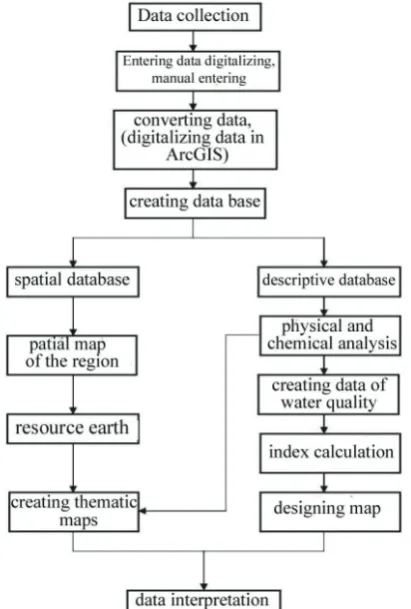
lon-gitude on a map were found. The obtained results of the chemical parameters in 2009-2013, which are being used once in a season by water and wastewater organization, were entered into the GIS software and were reserved as an information bank. Data were collected from all water sources in the city of Ilam (20 wells), respectively. The re-search results after the parameters’ process were colored by GIS that can describe the process of parameters’ chang-es in spatial and temporal situations as shown in Figure 1. This figure shows provision of field maps of different pa-rameters in a thematic model.
Statistical population: All sources of drinking water (20 wells).
Sampling method: Experiments on chemical parameters were conducted once in a season by water and wastewater organization.
Data analysis and comparison were done using SPSS® 16 software and analysis of variance (ANOVA) statistical test, respectively. Thereafter, the data were entered into data base GIS program (ArcGIS® 9.3). After the entering of
data, the preparation of informational layers parameters’ maps was extended (Geostatistic). Data ordering, cessing and analyzing were carried out in order to pro-vide suitable diagrams for spatial modeling in ArcGIS® 9.3
software.
Results
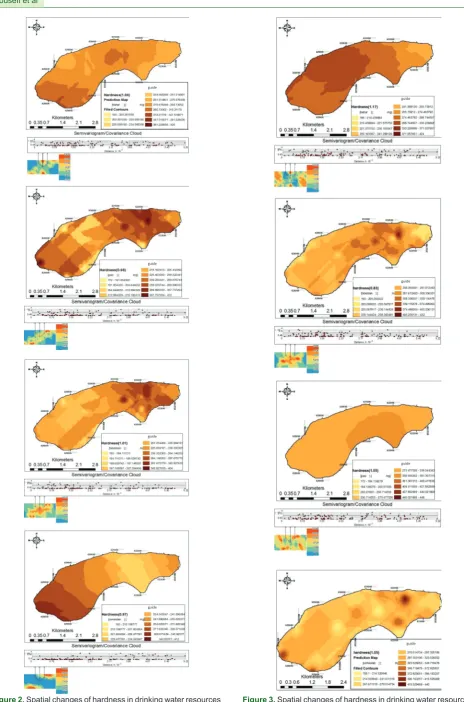
Figure 2 shows the spatial changes of total resources of drinking hard water in Ilam in different seasons of 2009.
Figure 2. Spatial changes of hardness in drinking water resources
of Ilam city in different seasons in 2009. Figure 3.of Ilam City in different seasons in 2013. Spatial changes of hardness in drinking water resources
guide
guide
guide
guide
guide
guide
guide
The best interpolation methods for hardness according to normal data distribution were the normal kriging and spherical models. The root mean square errors (RMSE) for spring, summer, fall and winter were 1.04, 1.01, 0.98 and 0.97, respectively. According to the interpolation map, the amount of water hardness was varied in different sea-sons, so as to have high concentration during spring and winter in the western areas, but in the other two seasons, the concentration was, low. In general, the concentration of hardness was high in all areas.
Figure 3 shows the spatial changes of hardness in drinking water resources of Ilam in different seasons in 2013. The RMSE for spring, summer, fall and winter were 1.17, 0.83, 1.05 and 1.05 respectively. According to the interpolation map, the amount of water hardness was varied in different seasons, in order to have high concentration in the west-ern areas during winter and spring and low concentration in the other two seasons in the west. In general hardness concentration is high in all areas. The ANOVA test shows that the total mean hardness in different seasons of the year is similar (P = 0.68), while the mean of hardness in wells and different resources have significant differences (P < 0.001).
The total hardness mean of all experiments on water re-sources under examination was 316.4 ± 78.5 mg/l and the variance analysis test shows that the mean results of the verification tests and measurements in different seasons
in different years were significant (P = 0.1).
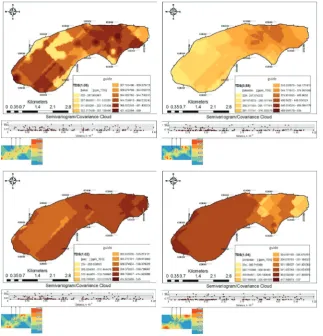
Figure 4 shows the spatial changes of TDSs in Ilam city’s drinking water resources in all seasons of year 2009. The best interpolation method for dissolved solids according to data distribution were normal kriging and spherical model. The RMSE for spring, summer, fall and winter were observed as 1.08, 0.88, 1.02 and 1.04 respectively. According to the interpolation maps, high amount of dis-solve solids was observed in the western areas, except for summer in which high concentration was seen in eastern areas. The high amounts were seen during spring and fall. Figure 5 shows the spatial changes of TDSs of Ilam city’s drinking water resources in different seasons in 2013. The semivariogram drawn on each map represents spatial cor-relation between samples. The RMSE for spring, summer, fall and winter are 1.14, 0.99, 1.08 and 1.12, respectively. The high amounts of dissolved solids based on the inter-polation map were observed in the western areas. How-ever, high concentration was observed during spring. The one-way ANOVA test shows that the means of the TDSs in different seasons were similar (P = 0.6), while the mean of wells and other resources had significant difference (P < 0.001).
Furthermore, the results of the verification test show that the total means of the TDSs on water resources was 414.2 ± 99.14 mg/l, and the ANOVA test shows that the mean of verification test results had significant
differ-Figure 4. Spatial changes of TDSs in drinking water resources of Ilam city in different seasons in 2009. guide guide
ence with different seasons measured in different years except for during spring (P = 0.012), summer (P = 0.04), fall (P = 0.072) and winter (P = 0.05), based on the process in different years as well as increase and decrease in the amount of rainfalls, these differences were predictable. Table 1 shows the comparison between delivered data and analyzed samples. As the table shows, the trend of these data is on the increase.
Also, the increasing trends of TDS and hardness are shown in Figures 6 and 7.
Discussion
In the optimal management of water resources, reversing and promoting the water resources require data in rela-tion to situarela-tion, quantity and water chemical reacrela-tions in a special geographical area. The aim of this study, there-fore, was to determine spatial and temporal changes of
Figure 5. Spatial changes of TDSs in drinking water resources of Ilam in different seasons in 2013.
Table 1. Comparison of the results of water, wastewater and verification
Chemical parameters Average data for 20 wells in the years 2009-2013
The average results
of verification for 20
wells in 2015
TDS (mg/l) 364.4761 414.2
Total Hardness (mg/l CaCO3)
273.7018 316.4
Figure 6. Changes in the value of total hardness in years 2009-2013 and verification in year 2015
Figure 7. Changes in the value of TDS in years 2009-2013 and verification in year 2015..
hardness and TDSs of Ilam’s drinking water resources, the most suitable interpolation method was used to spatially investigate and analyze the parameter amount in Ilam. Determining the best method of interpolation for water chemical quality:
According to all obtained maps in this study, the best method of interpolation was kriging. The study of spatial changes of underground salty water based on statistical earth (case study: Rafsanjan) by Taghizadeh Mehrjerdy et al (12) showed that in determining the salinity of wa-ter kriging method has priority over the inverse distance weighted (IDW) method (12).
A study was carried out to determine the best methods of statistics maps changes in TDS and TH groundwater city of Fasa, it was shown that among the deterministic methods for mapping changes in TDS in the area, the or-dinary kriging, using Gaussian model that is lower than other methods as result of the small RMSE and ME value, was more suitable (13).
Gholami et al (14) researched on the modeling of ground-water salinity on the Caspian southern coasts and re-ported that there is a relation between water EC and TDS (TDS = 0.6 EC).
In order to better understand the spatial constructions of the adopted samples and select the best interpolation method, spatial correlation between the samples were studied. This investigation was obtained by drawing a distance between samples and samples’ value variance or by drawing semivariograms. Based on the theory that the characteristics of different phenomena have more similar-ities in near places than far places, the degree of correla-tion and dependency was measured (15).
Also, in order to investigate the interpolation methods, the RMSE statistical parameter was used, so that the lesser the amount, the better the method. In this study, the least amount of root mean square error in all two cases showed that except for kriging method, the spherical model was the most used for the interpolation of hardness variables and TDSs.
In a study by Yousefi and Naeej (16) on Amol nitrate in rural wells and deep wells, it was concluded that nitrate was far lesser than the shallow wells (16). This result is consistent with the results of the present study.
In this study, hardness and dissolved solids in the year 2015 has increased when compared with previous years, and this could be attributed to pollution as a result of the industrial and agricultural activities in the study area. Dianati et al (17) in their study on the comparison of zon-ing maps, pointed out that GIS represents an increase of over 1380-1390 average of these parameters.
Dianati and Falah (18) conducted a study on the change of electrical conductivity and hardness of groundwater in the coastal city of Sari. The results showed that the electri-cal conductivity and hardness of groundwater of Sari city dropped from north to south (the sea coast) and in places where the electrical conductivity was high, but was hardly significant, however, lake or near to river does not have
significant impact on the hardness. The average level of electrical conductivity in the dry season was higher than in the wet season and the average level of hardness of groundwater in the wet season was higher than in the dry season (18).
Samadi et al (19) in their study on the survey of water qual-ity in Moradbeik river based on the water qualqual-ity index (WQI) index by GIS, showed that the distribution of pol-lution, river polpol-lution, and low rainfall for several months is more rain. Pollution of rivers in the rainy months can-not generally be reversed.
The increasing trend of total dissolved solids (TDS) and hardness (displayed in Table 1 as well as Figures 6 and 7) has become an alarm to the authorities of water and wastewater organizers to design proper program that will help prevent the increase.
Conclusion
Normal kriging, which involves the use of Gaussian mod-el due to its smaller ME & RMSE value, is more suitable for the preparation of total hardness (TH) changes maps among other methods.
In the examination of the zoning maps, salinity problem was seen in the western parts of the Central Highlands. The reasons for the development of salt can be attributed to excessive use of underground water due to illegal dig-ging of wells, making permanent access to water easy. Detailed plan for irrigation and agricultural justification, as well as the monitoring of the numbers of drilled wells every day, can be effective in improving these conditions. The obtained results, based on the software used in this study, on the relationship between variables, total hard-ness and TDSs in groundwater, can be used as a guide in order to harvest this water with less salt or stop the har-vest of water in areas that are very salty. Therefore, further extensive studies are needed in order to determine other qualitative parameters of water.
Acknowledgements
The authors gratefully acknowledge the assistance and cooperation of the research committee of the Mazan-daran University of Medical Science. Also, the efforts of Abdolazim Alinejad and Rouhollah Khodadadi are ap-preciated. This research was the subject of MSc thesis of Farzad Kazemi as a student of Mazandaran University of Medical Sciences.
Ethical issues
There were no ethical issues for writing of this article.
Competing interests
We affirm that this article is the original work of the au-thors and have no conflict of interest to declare.
Authors’ contributions
behalf of the co-authors, the corresponding author bears full responsibility for this submission.
References
1. Samaei MR, Ebrahimy MH, Ehrampoosh MH, Talebi P, Khalili MH, Morovati R. A survey on chemical quality of Yazd drinking water. Toloo-e-Behdasht 2007; 6(2): 51-7. ]In Persian].
2. Shariat Panahi M. Principals of Quality and Water and Wastes’ Purification. 5th ed. Tehran: Tehran University Publication; 1992. ]In Persian].
3. Rahmani A, Shokohi R. Investigating the Hamadan underground water quality - spring. The 10th Hamadan Health Environment National Congress; 2007; 67-77. ]In Persian].
4. Imandel K. Physical and Chemical Qualities of Drinking Water. Standard Handbook, number 52. 5th ed. Iran: Industrial Researches and Standard Institution; 1997. ]In Persian].
5. NasehiNia H, Naghizadeh A, Ravankhah M. Determining of corrosion or sedimentation of drinking water in Dameghan city with corrision indexes. The 4th conference & exhibition on environmental engineering; Tehran University; 2010. 6. Mazloomi S, Babaie AA, Fazlzadeh Davil M, Abouee
E, Badiee Nejad A, Hajpoor Sough KH. Corrosion and Scaling Potentiality of Shiraz Drinking Water. Journal of Toloo-e-behdasht 2008; 7(1-2): 64-71. ]In Persian].
7. Mokhtari S, Aliqadri M, Hazrati S, Sadeghi H, Gharari N, Ghorbani L. Evaluation of corrosion and precipitation potential in Ardebil drinking water distribution system by using langelier & ryznar indexes. J Health Ardabil Univ Med Sci 2010; 1(1): 14-23. ]In Persian].
8. Avazpour M, Gholami M, Aeli R. Evaluation of corrosion and sedimentation potential of drinking water in Ilam city. Eleventh National Conference on Environmental Health; Zahedan University; 2007. p. 10. ]In Persian].
9. Ahmadpour H, Khaledian M, Ashrafzadeh A, Rezaei M. Spatial and Temporal Zoning of Groundwater Electrical Conductivity and Total Dissolved Solids in Guilan Plain. Journal of Water Research in Agricultural 2014; 28(3): 667-76.
10. Parast N, Behnia M, Sodmand M, Bahrami H. Survey
the water hardness Bojnoord in 1390. Proceedings of the First National Conference on applied research in public health and sustainable development; 2012. 11. Ehsani HR, Javid AH, Hasani AH, Shariat SM.
Investigating the process of Nitrat’s and total solids changes in Hamadan underground drinking water in winter by use of geographical information system (GIS). Tenth National Congress of Environment Health; Hamadan; 2007. ]In Persian].
12. Taghizadeh Mehrjerdi RA, Mahmoudi SH, Khazaei S, Heidari A. Spatial variability of groundwater salinity using geostatistical study (case study: Rafsanjan). Second Symposium of Environmental Engineering; Tehran University; 2008. ]In Persian].
13. Zahedifar M, Moosavi AA, Rajabi M. Zoning the groundwater chemical quality attributes of Fasa plain using geostatistical approaches. ournal OF Water and Soil (Agricultural Sciences and Technology) 2013; 27(4): 812-2. ]In Persian].
14. Gholami V, Yousefi Z, Zabardast Rostami H. Modeling of ground water salinity on the Caspian southern coasts. Water Resour Manag 2010; 24(7): 1415-24.
15. Ghaderpoori M, Dehghani MH, Fazlzadeh M , Zarei A. Survey of microbial quality of drinking water in rural areas of Saqqez, Iran. American-Eurasian J Agric & Environ Sci 2009; 5(5): 627-32.
16. Yousefi Z, Naeej O. Study on nitrate value in rural area in Amol city. Journal of Mazandaran University of Medical Sciences 2007; 17(61): 161-5. ]In Persian]. 17. Dianati R, Alam Ghalilo M, Barafrashteh Pour M.
Study of temporal and spatial changes in electrical conductivity and hardness of water resources underground city of Ghaem Shahr-Joibar using geographic information system (GIS). 6th National Conference on Environmental Health; Tabriz University of Medical Sciences; 2013.
18. Dianati RA, Falah F. Change of electrical conductivity and hardness of groundwater in coastal areas of the city of Sari. 12th National Conference of Environmental Health; 2009.