Validation of a model for operation
optimization of a regional water supply system
Claudio Arena
1, Marcella Cannarozzo
1, Antonino Fortunato
1, Alessio
Lombardo
1, Ignazio Scolaro
1and Mario Rosario Mazzola
11Dipartimento di Ingegneria Civile, Ambientale, Aerospaziale e dei Materiali (DICAM)
dell’Università degli Studi di Palermo, Viale Delle Scienze, Ed.8, 90128, Palermo, Italy. Corresponding author: [email protected]
Abstract
Sustainable use of water resources requires a modern approach for complex water systems management based on system’s modeling, as unsung operation alternatives may only be devised and tested through a model. The now available IT computing tools enable setting the traditional modelling methodologies for planning and operation of such systems in a new framework. The present work deals with the development of decision support models for optimizing the operation of complex water supply systems with multiple uses and focuses on the validation of the optimization model of the regional water supply systems managed by an Italian water utility. The software used is Aquator, a state-of-the-art commercial tool for generic water resources system simulation and operational optimization. The paper shows and comments the results of the validation of the model and uses them to draw some general principles for the validation of such kind of models: in fact, operational optimization models are conceived for the enhancement of systems management and performance. Consequently, while on the one side model output is expected to reflect the actual state of the system, on the other it can point out significant management enhancements.
Keywords: Regional water supply systems, operational optimization, model validation.
1
Introduction
Regional water supply systems are characterized by the presence of important infrastructure for conveying water volumes from one area to another of the served territory. The areas at stakes are typically of several thousands of square kilometres and the number of people supplied is in the order of millions. This kind of schemes tends to become more and more widespread and interconnected, due to
Engineering
EPiC Series in Engineering
Volume 3, 2018, Pages 79–86
HIC 2018. 13th International Conference on Hydroinformatics
increasing conurbation, especially in regions where water resources are placed far away from demand centres.
One of the relevant issues related to such systems is finding the most appropriate, least-cost operation rule in their current configuration, or in understanding the best investment alternatives to improve service performances.
Simulation models supported by state-of-the-art software packages [1] are now available to screen the effect of different operation rules on the management of this type of systems. An updated survey of these models is available in [2]. The emphasis in such models is placed on the water balance on a regional scale rather than on the flow and pressure regimes deriving from the application of certain rules, as in hydraulic models. Another relevant difference between the two model types lies in the time scale: unlikely hydraulic models, in most applications regional supply models are concerned with the variability, seasonal or annual, of water resources availability. Compared to hydraulic models, they require less data for calibration and this can prove advantageous in large and complex systems.
In general, calibration of these models is a lengthy procedure and many runs are necessary before obtaining convincing results. The present work shows the results of the validation of the operational optimization model of the regional bulk supply system managed by an Italian water utility [3], developed using Aquator, a state-of-the art software for water resources system simulation [4]. Validation is an essential step in the implementation of any type of model. In this specific case, as with all optimization models, the model is meant to improve system performances: results are hence expected to reflect these improvements compared to standard operation. Understanding, motivating and documenting the feasibility of the proposed enhancements hence becomes a key step of the validation process.
2
Material and Methods
2.1
Software description
Aquator is an application for the simulation of complex, multi-purpose water systems, which allows modelling and interfacing natural river networks and water supply networks, with an accurate reproduction of their topology. Aquator works on a daily time step, turning water resources availability into supply to the demand centres, either on the sole basis of its linear optimization algorithm (Aqua-Solver) and other predefined rules, that seek to minimize cost in the current time step while preserving the state of the resources, or being also guided by user-defined rules.
The software adopts an arcs (pipelines) and nodes (junctions, plants and sources) paradigm.
Aquator models do not attempt to reproduce the full hydraulic behaviour of the systems, as they rather focus on water mass balance: unlikely hydraulic models, capacity constraints on pipelines and flow direction are inputs to the model.
During each day of a model run, water is transferred according to the input data, the rules built into each component, and the topology of the model.
The software also incorporates a Microsoft® Visual Basic for Applications® (VBA) module which can be used to implement user-defined algorithms.
Aquator assesses water transfers on a daily basis; however, sub-daily calculations may be included in some components, for instance in order to minimize pumping costs by taking into account different electricity tariffs during the day [5].
The global optimiser built into Aquator, Aqua-Solver, provides a mathematically optimal solution. At the heart of this algorithm there is a linear programming algorithm with the advantage of a numerically stable known solution technique, which can be completed in a finite number of steps.
Validation of a Model for Operation Optimization of a Regional Water Supply ... C. Arena et al.
2.2
Model description
Overall, the system features five main reservoirs, with a total active capacity of around 900 Mm3
and all of them are multi-purpose, supplying water also for irrigation and industrial districts.
Another important water resource for both municipal supply and irrigation is the regional aquifer from which the utility draws through about 200 wells located throughout the region.
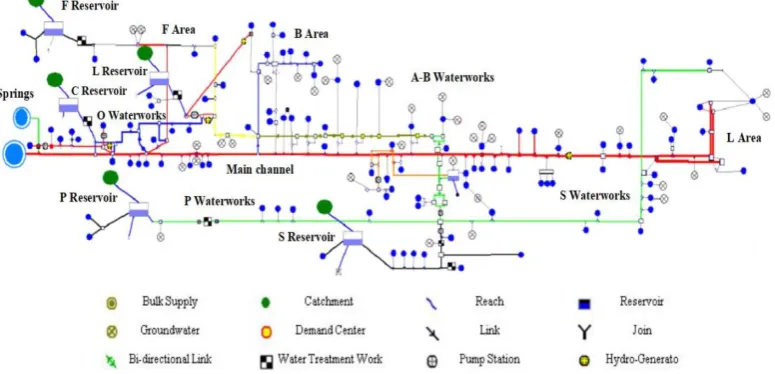
The regional water supply system consists of five main aqueduct schemes, indicated as Main channel, O Waterworks, P Waterworks, A-B Waterworks and S Waterworks in Figure 1.
The model used in this work, named Scheme 0 (Figure 1), is an evolution, refinement and up-date of a model developed during a previous study [5]. It features more than 700 elements, of which around 100 are demand centers and 350 are links (pipelines), including 6 reservoirs, 2 spring elements, 4 hydropower plants, 6 pumping stations, 6 water treatment plants, as well as 25 groundwater elements.
Water demands at the demand centers are set equal to the observed demands (volumes supplied) in 2016, and all the resources state variables, namely maximum flow rates from wells and springs, initial reservoir levels, spring yields and reservoir inflows, are set equal to their observed values in 2016. Inflows into reservoirs were assessed (outside the model) through daily mass balance among observed storage volumes, water withdrawals for municipal supply and irrigation (the latter estimated) and water losses (evaporation, as no spill was observed during 2016).
Furthermore, as actually occurred in 2016, in Scheme 0, C reservoir (Figure 1) entered operation in May 12.
Figure 1. Schematic of the Aquator model, Scheme 0, developed and compared with the actual management in 2016.
3
Results and discussion
Optimization outputs from the Aquator environment have been compared with data from the actual operation performed by the utility during 2016 (Table 1, Table 2, Table 3 and Figure 2).
Figure 3 contains the comparison of reservoir storage between actual and simulated operation along year 2016.
Validation of a Model for Operation Optimization of a Regional Water Supply ... C. Arena et al.
The values of Table 1 show a good general agreement between model’s results and real-world operation, the main differences being ascribable to the operational optimization enabled by the model itself. In particular, the model tends to reduce the use of more expensive sources, such as wells and L Reservoir (whose water is first treated, then pumped), in favor of a greater use of less expensive sources, like P Reservoir, whose water is only treated and may flow by gravity up to L Area, on the far right hand-side of Figure 1. A greater use of surface sources that must be treated (reservoirs) and a lower use of underground sources can also be observed from Table 1.
Actual 2016 management
Scheme 0 Differences
Volumes entering the system [Mm3]
Wells 72.1 63.7 - 8.4 (-11.7%)
Springs 150.8 150.6 -0.2 (-0.1%)
F Reservoir 51.5 53.1 1.6 (3.0%)
C Reservoir 9.0 8.7 -0.3 (-3.4%)
L Reservoir 35.4 28.8 -6.6 (-18.6%)
P Reservoir 104.8 127.2 22.4 (21.4%)
S Reservoir 109.6 107.8 -1.9 (-1.7%)
Total volume entering the system 533.1 539.8 6.6 (1.2%)
Municipal supply [Mm3]
473.6 470.0 -3.6 (-0.8%)
Total leakages [Mm3]
59.6 69.8 10.2 (17.2%)
Balance closing error
0.000 0.000
Table 1. Comparison between Scheme 0 and the actual management in 2016 – System water balance.
Actual 2016
management Scheme 0 Differences
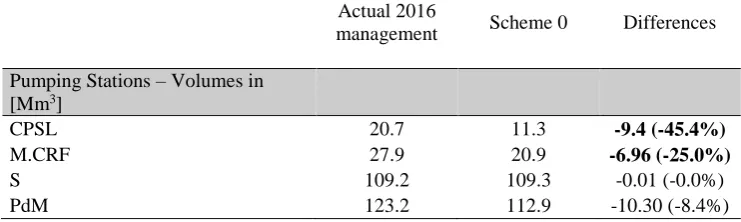
Pumping Stations – Volumes in [Mm3]
CPSL 20.7 11.3 -9.4 (-45.4%)
M.CRF 27.9 20.9 -6.96 (-25.0%)
S 109.2 109.3 -0.01 (-0.0%)
PdM 123.2 112.9 -10.30 (-8.4%)
Table 2. Comparison between Scheme 0 and the actual management in 2016 – Pumped volumes.
Overall, the model suggests a novel operation mode by redesigning the way the water is supplied to the whole system: it strengthens allocation from P reservoir to the L Area, the one presently relying more on wells, so that abstraction from wells is reduced. This is a relevant model output, since a critical aspect of the regional water system is exactly the supply of L area which is based to a good extent on withdrawals from the regional aquifer, whose waters are deteriorated due to overexploitation. In addition, the model suggests substituting resources from L reservoir with water from the Main channel in order to supply the demand centers of B Area. A further substitution is then carried out
Validation of a Model for Operation Optimization of a Regional Water Supply ... C. Arena et al.
between water from the main channel and water from P reservoir, as far as the supply of L Area is concerned, as shown by the lower volumes pumped by PdM pumping station (Table 2 and Figure 2).
Besides these suggestions on new operation alternatives for the system, however, validation must also check consistency of water supplied to demand centers and water losses. Concerning water supply, the difference (0.8%) between actual and simulated values is due to numerical features of the software that tends to allow small deficits in some demand centers although there are no significant bottlenecks in the system and resources are plentiful, at least in year 2016, as indicated by the pattern of reservoir levels shown in Figure 3.
On the other hand, water losses are the system’s “physical” feature producing the most significant departures from real-world operation.
The model yields losses 17.2% greater than the observed ones, which also explains higher volumes withdrawn from the supply sources (+6.62 Mm3).
Actual 2016 management
(M€)
Scheme 0 (M€)
Differences (M€)
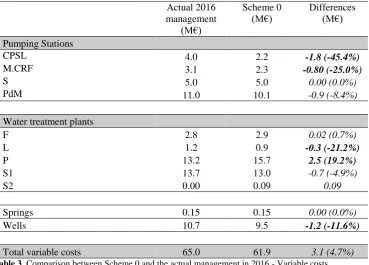
Pumping Stations
CPSL 4.0 2.2 -1.8 (-45.4%)
M.CRF 3.1 2.3 -0.80 (-25.0%)
S 5.0 5.0 0.00 (0.0%)
PdM 11.0 10.1 -0.9 (-8.4%)
Water treatment plants
F 2.8 2.9 0.02 (0.7%)
L 1.2 0.9 -0.3 (-21.2%)
P 13.2 15.7 2.5 (19.2%)
S1 13.7 13.0 -0.7 (-4.9%)
S2 0.00 0.09 0.09
Springs 0.15 0.15 0.00 (0.0%)
Wells 10.7 9.5 -1.2 (-11.6%)
Total variable costs 65.0 61.9 3.1 (4.7%)
Table 3. Comparison between Scheme 0 and the actual management in 2016 - Variable costs.
In the model, water losses are in fact accounted for in two different ways: in water treatment plants and along the main channel water losses are given as a percentage of the flow in the component, while in all of the other aqueducts losses are given as a fixed value. Hence, simulated water losses are believed to exceed observed ones, at least in part, for two reasons: simulated flows in the main channel are greater than actual ones, at least in some part of it - namely in the first part, where the flow increases compared to the actual management in 2016 due the lower volumes pumped by CPSL pumping station (Figure 2 and Table 2) - and water treatment losses in the plant downstream P reservoir also increase due to the more intense exploitation of this reservoir (Figure 2 and Table 1).
Finally, validation should also look at simulated reservoir levels. Figure 3 shows a good agreement between the actual trends of the storage levels observed in 2016 and those provided by the model, the
Validation of a Model for Operation Optimization of a Regional Water Supply ... C. Arena et al.
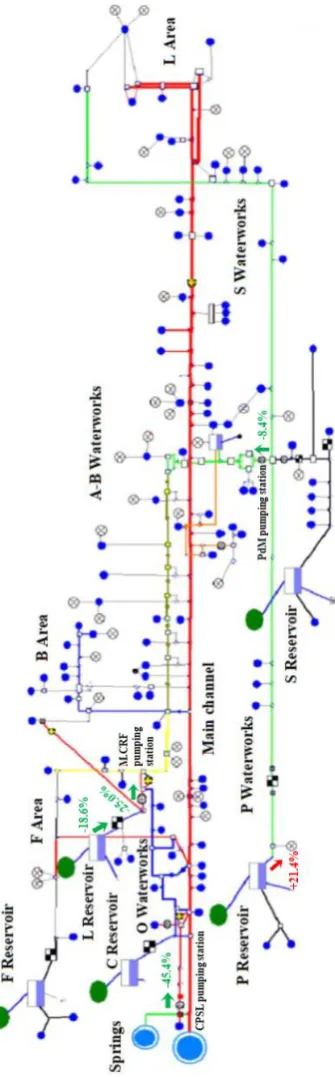
Figure 2. Location of main positive (in red) and negative (in green) % differences between Scheme 0 outputs and the actual 2016 operation with regard to the water volumes withdrawn from reservoir and volumes pumped. Validation of a Model for Operation Optimization of a Regional Water Supply ... C. Arena et al.
main differences being found between observed and simulated storage levels of P reservoir on the grounds explained above.
The difference observed, during the first months of the year, between simulated and observed water volumes stored in C reservoir is due to the initial level assumed in the simulation which was set equal to the historical average instead of the observed value ad the beginning of 2016, as for the other reservoirs, since this latter value was missing.
Finally, it should also be remarked that the management scheme proposed by the model, although abstracting more water from the supply sources and overestimating losses, is able to reduce variable operation costs by 4.7% (Table 3), thanks to a more rational use of sources and plants.
Figure 3. Comparison of actually stored volumes (in Mm3) in the reservoirs during year 2016 and simulated
ones (dotted line).
4
Conclusions
A model of the complex regional water supply systems managed by an Italian water utility, supplying more than 4 million inhabitants, has been developed in Aquator environment, a state-of-the art software for water resources system simulation and optimization, with the aim of selecting the best least-cost operational policies.
The model, built together with the water utility technical staff, is an evolution, refinement and up-date of a model developed during a previous study and features more than 700 elements, of which 100 demand centers and 350 links.
Missing data
Validation of a Model for Operation Optimization of a Regional Water Supply ... C. Arena et al.
Water demands were set equal to the actual demands in 2016, and all the resources state variables (maximum flow rates from wells and springs, starting reservoir levels and reservoir inflows) were set equal to their actual values in 2016.
The comparison between the results of the model and operational data from year 2016 shows that the model is capable of describing adequately the system and its real-world operation, while providing useful suggestions for economic optimization.
In particular, the model redesigns the way the water is supplied to the demand centers, reducing variable operation costs by 3.1 M€, corresponding to 4.7% of the overall variable costs: it strengthens allocation from P reservoir to the L Area, so that abstraction from wells is reduced. The latter is a major model output, since the waters of the regional aquifer are deteriorated due to overexploitation.
In addition, to supply the demand centers of B Area, resources from L reservoir are substituted with water from the Main channel, which are partially diverted from the supply of L Area.
The paper has provided an example of the validation procedure for a similar model, highlighting the elements that should be considered in the validation process.
References
[1] Oxford Scientific Software Ltd.. A Guide to Aquator. “Aquator. Water Resources Modelling Software by Oxford Scientific Software”. http://www.oxscisoft.com/index.aspx. Jan. 2015.
[2] D. Rani. M. Moreira. A survey and potential application in reservoir systems operation. Water Resources. Management.. 24 (2010). 1107-1138.
[3] C. Arena, M. Cannarozzo, M.R. Mazzola. Screening investments to reduce the risk of hydrologic failures in the headwork system supplying Apulia (Italy) – Role of Economic Evaluation and Operation Hydrology. Water Resources Management 28(5). 2014. 1251-1275.
[4] C. Arena, M. Cannarozzo, A. Fortunato, I. Scolaro, M.R. Mazzola, Sensitivity of Regional Water Supply Systems Models to the Level of Skeletonization – A Case Study from Apulia, Italy. Procedia Engineering. 119 (2015). 535-544.
[5] C. Arena, M. Cannarozzo, A. Fortunato, A. Lombardo, I. Scolaro, M.R. Mazzola, A hourly time step optimization model of a regional water supply system in Aquator environment - A case study. 1st International WDSA / CCWI 2018 Joint Conference, Kingston, Ontario, Canada – July 23-25, 2018.
Validation of a Model for Operation Optimization of a Regional Water Supply ... C. Arena et al.