*
Corresponding author: [email protected]
53
CFD Simulation of Segregation Behavior of a Ternary Mixture in a
Bubbling Fluidized Bed: Effect of Solid Wall Boundary Condition
M. Rasteh 1*, F. Farhadi 2
1
Department of Chemical Engineering, Hamedan University of Technology, P.O. Box: 65155-579, Hamedan, Iran
2
Department of Chemical and Petroleum Engineering, Sharif University of Technology, P.O. Box: 11155, Tehran, Iran
ARTICLE INFO ABSTRACT
Article history: Received: 2018-04-07
Accepted: 2018-07-01
The effect of the solid–wall boundary condition on the segregation behavior of a sand ternary mixture differing in size, yet with the same proportion, has been investigated in a gas–solid bubbling fluidized bed. A multi-fluid computational fluid dynamics model incorporating the kinetic theory of granular flow has been used. The mass fraction profiles of different-sized particles along the bed height have been experimentally measured by 'freeze–sieving' method. The simulation results of mass fraction distribution and segregation index have been compared against our experimental data in order to evaluate solid– wall boundary conditions in terms of specularity and particle-wall restitution coefficients. The analysis indicates that the specularity coefficients in the range of 0.5 to 0.9 lead to the satisfactory results,
and the best agreement is obtained for ϕ=0.9, which corresponds to partial–slip wall boundary condition, while the particle–wall restitution coefficient has only negligible effect on the results. In addition, maximum segregation index occurs at specularity coefficient of 0.9 at which the segregation pattern may be affected by simultaneous mechanisms of particles circulation and bubbles rising. The effects of superficial gas velocity on the segregation behavior in bubbling regime have also been studied, and a significant reduction in segregation index has been observed with increasing gas velocity from 1.1 Umf to 1.3 Umf.
Keywords: Ternary Mixture, Segregation,
Boundary Condition, Bubbling Fuidized Bed, CFD Simulation
1.Introduction
fluidized beds are widely used in the process industry for their performance of effective mixing, high rate of heat and mass transfer, and capability of continuous operation [1]. In most cases, the behaviors of fluidized beds are studied, assuming that particles are
monodispersed, characterized by the Sauter mean diameter. However, polydispersed particles with broad size distributions are present in many applications of fluidized beds such as drug manufacturing, polymerization
reactors, and coal combustors [2].
54 Iranian Journal of Chemical Engineering, Vol. 15, No. 3 (Summer 2018)
hydrodynamic behaviors compared with monodispersed ones because of mixing and segregation effects [3].
In situations where particles of different size ranges are moving relative to each other, a dynamic equilibrium is developed between the competing mixing and segregation mechanisms [4]. This equilibrium leads to a segregation pattern so that large particles can tend to sink at the bottom of the bed, named as 'jetsam', while the small particles tend to float at the top of the bed, called 'flotsam' [5]. The mechanism of segregation mainly depends on superficial gas velocity that can result from a major difference in drag and gravity force between solid particles [6], granular temperature and pressure of particles [7], gas–phase turbulence, particle collisions [8], and bubbles’ motion in the bed [9]. Some research results have shown that the lower gas velocity increases segregation, while the higher gas velocity promotes the mixing process [10]. The axial or horizontal segregation pattern can be influenced by key parameters, such as particle size distribution (PSD), particle density distribution, particles shape, particles loading, fluidization regime, gas distributer type, and so on [11].
The popular numerical methods for
investigating the different aspects of particle segregation in fluidized beds are based on Eulerian–Lagrangian (discrete element model, DEM) and Eulerian–Eulerian (multi-fluid model, MFM) models via computational fluid dynamics (CFD) simulations [10]. It is well known that the performance of DEM and MFM simulation depends on the proper description of all possible intra– and inter– phase interactions, such as collision and frictional interactions between particles, gas– solid interactions, and interactions between particles and wall [12,13].
The interaction between wall and particles explained as in solid-wall boundary condition is one of the most important parameters that affects the accurate prediction of MFM in fluidized beds [14,15]. The general type of boundary condition commonly used in CFD simulation of fluidization processes was derived by Johnson and Jackson [16] who introduced the specularity coefficient (ϕ) coefficient to describe the wall boundary
conditions. The specularity coefficient
determines the shear condition at the walls with the value between 0 for perfectly specular collision (free-slip) and 1 for perfectly diffuse collision (no-slip). The particle–wall restitution coefficient (ew) is
another parameter that affects the solid wall
boundary condition. It specifies the
dissipation of the solid kinetic energy due to particle-wall collisions. A value of ew close to
unity denotes very low dissipation of kinetic energy.
Although many authors have investigated the impact of solid-wall boundary condition on the hydrodynamics of monodispersed particles in fluidized beds [17,18], few have reported on polydispers systems, which have mainly been limited to binary mixtures. Focusing on the solid wall boundary condition, Zhong et al. [13] studied the
mixing/segregation behavior of binary
Iranian Journal of Chemical Engineering, Vol. 15, No. 3 (Summer 2018) 55
impact on the segregation rate of particles with different sizes and densities at superficial gas velocities close to minimum fluidization velocity. Geng et al. [20] investigated the effect of solid wall boundary conditions on the MFM results of a pseudo-2D bubbling fluidized bed and reported the importance of the expression under granular temperature and also the specularity coefficient for predicting the mixing behavior.
Although partial-slip [2,4] or no–slip [21,22] wall boundary conditions have been used for the numerical simulation of binary particle mixtures, the effect of wall boundary condition on mixing/segregation of other polydispersed systems, such as ternary particles, is not fully understood. The literature survey shows the lack of available studies on the evaluation of the effects of solid wall boundary condition on mixing/segregation of ternary mixtures in fluidized beds.
The main objective of this paper is to identify and outline the role of solid wall boundary condition as well as superficial gas velocity in mixing/segregation behavior of ternary mixture of sand particles differing in size, yet similar in density in a cylindrical fluidized bed. To this purpose, an Eulerian– Eulerian multi-fluid model incorporating the kinetic theory of granular flow is formulated to simulate the mixing/segregation phenomena. The influence of solid wall boundary condition in terms of specularity coefficient as well as particle–wall restitution coefficient and also the effect of superficial gas velocity on particle segregation behavior, at bubbling regime, is evaluated. The simulation results of axial segregation profile are compared with the experimental data obtained by 'freeze-sieving' method.
2. Experimental setup and procedures 2.1. Apparatus
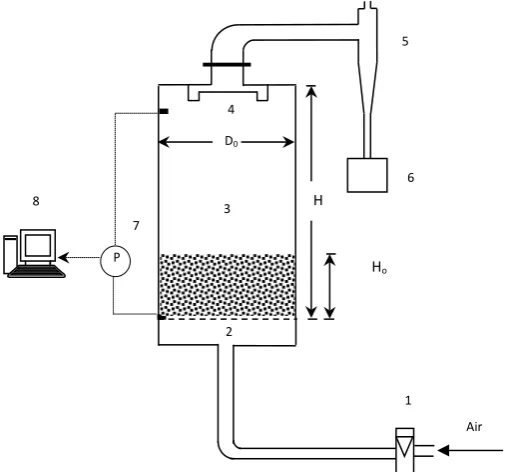
A schematic diagram of the experimental setup is illustrated in Fig. 1. The experiments were carried out in a cylindrical fluidized bed made of Plexiglas. The characteristics of the main apparatus and technical specification of the experiments are given in Table 1. A plate with standard mesh #170 is considered as the bed material support as well as distributor at the bottom. A compressor (HSS make, model: MICAS-PH-180-1055) with 1000 Lit/min capacity was used to provide air as the fluidizing gas. The regulated air under ambient condition passed through a silica gel tower to dry before being sent through the bed. Two rotameters (accuracy ± 2 % FSD), one for the lower range (0-5 m3/h) and the other for the higher range (5-20 m3 /h), monitored the desired airflow rate. The bed pressure drops were recorded using a low-differential pressure transmitter (Kangyu, KYB14A, China). There are two pressure ports located on the bed inlet (just above the distributor) and on the exit section of the bed. The measured pressure drop was converted into voltage signals by a multi-channel pressure signal transmitter and sent to a computer through an A/D converter. Pressure time series were logged at fixed time intervals (50 ms). The particle size distribution (PSD) along the bed height was determined using a sieving shaker machine (AS200 control, Retsch GmbH, Germany) with sieves ranging
from 1400 to 63 µm.
2.2. Procedure
A ternary mixture of sand particles composed
56 Iranian Journal of Chemical Engineering, Vol. 15, No. 3 (Summer 2018)
were between two successive standard sieves;
138 µm: between 125-150 µm, 328 µm:
between 300-355 µm, and 550 µm: between
500-600 µm. The physical properties of
fluidizing gas and ternary mixture are given in Table 2. In order to determine minimum fluidization velocity (Umf), the investigation
of characteristic curves (∆P-U0) as a classical
method for studying hydrodynamics of fluidization process was employed. In this method, the bed was filled by the pre-determined amount of mixture in order to obtain the desired initial bed height (H0=8
cm). The airflow rate increased step by step, held at each step for 60 s; then, the bed pressure drop was averaged over the last 15 seconds. This process continued until a full fluidization condition, corresponding to a constant pressure drop with further increasing of gas velocity, was attained. The plot of bed
pressure drop (∆P) versus superficial gas
velocity (U0) reveals some hydrodynamic
characteristics of fluidized beds such as fluidization regimes and minimum fluidization velocity as described in literature [23].
Figure 1. Experimental apparatus: 1) Rotameter, 2) Distributor plate, 3) Bed body, 4) Filter, 5) Cyclone, 6) Receiver, 7) Differential pressure transmitters, and 8) Computer.
Table 1
The apparatus specification and experimental conditions.
Bed diameter (D0) 18 cm
Bed height (H) 30 cm
Particles height in bed (H0) 8 cm
Distributor plate US standard mesh #170
Compressor capacity 1000 Lit/min
Pressure (P) 1 atm
Range of gas velocity (U0) 0.0605- 0.0715 m/s P
7
Ho
D0
5
2 3
4
6
1
Air H
Iranian Journal of Chemical Engineering, Vol. 15, No. 3 (Summer 2018) 57 Table 2
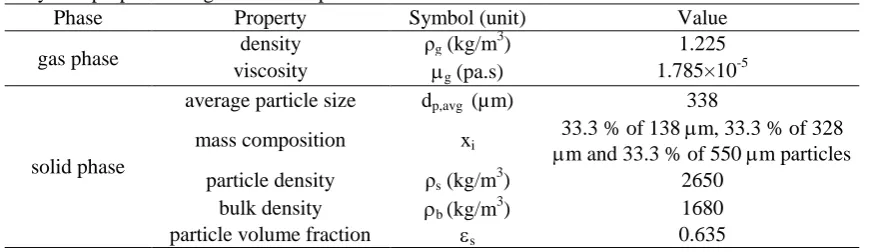
Physical properties of gas and solid phases.
Phase Property Symbol (unit) Value
gas phase density ρg (kg/m
3
) 1.225
viscosity µg (pa.s) 1.785×10 -5
solid phase
average particle size dp,avg (µm) 338
mass composition xi
33.3 % of 138 µm, 33.3 % of 328 µm and 33.3 % of 550 µm particles particle density ρs (kg/m
3
) 2650
bulk density ρb (kg/m3) 1680
particle volume fraction εs 0.635
To carry out axial segregation experiments, the bed was fluidized at a relatively high superficial gas velocity (U0=2.5 Umf=0.1375
m/s) for time duration of 10 min to ensure perfect mixing and reproducibility of initial condition for desired superficial gas velocities. After the end of mixing time, the air supply was shut off; then, the bed was fluidized at the desired superficial gas velocities (U0= 0.0605, 0.066 and 0.0715 m/s
corresponding to1.1 Umf, 1.2 Umf and 1.3 Umf,
respectively) for adequate time (30 min) to ensure reaching steady-state condition. After the segregation time, the air flow rate was abruptly shut off to freeze the bed. The frozen bed was then divided into 8 sections along the bed height (1 cm apart), and the particles were vacuumed out of the each section for sieve analysis and determining powder mass composition along the axial direction, as described in [3,24].
3. CFD model description
A two-dimensional (2D) CFD model based on Eulerian-Eulerian approach (MFM) was developed to simulate the behaviors of the fluidized bed containing the ternary mixture described in the experimental section. In the MFM, the phases act as interpenetrating continua, and the mass and momentum conservation equations in the form of generalized Navier-Stokes equations are
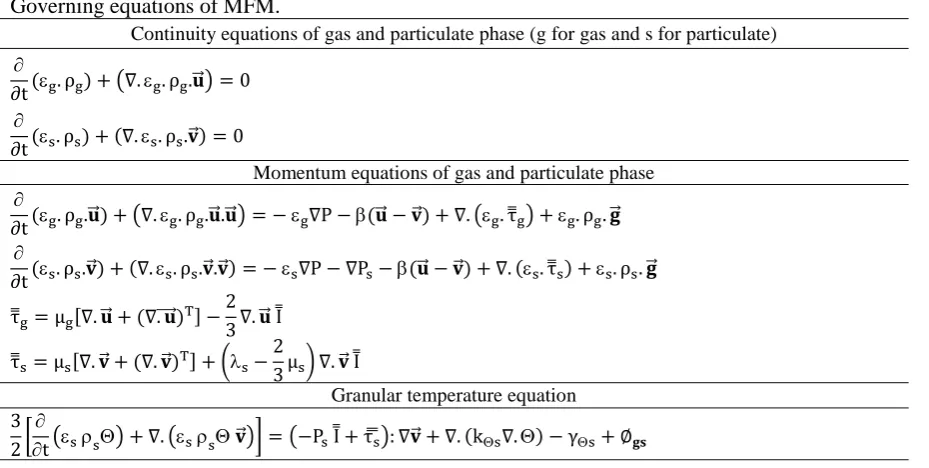
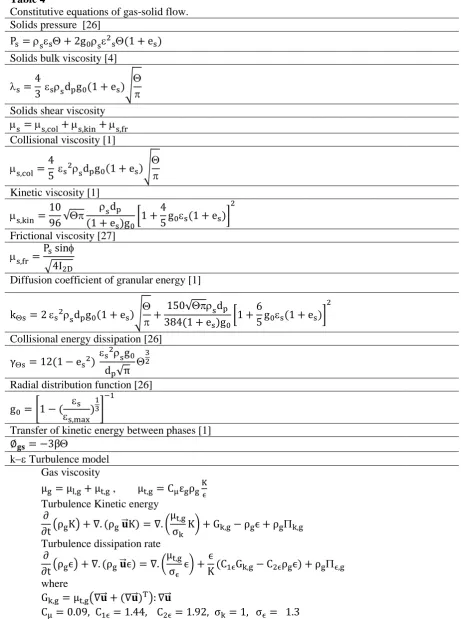
solved for each phase. Additional source terms are added to the conservation equations to account for the interactions between the phases. The granular temperature (kinetic energy of particulate phase) and other particulate phase properties are evaluated using the kinetic theory of granular flow (KTGF), which makes an analogy between the particulate phases and the kinetic theory of gases. The set of governing equations of MFM and constitutive equations of gas–solid flow based on KTGF are summarized in Tables 3 and 4, respectively. More details about the governing equations can be found in the literature [14,25].
58 Iranian Journal of Chemical Engineering, Vol. 15, No. 3 (Summer 2018)
over the last 10s. The summarized simulation parameters are given in Table 5.
A no-slip boundary condition for the gas phase and various specularity coefficients (0, 0.2, 0.5, 0.9, 0.95, and 1) and different particle-wall restitution coefficients (0.8, 0.9, and 0.95) for particulate phases were used at the wall to study the effects of solid boundary condition on simulation results. The gas entered only in axial direction at the inlet of the bed, (Dirichlet boundary condition), and superficial gas velocity of U0= 1.1 Umf, 1.2
Umf, and 1.3 Umf were set as the inlet gas
velocity. An outflow boundary condition at the outlet of the bed was used, meaning that the gas velocity gradient was set to zero along
the axial direction (𝜕𝜕𝑢𝑢𝑦𝑦
𝜕𝜕𝜕𝜕 = 0), and atmospheric
condition for pressure was also considered. The computational domain was discretized with 13500 cells (2 mm×2 mm). The size of the cells is about 8 times the average particle diameter, which provides enough high resolution for the accurate discretization of the solid phase [18,28].
4. Results and discussion
4.1.Minimum fluidization velocity (Umf)
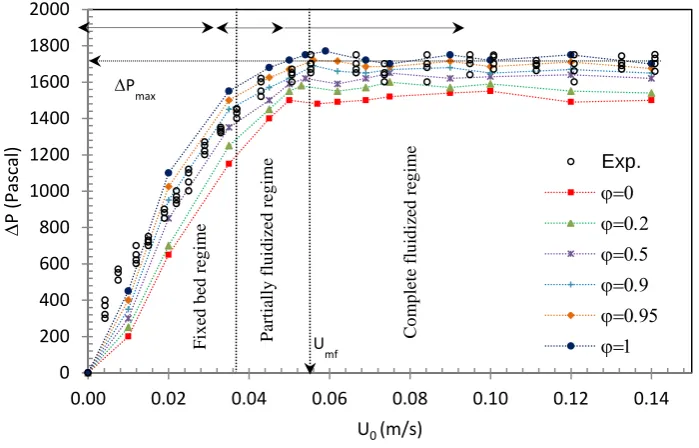
Fig. 2 shows the experimental data and the simulation results of bed pressure drop versus superficial gas velocity for different values of
specularity coefficient (ϕ). The ΔP–Uo
diagram can be subdivided into three main regions corresponding to the different fluidization regimes: (I) fixed bed regime; (II) partially fluidized regime; (III) complete fluidized regime [23]. In the fixed bed region, there is a quasi-linear relationship between gas velocity and bed pressure drop, which shows considerable viscous effects in gas– solid interaction [29]. In the partially fluidized region, the smaller particles begin to fluidize, the viscous effects reduce, and the change in pressure drop with gas velocity is elbow like. In the complete fluidized region, the fluidization of all particles occurs, and the total bed pressure drop, which remains almost constant, is balanced with the particles’ weight and the particles-wall friction. The gas velocity corresponding to transition from partially fluidized regime to complete fluidized regime is defined as the minimum fluidization velocity (Umf) [23,29].
Table 3
Governing equations of MFM.
Continuity equations of gas and particulate phase (g for gas and s for particulate) ∂
∂t (εg.ρg) +�∇.εg.ρg.𝐮𝐮��⃗�= 0
∂
∂t (εs.ρs) + (∇.εs.ρs.𝐯𝐯�⃗) = 0
Momentum equations of gas and particulate phase ∂
∂t (εg.ρg.𝐮𝐮��⃗) +�∇.εg.ρg.𝐮𝐮��⃗.𝐮𝐮��⃗�=−εg∇P−β(𝐮𝐮��⃗ − 𝐯𝐯�⃗) +∇.�εg.τ�g�+εg.ρg.𝐠𝐠�⃗
∂
∂t (εs.ρs.𝐯𝐯�⃗) + (∇.εs.ρs.𝐯𝐯�⃗.𝐯𝐯�⃗) =−εs∇P− ∇Ps−β(𝐮𝐮��⃗ − 𝐯𝐯�⃗) +∇. (εs.τ�s) +εs.ρs.𝐠𝐠�⃗ τ�g=µg[∇.𝐮𝐮��⃗+ (∇����⃗.𝐮𝐮)T]−23∇.𝐮𝐮��⃗ I̿
τ�s=µs[∇.𝐯𝐯�⃗+ (∇.𝐯𝐯�⃗)T] +�λs−23µs� ∇.𝐯𝐯�⃗ I̿
Granular temperature equation
3 2�
∂
Iranian Journal of Chemical Engineering, Vol. 15, No. 3 (Summer 2018) 59 Table 4
Constitutive equations of gas-solid flow. Solids pressure [26]
Ps=ρsεsΘ+ 2g0ρsε2sΘ(1 + es)
Solids bulk viscosity [4]
λs=4
3 εsρsdpg0(1 + es)�
Θ π
Solids shear viscosity
µs=µs,col+µs,kin+µs,fr
Collisional viscosity [1]
µs,col =4
5 εs2ρsdpg0(1 + es)�
Θ π
Kinetic viscosity [1]
µs,kin=10
96√Θπ
ρsdp
(1 + es)g0�1 +
4
5 g0εs(1 + es)�
2
Frictional viscosity [27]
µs,fr =Ps sinφ
�4I2D
Diffusion coefficient of granular energy [1]
kΘs= 2 εs2ρsdpg0(1 + es)�
Θ π+
150√Θπρsdp
384(1 + es)g0�1 +
6
5 g0εs(1 + es)�
2
Collisional energy dissipation [26]
γΘs= 12(1−es2)
εs2ρ sg0
dp√π
Θ32
Radial distribution function [26]
g0 =�1−(
εs εs,max)
1 3�
−1
Transfer of kinetic energy between phases [1]
∅𝐠𝐠𝐠𝐠=−3βΘ
k−ε Turbulence model Gas viscosity
µg=µl,g+µt,g , µt,g= CµεgρgKϵ Turbulence Kinetic energy
∂
∂t�ρgK�+∇. (ρg𝐮𝐮��⃗K) =∇.�
µt,g
σk K�+ Gk,g− ρgϵ+ρgΠk,g
Turbulence dissipation rate
∂
∂t�ρgϵ�+∇. (ρg𝐮𝐮��⃗ϵ) =∇.�
µt,g
σϵ ϵ�+
ϵ
K (C1ϵGk,g−C2ϵρgϵ) +ρgΠϵ,g
where
Gk,g=µt,g�∇𝐮𝐮��⃗+ (∇𝐮𝐮��⃗)T�:∇𝐮𝐮��⃗
60 Iranian Journal of Chemical Engineering, Vol. 15, No. 3 (Summer 2018) Table 5
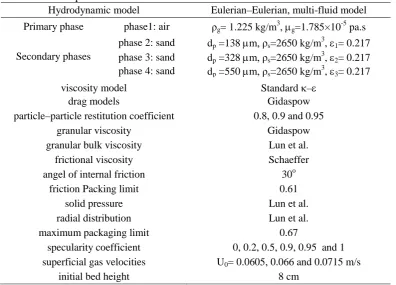
The simulation parameters.
Hydrodynamic model Eulerian–Eulerian, multi-fluid model
Primary phase phase1: air ρg= 1.225 kg/m 3
, µg=1.785×10 -5
pa.s
Secondary phases
phase 2: sand dp =138 µm, ρs=2650 kg/m 3
, ε1= 0.217
phase 3: sand dp =328 µm, ρs=2650 kg/m 3
, ε2= 0.217
phase 4: sand dp =550 µm, ρs=2650 kg/m 3
, ε3= 0.217
viscosity model Standard κ–ε
drag models Gidaspow
particle–particle restitution coefficient 0.8, 0.9 and 0.95
granular viscosity Gidaspow
granular bulk viscosity Lun et al. frictional viscosity Schaeffer angel of internal friction 30o
friction Packing limit 0.61
solid pressure Lun et al.
radial distribution Lun et al. maximum packaging limit 0.67
specularity coefficient 0, 0.2, 0.5, 0.9, 0.95 and 1 superficial gas velocities U0= 0.0605, 0.066 and 0.0715 m/s
initial bed height 8 cm
As seen in Fig. 2, although the variation of pressure drops with gas velocity is similar for all values of specularity coefficient, the total bed pressure drop (∆Pmax) and Umf increase
with increasing specularity coefficient, albeit
the change in Umf with ϕ in the range of 0 to
1 is relatively small (from 0.05 to 0.059 m/s). The increase of ∆Pmax and Umf with ϕ is due
to the increase of particles-wall friction. A lower friction results in a lower wall shear stress, which consequently leads to the lower flow resistance for the particles to move closer to the wall and the smoother
fluidization [14]. Of note, since measuring
ϕ is not possible in experiments, its value is specified by fitting the simulation results to the experimental data [13]. The comparison of experimental and simulation results of Umf
and ∆Pmax for ϕ=0, 0.2, 0.5, 0.9, 0.95, and 1 is
given in Table 6. According to Table 6, the specularity coefficients in the range of 0.5 to 0.9 lead to the satisfactory results, and the best agreement (relative error 1.8 % for Umf
and -0.6 % for ∆Pmax) is obtained for ϕ=0.9,
which corresponds to partial–slip wall boundary condition for the solid particles.
Table 6
The comparison of experimental data and simulation results of Umf and ∆Pmax for different
specularity coefficients.
Experimental Simulation
Umf (m/s) ∆Pmax (Pascal)
Umf (m/s) ∆Pmax (Pascal)
value % deviation value % deviation ϕ=0
0.055 1680
0.05 -9.1 1505 -10.4
ϕ=0.2 0.053 -3.6 1583 -5.77
ϕ=0.5 0.054 -1.8 1622 -3.45
ϕ=0.9 0.056 1.8 1670 -0.60
ϕ=0.95 0.057 3.6 1715 2.08
Iranian Journal of Chemical Engineering, Vol. 15, No. 3 (Summer 2018) 61 Figure 2. Experimental and simulation results of bed pressure drop versus superficial gas velocity for
different values of specularity coefficients.
4.2. Effects of specularity coefficient on segregation pattern
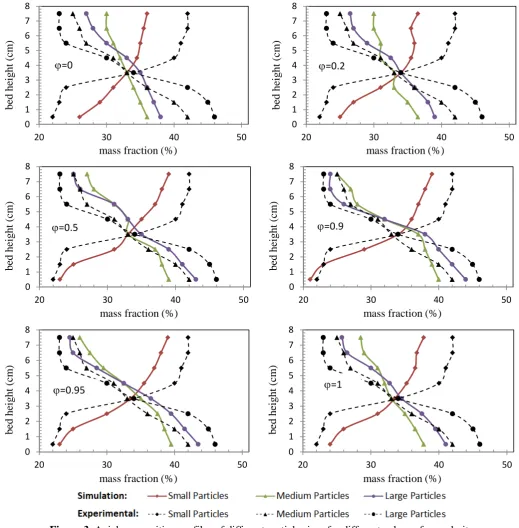
The simulation results versus experimental data for axial composition profiles of small-, medium-, and large-sized particles for different values of specularity coefficient at U0=1.1 Umf (0.0605 m/s) are illustrated in Fig.
3. In these plots, for a specified particle size, the more vertical line indicates less variation of axial composition, thus representing a slight particles segregation (good mixing), whereas the step–like line indicates an intense particles segregation. As seen in Fig.3, the increase of specularity coefficient in the range of 0 to 0.9 leads to an apparent increase in the composition variations of particles along the bed height; however, the reverse trend is observed for specularity coefficient in the range of 0.9 to 1. These results can be
explained as follows: for specularity
coefficient between 0 and 0.9, the mechanism of segregation is affected by gulf–effect (particles circulation) with upward flow of particles in the central region and downward
flow near the walls. The increasing specularity coefficient reduces particles circulation [30], leading to more intense segregation. For specularity coefficient between 0.9 and 1, the rising bubbles control the segregation mechanism [31]. Although the relatively high particle–wall shear stress leads to the formation of a stagnant layer of particles near the wall that, in turn, reduces particles circulation and increases particles’ segregation, formation and rising of the bigger bubbles with higher frequencies promotes particles mixing [32]. It can also be seen from Fig. 3 that the behavior of medium-sized particles is almost similar to that of large particles for all values of specularity coefficients. By comparing the deviations of simulation results of axial composition profiles for different specularity coefficients from experimental data in Table 7, it is clear that the specularity coefficient of 0.9 with average deviation of 6.2 % provides the best agreement with experimental data.
0 200 400 600 800 1000 1200 1400 1600 1800 2000
0.00 0.02 0.04 0.06 0.08 0.10 0.12 0.14
∆
P (
Pa
sca
l)
U0 (m/s)
Exp.
ϕ=0 ϕ=0.2 ϕ=0.5 ϕ=0.9 ϕ=0.95 ϕ=1
Umf
∆Pmax
F
ixe
d be
d
re
gi
m
e
P
ar
ti
al
ly
f
lu
id
ized
r
eg
im
e
C
o
m
p
let
e f
lu
id
ized
r
eg
im
62 Iranian Journal of Chemical Engineering, Vol. 15, No. 3 (Summer 2018) Figure 3. Axial composition profiles of different particle sizes for different values of specularity
coefficients.
Table 7
Average absolute deviations of axial mass fraction for particles of different sizes.
Particle size ϕ Specularity coefficient
=0 ϕ=0.2 ϕ= 0.5 ϕ=0.9 ϕ=0.95 ϕ=1
small 16.8 14.0 10.5 7.7 9.7 12.3
medium 10.7 10.5 6.5 4.5 5.5 8.2
large 15.8 13.4 10.8 6.4 8.6 12.1
Average deviation (%) 14.4 12.6 9.3 6.2 7.9 10.9
0 1 2 3 4 5 6 7 8
20 30 40 50
be d he ig ht ( cm )
mass fraction (%)
ϕ=0 0 1 2 3 4 5 6 7 8
20 30 40 50
be d he ig ht ( cm )
mass fraction (%)
ϕ=0.2 0 1 2 3 4 5 6 7 8
20 30 40 50
be d he ig ht ( cm )
mass fraction (%)
ϕ=0.5 0 1 2 3 4 5 6 7 8
20 30 40 50
be d he ig ht ( cm )
mass fraction (%)
ϕ=0.9 0 1 2 3 4 5 6 7 8
20 30 40 50
be d he ig ht ( cm )
mass fraction (%)
ϕ=0.95 0 1 2 3 4 5 6 7 8
20 30 40 50
be d he ig ht ( cm )
mass fraction (%)
Iranian Journal of Chemical Engineering, Vol. 15, No. 3 (Summer 2018) 63
Besides the analysis of axial composition profiles for different particle sizes, the extent of particles segregation can be described using a single integrated parameter, called segregation index (s). The axial compositions of both small- and large-sized particles are employed to define the segregation index, described as [3,33]:
(1)
s =SS−1
max−1
Parameter S in numerator of Eq. 1 is the ratio of average heights of the small- and large-sized particles, and it is representative of actual amount of segregation:
(2)
S =hhsmall
large
where hsmall and hlarge are the average
dimensionless heights of the small- and large-sized particles, specified as follows:
(3)
hsmall=�xsmall,i∗hi i
(4)
hlarge=�xlarge,i∗hi i
where hi denotes the dimensionless height of
each axial section that is vacuumed out to determine the composition of each class of particle sizes (xi).
Parameter Smax in denominator of Eq. 1
indicates the maximum amount of segregation that corresponds to the state in which small particles are completely accumulated in the top portion, while the large particles are all collected in the bottom portion of the bed as shown in Fig. 4.
(5)
Smax =hhsmall,max large,min
(6)
hsmall,max= xlarge+ xmedium+ 0.5
∗xsmall
= 1−xsmall+ 0.5
∗xsmall= 1−0.5∗xsmall (7)
hlarge= 0.5∗xlarge
(8)
Smax =1−0.50.5∗x∗xsmall large =
2−xsmall
xlarge
Figure 4. The condition of maximum segregation.
Based on the definition of segregation index (s) in Eq.1, s=1 refers to perfect particles segregation, whereas s=0 denotes perfect particles mixing or no segregation.
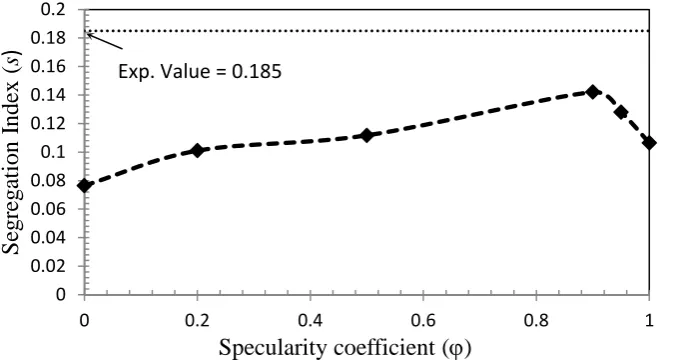
Fig. 5 shows experimental value versus simulation results of segregation index obtained by Eq.1 for different values of
specularity coefficient at U0=1.1 Umf (0.0605
m/s). It is clear that the maximum segregation index occurs at specularity coefficient of 0.9 at which the segregation pattern may be affected by simultaneous mechanisms of particles circulation and rising bubbles. It is also seen that the simulations below predict Small particles
Medium particles
64 Iranian Journal of Chemical Engineering, Vol. 15, No. 3 (Summer 2018)
the segregation indexes for all specularity coefficients that can be attributed to the effects of particles shape, particle–particle
frictions, and inter–particle forces, which cannot be included in the CFD simulation.
Figure 5. Segregation index for different values of specularity coefficient.
4.3. Effects of particle–wall restitution coefficient on segregation pattern
In order to study the effect of particle-wall restitution coefficient (ew) which quantifies
the dissipation of particles kinetic energy due to collisions with the wall, the simulations were executed using three values of ew (0.8,
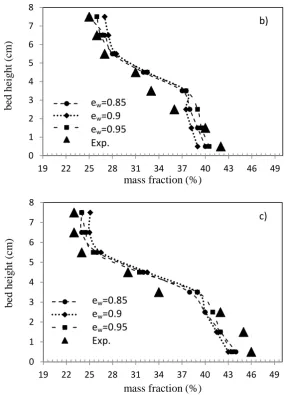
0.9, and 0.95). Fig. 6 shows the simulation and experimental results of axial composition profiles for small-, medium-, and large-sized particles for different particle-wall restitution coefficients at U0=1.1 Umf. Although reducing
ew will increase the dissipation of particles
kinetic energy, leading to a decrease in
granular temperature and an increase in solid volume fraction at the wall [28], for ew values
used in this study, the effect of ew on the axial
composition profiles for different particle sizes is negligible. As seen in Fig. 6, no evident differences are observed for the predicted results of ew= 0.8, 0.9 and 0.95 so
that the profiles can be nearly overlapped and are in good agreement with the experimental data. This result is consistent with the findings of Li et al. [28] and Zhong et al. [13], indicating that the particle-wall restitution plays only a minor role in numerical simulation of bubbling fluidized beds.
0 1 2 3 4 5 6 7 8
19 22 25 28 31 34 37 40 43 46 49
be
d he
ig
ht
(
cm
)
mass fraction (%)
a) ew=0.85
ew=0.9 ew=0.95 Exp. 0
0.02 0.04 0.06 0.08 0.1 0.12 0.14 0.16 0.18 0.2
0 0.2 0.4 0.6 0.8 1
S
eg
reg
at
io
n
I
n
d
ex
(
s
)
Specularity coefficient (ϕ)
Iranian Journal of Chemical Engineering, Vol. 15, No. 3 (Summer 2018) 65 Figure 6. Axial composition profiles of different particle sizes for different values of particle–wall
restitution coefficients, a) small, b) medium and c) large particles.
4.4. Effect of superficial gas velocity on segregation pattern
Fig. 7 shows the contours of volume fraction for the gas and solid phases at different superficial gas velocities: U0= 1.1 Umf
(0.0605 m/s), 1.2 Umf (0.066 m/s), and 1.3
Umf (0.0715 m/s) when specularity coefficient
and particle-wall restitution coefficient are both set to 0.9. This range of gas velocity is selected to ensure staying in bubbling regime. In fully bubbling fluidized beds, the mixing and segregation pattern is intensely affected by the dynamic behaviors of bubbles [20]. The particles in the wake region of bubbles travel towards the top of bed, resulting in
axial mixing, while as bubbles rise, the particles fall down around the bubbles, leading to axial segregation. The mixing and segregation pattern of particles in the bubbling fluidized bed is determined by the dynamic equilibrium of these two phenomena. As seen in Fig. 7, particle mixing is promoted by increasing the gas velocity that results in formation of bigger bubbles with higher frequencies. At superficial gas velocity of U0= 1.1 Umf (Fig. 7-a), a
quasi-stagnant layer of large- and medium-sized particles with no bubble is formed in the lower region of the bed, while small bubbles are observed in the higher zone which is
0 1 2 3 4 5 6 7 8
19 22 25 28 31 34 37 40 43 46 49
be
d he
ig
ht
(
cm
)
mass fraction (%)
b)
ew=0.85
ew=0.9
ew=0.95
Exp.
0 1 2 3 4 5 6 7 8
19 22 25 28 31 34 37 40 43 46 49
be
d he
ig
ht
(
cm
)
mass fraction (%)
c)
ew=0.85
ew=0.9
ew=0.95
66 Iranian Journal of Chemical Engineering, Vol. 15, No. 3 (Summer 2018)
mainly composed of small particles. In the absence of bubbles in the quasi-stagnant layer, there is no mechanism present to carry the particles to the upper zone of the bed, which indicates the significant role of bubbles for particles mixing in fluidized beds. For this gas velocity, a strong segregation of small particles takes place in the bed, and significant non-homogeneity of the axial particle composition is observed. Increasing the superficial gas velocity to U0= 1.2 Umf
(Fig. 7-b) expands the quasi-stagnant layer that leads to the formation of bubbles in the
lower region of the bed. The bubbles act as a vehicle to transport the medium- and large-sized particles to the higher region of the bed. The bubbles get bigger as they ascend and improve the mixing process. The further increase of the gas velocity to U0= 1.3 Umf
(Fig. 7-c) results in the bigger bubbles with higher frequencies that form at the bottom of bed. These bubbles enhance the mixing process so that the particles with different sizes are almost distributed everywhere in the bed.
Figure 7. The contour plots of volume fractions for different phases at different superficial gas velocities at t= 25s: a) U0= 1.1 Umf (0.0605m/s), b) 1.2 Umf (0.066m/s), and c) 1.3 Umf (0.0715m/s).
The time–dependent simulation results versus steady-state experimental values for the segregation index at different superficial
Iranian Journal of Chemical Engineering, Vol. 15, No. 3 (Summer 2018) 67
beginning of the simulations. A significant reduction in segregation index is observed with increasing gas velocity from 1.1 Umf to
1.3 Umf. As mentioned earlier, in this range of
gas velocity, the bubbling regime is observed, and the increase of gas velocity leads to producing the bubbles with larger sizes which rise faster through the bed, causing bed mixing throughout. The comparison of the time-averaged simulation results (between 20 to 30 second) and experimental values of segregation index is given in Table 8. As it can be seen, the deviation of the simulation
results from experimental values is reduced at higher superficial gas velocity. This is the reason why, at higher gas velocities, the particles away from each other and the bed expand, leading to a decrease in the particle– particle friction. Since the particle–particle friction, with a large influence on the particles’ mixing behavior, is not incorporated
in MFM/CFD simulation [34], better
agreement between simulation results and experimental data is obtained at a higher gas velocity.
Figure 8. Time-dependent segregation index for different superficial gas velocities.
Table 8
A comparison of simulation results and experimental value for segregation index.
Superficial gas velocity
Experimental value
Simulation result
Absolute deviation
1.1 Umf 0.185 0.142 30.2 %
1.2 Umf 0.091 0.072 26.1 %
1.3 Umf 0.042 0.035 20 %
5. Conclusions
In an attempt to elucidate the significance of the solid-wall boundary condition in prediction of segregation behavior of a
ternary mixture in a gas-solid bubbling fluidized bed, CFD simulations were conducted using a multi-fluid model incorporating the kinetic theory of granular
0 0.05 0.1 0.15 0.2 0.25
0 5 10 15 20 25 30
S
eg
reg
at
io
n
i
n
d
ex
(
s
)
time (s)
U0=1.1Umf U0=1.2Umf
U0=1.3Umf Exp. Value: 1.1Umf
Exp. Value: 1.2Umf
68 Iranian Journal of Chemical Engineering, Vol. 15, No. 3 (Summer 2018)
flow. Several simulations with different values of specularity coefficient (ϕ=0, 0.2, 0.5, 0.9, 0.95 and 1) and different values of particle-wall restitution (ew=0.8, 0.9 and 0.95)
were performed. The simulation results of the bed pressure drop, mass fraction distributions of the different-sized particles along the bed height, and segregation index were compared with experimental data. It was shown that the specularity coefficient had a significant influence on the segregation pattern, and the best agreement between simulation and experimental data obtained by the 'freeze-sieving' method was found at specularity coefficient of 0.9. However, the particle-wall restitution coefficient had only a negligible effect on the results.
The investigation of effects of superficial gas velocity on the segregation behavior in bubbling regime showed an obvious reduction in the segregation index with increasing superficial gas velocity. Increasing the superficial gas velocity from 1.1 Umf (0.0605
m/s) to 1.3 Umf (0.0715 m/s) leads to the
expansion of the quasi-stagnant layer of medium- and large-sized particles and to the formation of bubbles in the lower region of the bed. The bubbles get larger when they rise and act as a carrier to transport the medium and large particles to the upper region of the bed. It was indicated that the mechanism of particles segregation was affected by the bubbles dynamics so that the larger gas velocity implied the larger and faster moving bubbles that reduced the segregation index.
Nomenclature
dp particle diameter [m].
es restitution coefficient of particle-particle.
ew wall-particle coefficient. restitution
g
�⃗ gravity [m. s−2].
g0 radial distribution function.
I2D second invariant of the deviatoric stress tensor.
Cµ, C1ϵ, C2ϵ,
σk, σϵ
turbulence model coefficients.
Gk,g turbulence kinetic energy production [kg. m−1. s−3].
I̿ unit tensor.
Ps solid pressure [kg. m−1. s−2].
u
�⃗ gas velocity vector [m. s−1].
v
�⃗ particle velocity vector [m. s−1]. D0 bed diameter.
H bed height.
H0 particles height in bed.
s segregation index.
Umf minimum fluidization velocity.
K turbulent kinetic energy of gas
phase [m2. s−2].
P pressure [kg. m−1. s−2]. Greek letters
Θ granular temperature [m2. s−2].
ΠK,g , Πϵ,g influence of the dispersed phases on the continuous phase.
µl,g gas molecular viscosity
[kg. m−1. s−1].
µs,col collisional viscosity of solid
[kg. m−1. s−1].
µs,fr frictional viscosity of solid
[kg. m−1. s−1].
µs,kin kinetic viscosity of solid
[kg. m−1. s−1].
λs bulk viscosity of solid
[kg. m−1. s−1].
µs shear viscosity of solid
[kg. m−1. s−1].
µt,g gas turbulent viscosity
[kg. m−1. s−1].
µg gas viscosity [kg. m−1. s−1].
Θw granular temperature at wall
[m2. s−2].
τ�g , τ�s
stress tensor for gas and solid phase, respectively
[kg. m−1. s−2].
Iranian Journal of Chemical Engineering, Vol. 15, No. 3 (Summer 2018) 69 phases [kg. m−1. s−3].
kΘs diffusion coefficient of granular energy [kg. m−1. s−1].
γΘs collisional energy dissipation [kg. m−1. s−3].
εg,εs volume fraction of gas and solid respectively.
εs,max maximum packing limit of solids.
ρg , ρs gas and solid density [kg. m−3].
β momentum interphase exchange
coefficient [kg. m−3. s−1].
φ specularity coefficient.
ϵ turbulence dissipation energy of gas phase [m2. s−3].
References
[1] Gidaspow, D., Multiphase flow and
fluidization: Continuu and kinetic theory descriptions, Academic Press, (1994). [2] Huilin, L., Yunhua, Z., Ding, J.,
Gidaspow, D. and Wei, L., “Investigation of mixing/segregation of mixture particles in gas-solid fluidized beds”,
Chem. Eng. Sci., 62, 301 (2007).
[3] Chew, J. W., Wolz, J. R. and Hrenya, C. M., “Axial segregation in bubbling gas-fluidized beds with Gaussian and lognormal distributions of Geldart Group B particles”, AIChE J., 56, 3049 (2010). [4] Huilin, L., Yurong, H., Gidaspow, D.,
Lidan, Y. and Yukun, Q., “Size segregation of binary mixture of solids in
bubbling fluidized beds”, Powder
Technol., 134, 86 (2003).
[5] Nienow, A. W., Rowe, P. N. and
Cheung, L. Y. -L., “A quantitative analysis of the mixing of two segregating powders of different density in a gas-fluidised bed”, Powder Technol., 20, 89 (1978).
[6] Cluet, B., Mauviel, G., Rogaume, Y.,
Authier, O. and Delebarre, A.,
“Segregation of wood particles in a
bubbling fluidized bed”, Fuel Process.
Technol., 133, 80 (2015).
[7] van Wachem, B. G. M., Schouten, J. C., van den Bleek, C. M., Krishna, R. and Sinclair, J. L., “Comparative analysis of CFD models of dense gas-solid systems”,
AIChE J., 47, 1035 (2001).
[8] Joseph, G. G., Leboreiro, J., Hrenya, C. M. and Stevens, A. R., “Experimental segregation profiles in bubbling
gas-fluidized beds”, AIChE J., 53, 2804
(2007).
[9] Rowe, P. N. and Nienow, A. W.,
“Particle mixing and segregation in gas
fluidised beds: A review”, Powder
Technol., 15, 141 (1976).
[10]Zhang, Y., Zhao, Y., Lu, L., Ge, W., Wang, J. and Duan, C., “Assessment of polydisperse drag models for the size segregation in a bubbling fluidized bed using discrete particle method”, Chem.
Eng. Sci., 160, 106 (2017).
[11]Jang, H. T., Park, T. S. and Cha, W. S., “Mixing-segregation phenomena of binary system in a fluidized bed”, J. Ind.
Eng. Chem., 16, 390 (2010).
[12]Herzog, N., Schreiber, M., Egbers, C. and Krautz, H. J., “A comparative study of different CFD-codes for numerical simulation of gas-solid fluidized bed
hydrodynamics”, Comput. Chem. Eng.,
39, 41 (2012).
[13]Zhong, H., Gao, J., Xu, C. and Lan, X., “CFD modeling the hydrodynamics of binary particle mixtures in bubbling fluidized beds: Effect of wall boundary condition”, Powder Technol., 230, 232 (2012).
70 Iranian Journal of Chemical Engineering, Vol. 15, No. 3 (Summer 2018)
of spouted beds”, Chem. Eng. Sci., 69
419 (2012).
[15]Zhou, X., Gao, J., Xu, C. and Lan, X., “Effect of wall boundary condition on CFD simulation of CFB risers”,
Particuology, 11, 556 (2013).
[16]Johnson, P. C. and Jackson, R.,
“Frictional-collisional constitutive relations for granular materials, with application to plane shearing”, J. Fluid
Mech., 176, 67 (1987).
[17]Loha, C., Chattopadhyay, H. and
Chatterjee, P. K., “Euler-euler CFD modeling of fluidized bed: Influence of specularity coefficient on hydrodynamic behavior”, Particuology, 11, 673 (2013). [18]Bahramian, A., Olazar, M. and Ahmadi,
G., “Effect of slip boundary conditions on the simulation of microparticle velocity fields in a conical fluidized bed”, AIChE J., 59, 4502 (2013).
[19]Sharma, A., Wang, S., Pareek, V., Yang, H. and Zhang, D., “CFD modeling of mixing/segregation behavior of biomass and biochar particles in a bubbling fluidized bed”, Chem. Eng. Sci., 106, 264 (2014).
[20]Geng, S., Jia, Z., Zhan, J., Liu, X. and
Xu, G., “CFD modeling the
hydrodynamics of binary particle mixture in pseudo-2D bubbling fluidized bed:
Effect of model parameters”, Powder
Technol., 302, 384 (2016).
[21] Gao, J., Lan, X., Fan, Y., Chang, J., Wang, G., Lu, C. and Xu, C., “Hydrodynamics of gas-solid fluidized bed of disparately sized binary particles”,
Chem. Eng. Sci., 64, 4302 (2009).
[22]Coroneo, M., Mazzei, L., Lettieri, P., Paglianti, A. and Montante, G., “CFD prediction of segregating fluidized bidisperse mixtures of particles differing
in size and density in gas-solid fluidized beds”, Chem. Eng. Sci., 66, 2317 (2011). [23]Rasteh, M., Farhadi, F. and Bahramian,
A., “Hydrodynamic characteristics of gas-solid tapered fluidized beds: Experimental studies and empirical
models”, Powder Technol., 283, 355
(2015).
[24]Schaafsma, S. H., Marx, T. and
Hoffmann, A. C., “Investigation of the particle flowpattern and segregation in tapered fluidized bed granulators”,
Chem. Eng. Sci., 61, 4467 (2006).
[25]Almuttahar, A. and Taghipour, F.,
“Computational fluid dynamics of high density circulating fluidized bed riser: Study of modeling parameters”, Powder
Technol., 185, 11 (2008).
[26]Lun, C. K. K., Savage, S. B., Jeffrey, D. J. and Chepurniy, N., “Kinetic theories for granular flow: Inelastic particles in Couette flow and slightly inelastic particles in a general flowfield”, J. Fluid
Mech., 140, 223 (1984).
[27]Schaeffer, D. G., “Instability in the evolution equations describing incompressible granular flow”, J. Differ. Equ., 66, 19 (1987).
[28]Li, T., Grace, J. and Bi, X., “Study of wall boundary condition in numerical simulations of bubbling fluidized beds”,
Powder Technol., 203, 447 (2010).
[29]Khani, M. H., “Models for prediction of hydrodynamic characteristics of gas-solid tapered and mini-tapered fluidized
beds”, Powder Technol., 205, 224
(2011).
[30]Benyahia, S., Syamlal, M. and O’Brien, T. J., “Study of the ability of multiphase continuum models to predict
core-annulus flow”, AIChE J., 53, 2549
Iranian Journal of Chemical Engineering, Vol. 15, No. 3 (Summer 2018) 71
[31]Zhang, Y., Zhao, Y., Lu, L., Ge, W., Wang, J. and Duan, C., “Assessment of polydisperse drag models for the size segregation in a bubbling fluidized bed using discrete particle method”, Chem.
Eng. Sci., 160, 106 (2017).
[32]Sun, J. and Battaglia, F., “Hydrodynamic modeling of particle rotation for segregation in bubbling gas-fluidized beds”, Chem. Eng. Sci., 61, 1470 (2006). [33]Olaofe, O. O., Patil, A. V., Deen, N. G.,
van der Hoef, M. A. and Kuipers, J. A. M., “Simulation of particle mixing and segregation in bidisperse gas fluidized beds”, Chem. Eng. Sci., 108, 258 (2014). [34]van der Hoef, M. A., van Sint Annaland,
M., Deen, N. G. and Kuipers, J. A. M., “Numerical simulation of Dense gas-solid fluidized beds: A multiscale
modeling strategy”, Annu. Rev. Fluid