ISSN Online: 2169-2688 ISSN Print: 2169-267X
DOI: 10.4236/ars.2019.84007 Dec. 31, 2019 99 Advances in Remote Sensing
Hyperspectral Analysis for a Robust
Assessment of Soil Properties Using
Adapted PLSR Method
Zouhaier Ben Rabah
1, Hedi Garbia
2, Emna Karray
1, Kais Tounsi
1, Abdelaziz Kallel
3,
Basel Solaiman
413E Laboratory, National Engineering School of Sfax, University of Sfax, Sfax, Tunisia
2National Center of Mapping and Remote Sensing, Tunis, Tunisia
3Digital Research Centre of Sfax, Sfax, Tunisia
4IMT Atlantique, Bretagn-Pays de la Loire, France
Abstract
Near-InfraRed and Visible (Vis-NIR) spectroscopy is a promising tool allow-ing to quantify soil properties. It shows that information encoded in hyper-spectral data can be useful after signal processing and model calibration steps, in order to estimate various soil properties throughout appropriate statistical models. However, one of the problems encountered in the case of hyperspec-tral data is related to information redundancy between different spechyperspec-tral bands. This redundancy is at the origin of multi-collinearity in the explana-tory variables leading to unstable regression coefficients (and, difficult to in-terpret). Moreover, in hyperspectral spectrum, the information concerning the chemical specificity is spread over several wavelengths. Therefore, it is not wise to remove this redundancy because this removal affects both rele-vant and irrelerele-vant hyperspectral information. In this study, the faced chal-lenge is to optimize the estimation of some soil properties by exploiting all the spectral richness of the hyperspectral data by providing complementary rather than redundant information. To this end, a new reliable approach based on hyperspectral data analysis and partial least squares regression is proposed.
Keywords
Spectroscopy, Hyperspectral Data, Soil Properties, Partial Least Squares Regression Model
How to cite this paper: Rabah, Z.B., Gar-bia, H., Karray, E., Tounsi, K., Kallel, A. and Solaiman, B. (2019) Hyperspectral Anal-ysis for a Robust Assessment of Soil Prop-erties Using Adapted PLSR Method. Ad-vances in Remote Sensing, 8, 99-108. https://doi.org/10.4236/ars.2019.84007
Received: September 10, 2019 Accepted: December 28, 2019 Published: December 31, 2019
Copyright © 2019 by author(s) and Scientific Research Publishing Inc. This work is licensed under the Creative Commons Attribution International License (CC BY 4.0).
DOI: 10.4236/ars.2019.84007 100 Advances in Remote Sensing
1. Introduction
Soil is a part of the natural environment and one of the most valuable natural resources. In environmental monitoring, and given its importance in environ-mental management sustainable agriculture and hydrological, reliable and rapid assessment of soils properties is a crucial challenge. Various remote sensing data, including multispectral and hyperspectral remote sensing data [1], have been widely used to identify and map soil properties (such as saline soils). Moreover, several research studies targeted to exploit the reflectance spectrum across the visible, near infrared and shortwave infrared region for the assessment of soil properties [2]. Although, the use of hyperspectral data to estimate soil characte-ristic information has gradually oriented to predict soil physical and chemical properties, etc., soils spectral reflectance encapsulates the necessary information to qualify and quantify all predictable properties. In fact, and according to [3] [4], a soil property is predictable by Vis-NIR spectroscopy if it is correlated with a chemical specificity. Indeed, the interaction between matters and electromag-netic waves (within the soil spectrum sample) is not directly exploitable due to the great variability of the phenomenon [5] [6]. The huge amount of involved variables, where some of which are poorly known (such as incidence angles, light intensity, soil components distribution, etc.), leads to the fact that the best de-scription approach of the phenomenon is the statistical modeling. Therefore, to conduct a predictive soil properties model, it is more efficient to rely on learn-ing-based methods such as the linear regression approach. An overview of these approaches and how they provide optimal results under certain circumstances is given in [7] [8]. These approaches assume that the data verify a number of as-sumptions such as linearity. In reality, the data relatively deviate from these prior assumptions leading, thus, to efficiency lack of these models in several sit-uations. One of the problems, encountered in the case of hyperspectral data, is related to information redundancy between different spectral bands. Indeed, this redundancy creates multi-collinearity in the explanatory variables and makes the regression coefficients unstable and difficult to interpret. In fact, a hyperspectral spectrum is composed of a few hundred wavelengths and the information con-cerning a given chemical specificity is spread over several wavelengths. There-fore, it is irrelevant to remove this redundancy since this removal severely affects the hyperspectral information. The challenge in this study is to exploit all the spectral richness of the data by providing complementary rather than redundant information.
The idea is to weight each band according to its importance in the projection, thus the important bands are more favored than those of less importance.
The model calculates for each band a parameter called VIP (variable impor-tance in the projection) that we will use for this weighting.
The new model based on this weighting is more suitable for data and has a better coefficient of determination.
DOI: 10.4236/ars.2019.84007 101 Advances in Remote Sensing presented. The description of the investigation area, materials, field sampling and laboratory spectral measurement is, first, given. The soil properties model-ing methodology and assessment are then detailed. Finally, the adapted PLSR model based on weighted VIP is highlighted. Section 3 is devoted to the experi-mental evaluation and to show the advantages of the proposed adapted PLSR method for real-world data. Concluding remarks are then drawn in Section 4.
2. Materials and Method
2.1. Investigation Area
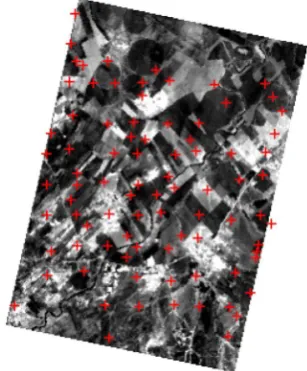
The investigated site is located in the Governorate of Zaghouan in Tunisia; it is part of the plain SMINJA and BOURBIAA (Figure 1). This area covers 34,000 Ha limited to the East by the locality of Zaghouan, to the north by the Bir Mchergua and to the west by the locality of Jabbes. It is characterized by a semi-arid climate to mild winter. The average annual rainfall, recorded in the station of the Agricultural Development Corporation [9] over a period of 11 years, is 390 mm. This water level is distributed as follows: 75% during the au-tumn-winter season, 21% and 4% respectively during the spring and summer [9]. This rainfall is marked by a significant inter-seasonal and inter-annual vari-ation. The average annual temperature is 17.8˚C. The minimum and maximum is 10.9˚C and 24.6˚C and the coldest month (January) is 9.6˚C [9]. The prevail-ing winds are those in the northwest direction durprevail-ing the wet season and south-west during the dry season.
[image:3.595.218.528.459.691.2]The synthesis of data, from the agricultural map of Zaghouan governorate, al-lows to identify the main soil types in the SMINJA sector (Figure 2). The soil cover consists mainly of:
DOI: 10.4236/ars.2019.84007 102 Advances in Remote Sensing
Figure 2. Data synthesis of the agricultural map of Zaghouan governorate.
- Vertisoils occupying about 30% of the studied area. These soils evolve on clay alluvium and are healthy, of fine texture “agrilo-silty”. They are swelling clays whose exchange capacity is high. Their main characters are: high content of fine elements; strong retention capacity and a relatively high level of limes-tone. From an agronomic point of view, these soils have a good aptitude for arable crops and a mediocre aptitude for fruit growing in irrigated olive and almond trees. For annual crops, these soils have a good ability, with organic and mineral amendments [10].
- Poorly developed soils: these soils, in turn, cover around 30% of the studied area and are mainly located in the plain of SMINJA. They are deep, healthy and not very moist. The surface horizons of these soils are coarse-textured (sandy-loam-sandy) and devoid of organic matter.
We also note, mainly, the presence of the Brown Limestone Soils (SBC) as well as the Isohumic Soils distributed at different places of the studied area.
2.2. Field Sampling and Laboratory Spectral Measurement
DOI: 10.4236/ars.2019.84007 103 Advances in Remote Sensing
Figure 3. Mixing of the samples from the 4 corners to represent one soil sample.
2.3. Soil Properties Modeling and Assessment
The goal of developing a regression model is primarily to map the soil properties of a geographic area. Indeed, the problem lies in the fact that if the investigation area is relatively large, it is difficult, or even impossible, to “visit” the whole area. Thus, the solution consists on determining the soil properties based on acquired samples and, then, generalizing through extrapolation over the entire area. To generalize, it is necessary to establish a relation between some known variables (x1, x2 …, xn) and the property to be predicted y, in all points of the zone. This relation is called the property model: P = f(x1, x2, … xn) with P the studied prop-erty and “f” the obtained model.
This relation is, thus, established based on the values of the property P using the acquired samples, and then generalized to all points of the zone. The role of the explanatory variables (x1, x2, …, xn) will be extracted by means of remotely sensed images or by the use of a spectroscopic measurement. The property can considered as being the presence of a specific product/material (carbon, clay, etc.) or a phenomenon (pH, Conductivity, etc.). In fact, it is assumed that there is a relationship between the property under study and the reflectance spectrum of the body possessing this property. Therefore, in this study, the Partial Least Squares Regression (PLSR) method is applied to build a prediction model based on bare soil samples drawn from each studied region.
DOI: 10.4236/ars.2019.84007 104 Advances in Remote Sensing
Y = b0 + zbiRλi (1) where Y is the predicted property, bi are the coefficients of the model, Rλi is the reflectance corresponding to the wavelength λi. Recalling the fact that wave-lengths do not have the same importance for prediction, therefore, we calculate the VIP (Variable Importance in Projection) which estimates the importance of each variable in the projection used for the PLS model. For a variable, the more the VIP coefficient is large, the more the variable is considered as being impor-tant.
Selection methods allow keeping only a small amount of variables that better describe the model and eliminate the rest of variables ensuring, thus, parsimony in the description of the model. One of the most popular methods is the VIP
proposed in [11] [12] [13]. The major issue concerns the selection of spectral bands for which VIP ≥ VIP0 where VIP0 is a threshold with a value generally considered as 1 or 0.8. This method assumes that eliminated bands do not con-tain information or that they just vehicle noise.
Spectral bands for which VIP < VIP0 can contain a non-negligible additional information and, therefore, contribute to increase the coefficient of determina-tion R2. The classical PLSR gives the same importance to all the spectral bands while the VIP selection method gives importance to the retained spectral bands and removes the importance of the eliminated bands [14].
We propose to keep all spectral bands while attributing less importance to bands with a low VIP. The weighting coefficient of a band A is the VIP of this band (Table 1). Consequently, a new spectrum is deduced from the original spectrum:
(Ri)’ = RiVIPi (2) where,
(Ri)’: weighted reflectance;
Ri: reflectance of wavelength λi;
VIPi: VIP corresponding to λi;
In this way, the minor variable is not null.
3. Result and Discussion
3.1. Descriptive Soils Properties Prediction Using PLSR Based on
VIP
Selection Method
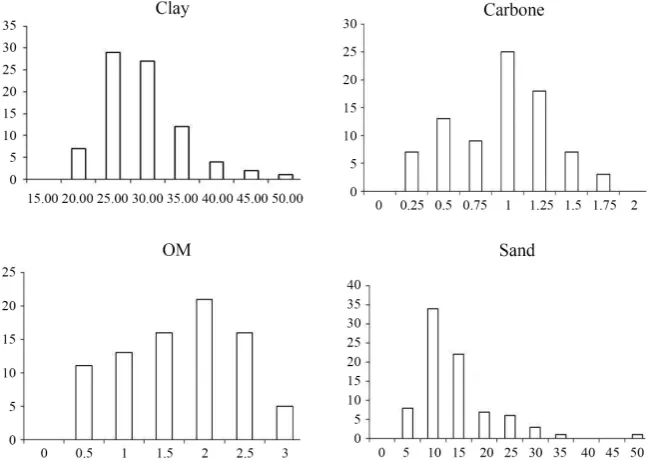
For each considered property, all samples in the data set are used to calibrate the soil property prediction models of Clay, Carbon, Organic Matter and Sand.
Fig-ure 4 represents histograms of these properties. The PLSR method is applied to
build a prediction model for each property. The relationships between measured and predicted soil properties values are represented in Figure 5. In order to de-termine the optimal calibrated model, three evaluation criteria are considered: the highest values of R2, the highest values of adjusted R2 and the lowest value of RMSE (Root Mean Square Error). The results are presented in Tables 2-5.
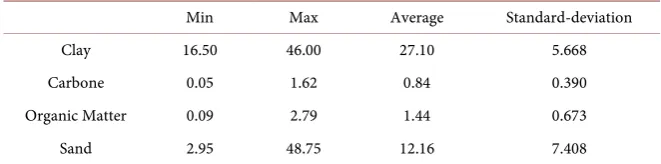
DOI: 10.4236/ars.2019.84007 105 Advances in Remote Sensing are given in Table 6. A significant difference between the minimum value and the maximum value of each property occurs. This difference is more remarkable for certain properties than others such as for sand. This reflects a spatial varia-tion of these components.
Figure 4. Histograms of clay, carbon, OM and sand soil properties.
Figure 5. Relationship between measured and predicted soil properties values.
Table 1. Formula used to generate the indices.
λ1 λ2 λ3 λ4 λ5
PLSR Classical 1 1 1 1 1
PLSR VIP selection 1 0 1 0 0
[image:7.595.215.533.410.607.2]DOI: 10.4236/ars.2019.84007 106 Advances in Remote Sensing
Table 2. Summary of the linear coefficient of determination (R2), the adjusted linear coefficient of determination (R2 adjusted) and the RMSE of classic PLSR method, PLSR based on VIP selection method and adapted PLSR based on VIP weighted method of clay property.
Classic PLSR method
PLSR based on VIP
selection method on VIP weighted method Adapted PLSR based Clay content
R2 0.450 0.473 0.479
Adjusted 0.443 0.467 0.473
RMSE 4.513 4.294 4.372
Table 3. Summary of the linear coefficient of determination (R2), the adjusted linear coefficient of determination (R2 adjusted) and the RMSE of classic PLSR method, PLSR based on VIP selection method and adapted PLSR based on VIP weighted method of carbone property.
Classic PLSR
method PLSR based on VIP selection method Adapted PLSR based on VIP weighted method Carbone
R2 0.390 0.319 0.403
Adjusted 0.382 0.311 0.396
RMSE 0.326 0.371 0.320
Table 4. Summary of the linear coefficient of determination (R2), the adjusted linear coefficient of determination (R2 adjusted) and the RMSE of classic PLSR method, PLSR based on VIP selection method and adapted PLSR based on VIP weighted method of organic matter property.
Classic PLSR
method PLSR based on VIP selection method Adapted PLSR based on VIP weighted method Organic Matter
R2 0.390 0.311 0.409
Adjusted 0.383 0.302 0.402
RMSE 0.562 0.609 0.548
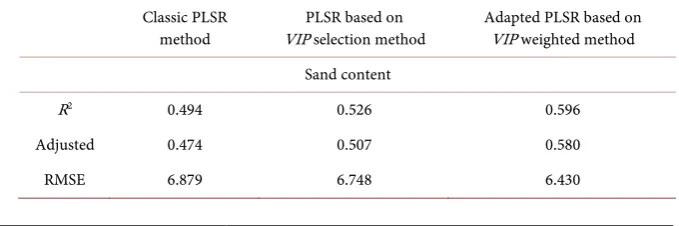
Table 5. Summary of the linear coefficient of determination (R2), the adjusted linear coefficient of determination (R2 adjusted) and the RMSE of classic PLSR method, PLSR based on VIP selection method and adapted PLSR based on VIP weighted method of sand property.
Classic PLSR
method VIP selection method PLSR based on Adapted PLSR based on VIP weighted method Sand content
R2 0.494 0.526 0.596
Adjusted 0.474 0.507 0.580
[image:8.595.211.539.128.224.2] [image:8.595.211.539.294.390.2] [image:8.595.210.538.459.556.2] [image:8.595.200.540.625.738.2]DOI: 10.4236/ars.2019.84007 107 Advances in Remote Sensing
Table 6. Descriptive samples properties statistics.
Min Max Average Standard-deviation
Clay 16.50 46.00 27.10 5.668
Carbone 0.05 1.62 0.84 0.390
Organic Matter 0.09 2.79 1.44 0.673
Sand 2.95 48.75 12.16 7.408
3.2. Soil Properties Prediction Using Adapted PLSR Based on
VIP
Weighted Method
One of the problems of the selection method is the threshold determination from which the bands will be selected. In fact, a too small threshold gives the same importance to noise and information. This significantly affects the predic-tion model and degrades it. On the other hand, a too big threshold tends to sca-rify some important spectral bands and, therefore, to neglects information. The application of the weighting method has the advantage of having no randomly or iteratively search. However, each band is weighted with its own VIP.
4. Conclusions
In this paper, a comprehensive and analysis experiment on a new soil property prediction model based on VIP weighted process is provided. Certainly, not all wavelengths are equally important. For this, we calculate the VIP (Variable Im-portance in Projection) which estimates the imIm-portance of each variable in the projection used for the PLSR model. The more the VIP coefficient is large for a given variable, the more the variable is considered important. Unlike the classic-al PLSR prediction model, the VIP selection method gives importance to the re-tained bands and removes the importance of the eliminated spectral bands. However, in this study we have shown that the adapted PLSR based on VIP
weighted method offers a potentially on soil property prediction. We propose to keep all spectral bands but give less importance to bands that have a low VIP. The weighting coefficient of a band A is the VIP of this band and a new spec-trum is deduced from the original specspec-trum. The experimental results show that the novel approach outperforms the standard PLSR model.
Future studies are tied to the weighting techniques using statistical strategies to improve the prediction model.
Conflicts of Interest
The authors declare no conflicts of interest regarding the publication of this pa-per.
References
[1] Jobson, J.D. (1999) Applied Multivariate Data Analysis: Volume 1: Regression and Experimental Design. Springer Verlag, New York.
DOI: 10.4236/ars.2019.84007 108 Advances in Remote Sensing IEEE Transaction on Geoscience and Remote Sensing, 33, 692-699.
https://doi.org/10.1109/36.387584
[3] Ben Dor, E. and Patkin, K. (2002) Mapping of Several Soil Properties Using DAIS-7915 Hyperspectral Scanner Data. International Journal of Remote Sensing, 23, 1043-1062. https://doi.org/10.1080/01431160010006962
[4] Weng, Y., Gong, P. and Zhu, Z. (2008) Reflectance Spectroscopy for the Assessment of Soil Salt Content in Soils of the Yellow River Delta of China. International Jour-nal of Remote Sensing, 29, 5511-5531.https://doi.org/10.1080/01431160801930248
[5] Leone, A.P., Raphael, A., Rossel, V., Amenta, P. and Buondonno, A. (2012) Predic-tion of Soil Properties with PLSR and Vis-NIR Spectroscopy: ApplicaPredic-tion to Medi-terranean Soils from Southern Italy. Current Analytical Chemistry, 8, 283-299.
https://doi.org/10.2174/157341112800392571
[6] Savitzky, A. and Golay, M. (1964) Smoothing and Differentiation of Data by Simpli-fied Least Squares Procedures. Analytical Chemistry, 36, 1627-1639.
https://doi.org/10.1021/ac60214a047
[7] McBratney, A., Santos, M.L.M. and Minasny, B. (2003) On Digital Soil Mapping.
Geoderma, 117, 3-52.https://doi.org/10.1016/S0016-7061(03)00223-4
[8] Scull, P., Franklin, J., Chadwick, O. and McArthur, D. (2003) Predictive Soil Mapping: A Review. Progress in Physical Geography: Earth and Environment, 27, 171-197. https://doi.org/10.1191/0309133303pp366ra
[9] National Institude of Meteology (NIM). http://www.meteo.tn/default.html
[10] Regional Commissariat for Agriculture Development of Zaghouan.
http://cgdr.nat.tn/ar/index.php
[11] Chong, I.-G. and Jun, C.-H. (2005) Performance of Some Variable Selection Methods When Multicollinearity Is Present. Chemometrics and Intelligent Laboratory Systems, 78, 103-112. https://doi.org/10.1016/j.chemolab.2004.12.011
[12] Gosselin, R., Rodrigue, D. and Duchesne, C. (2010) A Bootstrap-VIP Approach for Selecting Wavelength Intervals in Spectral Imaging Application. Chemometrics and Intelligent Laboratory Systems, 100, 12-21.
https://doi.org/10.1016/j.chemolab.2009.09.005
[13] Lazraq, A., Cleroux, R. and Gauchi, J.-P. (2003) Selecting Both Latent and Explanatory Variables in the PLS1 Regression Model. Chemometrics and Intelligent Laboratory Systems, 66, 117-126.https://doi.org/10.1016/S0169-7439(03)00027-3