Development of a variable rate applicator for uniform fertilizer spreading
Cheol-woo Han
1,
Sang-yoon Lee
1,
Young-ki Hong
2,
Gi-young Kweon
1*(1. Department of Bio-Industrial Machinery Engineering (Institute of Agriculture and Life Science), Gyeongsang National University, Jinju 52828, Korea;2. Department of Agriculture Engineering, National Academy of Agricultural Science, RDA, Jeonju 54875, Korea)
Abstract: Environmental impact and economic concerns have driven a variable rate technology (VRT). Spinner spreaders were mainly used for granular fertilizer application since they are simple in design, inexpensive, and can cover large areas. However, the spreader was not adequate for VRT because uniformity changes drastically while varying application rates. Thus, the purpose of this study was to develop a variable rate applicator with uniform spreading patterns. A commercial spreader was modified with a controller and electric actuators for controlling fertilizer discharge directions and amounts. Database was established to determine the optimum discharge direction according to the fertilizer application amount. The uniformity of spreading patterns in accordance with the spread amount per set unit area was evaluated by the statistical coefficient of variation (CV) lower than 15% is assumed to prevent damage to the crop. Test results showed that CVs were 8%, 9%, and 8%, respectively, for a tractor in race track mode (adjacent passes in same direction of travel) at 200 kg/hm2, 300 kg/hm2, and 400 kg/hm2. This indicates that the fertilizer was spread uniformly, while the coefficient of variation was 12% at 200 kg/hm2 in back and forth mode (adjacent passes in the opposite direction of travel). Overall, the results suggest that the race track mode is suitable for operation of a tractor to ensure uniform spreading of fertilizer when applying at variable rates. The future goal is to establish a system for automatic variable rate application according to location in connection with soil analysis and geographic information systems.
Keywords: variable rate technology, fertilizer application, uniform spreading, spinner, granular applicator, fertilizer amount control
DOI: 10.25165/j.ijabe.20191202.3242
Citation: Han C-W, Lee S-Y, Hong Y-K, Kweon G-Y. Development of a variable rate applicator for uniform fertilizer spreading. Int J Agric & Biol Eng, 2019; 12(2): 82–89.
1 Introduction
In response to global environmental changes such as global warming and in an effort to reduce greenhouse gas emission and environmental pollution, the South Korean government has announced low-carbon green growth as its new national goal. In the domestic market, consumer preference for safe and high-quality agricultural products is increasing, resulting in a rapid expansion in the cultivation area for production of high-quality agricultural products. In this context, numerous studies have been conducted in the agricultural sector to address the issue of excessive use of chemical fertilizers and other agricultural materials. In a variable rate technology (VRT), uniform application of the fertilizer means that an amount of fertilizer is applied and there is uniformity in the application per unit area in a physical sense and application of fertilizer as much as a farmer or crops demand according to the growth stage of plants, soil, and environmental conditions in a biological sense. When uniform application is not achieved, the fertilizer is either excessively or insufficiently applied, leading to
Received date: 2017-01-31 Accepted date: 2018-09-13
Biographies: Cheol-woo Han, PhD candidate, research interest: precision
agriculture and vegetable planting technology, Email: [email protected];
Sang-yoon Lee, PhD candidate, research interest: precision agriculture and soil
sensing system, Email: [email protected]; Young-ki Hong, PhD, Researcher, research interest: precision agriculture and soil sensing system, Email: [email protected].
*Corresponding author: Giyoung Kweon, PhD, Associate Professor, research
interest: automation, variable rate technology and soil sensing system. Department of Bio-Industrial Machinery Engineering, Gyeongsang National University, 501 Jinju-daero, Jinju, 52828, South Korea. Cell: +82-10-8561- 4415, Office: +82-55-772-1898, Fax: +82-55-772-1899, Email: gkweon@ gnu.ac.kr.
waste of resources, damage to crops, and potential environmental damage[1].
Spinner spreaders are multi-purpose applicators that have advantages such as wide spreading, simple structure, reliability, affordable price level, high durability, and low maintenance costs[2].
However, they also possess a shortcoming in that uniform spreading of the fertilizer is not achieved[3,4]. In the U.S., VRT was defined by Illinois University in 1929 as the spreading of fertilizer at an adequate level by determining the amount of applied fertilizer according to the pH of soil[5]. Fulton et al.[6] investigated the relationship between rate and uniformity of a spinner spreader, and the result showed spread patterns were changed from a desirable Gaussian shape to undesirable M and W-shape at the low, medium and high application rates. Parish[7-9] reported spinner height, PTO speed, and flow rate affected on spread pattern uniformity. The effect of vane height on distribution pattern was also investigated for different flow rates[10]. Hofstee and Huisman[11] found the performance of a spreader and the quality of spread pattern depends mainly on the physical properties of the fertilizer such as particle size, coefficient of friction, coefficient of restitution, aerodynamic resistance, and particle strength. Pettersen et al.[12] also reported the influence of fertilizer particle size on the distribution for a twin-disc spreader. Previous research found the initial drop location of particles on the disc was one of the most sensitive factors affecting the spread pattern[10,13,14]. This finding rendered spreading pattern optimum for varying application rates by controlling the position of the feed gates[2].
produce high quality patterns at any application rate in simulations. From the previous study, a tendency of spreading patterns to move to the right side as the amount of fertilizer applied increases was reported[18]. In order to resolve this issue, an improvement was made to the existing spinner granular applicator, with new components such as a cylinder-type discharge direction control unit and a fertilizer amount control unit. Thus fertilizers could be released only through the intended discharges as shown in Figure 1, and thereby possibly solving the variation in spreading patterns caused by changes in the amount of fertilizer applied[18,19].
However, variable rate application with optimum uniformity for target fertilizer prescription (kg/hm2) at the operation site is not a simple process since tractor’s speed, which exerts influence on the amount of fertilizer (kg/min), should be considered.
The aims of this study were to investigate the relationship between parameters of a variable rate applicator such as spread amount per unit area (kg/hm2), tractor’s speed (km/h), and fertilizer feed rate (kg/min), to establish database to determine the optimum discharge direction according to the fertilizer application amount, and to investigate the uniformity of fertilizer spreading patterns.
a. Discharge location of –5° b. Discharge location of 0°
c. Discharge location of 5° d. Dischargelocation of 10°
Figure 1 Spread pattern variations in different discharge locations[18]
2 Materials and methods
2.1 Structure and working principle of a variable rate applicator
Figure 2 is a variable rate fertilizer applicator created by making modifications to a spinner granular applicator to support variable rate application. To the existing commercial spinner granular applicator (DP-2500N, Deapung, Changwon, Korea), two electric actuators with a potentiometer were installed and a controller
\
a. Control units for flow rate and discharge direction
b. Overall appearance Figure 2 Variable rate applicator with electric actuators for controlling amount of fertilizer and the direction of spreading[18]
was attached. This ultimately enabled the applicator to adjust the amount of fertilizer and the direction of spreading by a feed rate control unit and a discharge location control unit automatically[18].
Figure 3 shows the controller used in a test. The device components are as follows: a microcontroller (Arduino MEGA 2580, Arduino, Italy), used to receive the feedback values from the two electric actuators for discharge direction and fertilizer amount control; motor driver (VNH5019, Pololu, Las Vegas, NV, USA), used to control the actuators; GPS module (NEO-6M, Ublox, Switzerland), used to detect the location and speed; and CAN-BUS (Shield, Seeed Studio, CA, USA), used to communicate with a laptop system installed within the tractor and to present data such as the speed of the tractor, the level of openness, and the discharge location on the laptop system and the LCD.
operating angles in the previous study[18], to address spread pattern changes. Then, the feedback values of the actuators were measured and collated into a database in which the control expression for the discharge direction control was established.
a. Control block diagram
b. Control device
Figure 3 Control system for a variable rate applicator
a. Definition of discharge location b. Side view Figure 4 Discharge direction control unit[18]
To control the fertilizer amount, the control unit was built as shown in Figure 5 and the feedback values measured. The gate opening percentage gradually increased from 0% to 100% in increments of 10% in order to collate the feedback values from the actuator in use into the database, and the control expression was established.
Figure 5 Fertilizer amount control unit[18]
The rotation speed of a spinning disc was set to 540 r/min. The fertilizer was spread for 1 min and recovered to measure the weight. The amount of fertilizer applied per minute according to the gate opening percentage was collated into a database.
As for the control of variable rate application system, when the prescription (spread amount per unit area (kg/hm2)) was received from the system, the tractor’s speed (km/h) obtained from a GPS and the pre-entered swath width (m) data, which was set by an operator considering the total travel distance and optimum spreading uniformity, were multiplied to determine the spread amount per minute (kg/min) as shown Equation (1). In the equation, M (kg/min) indicates the spread amount per minute (flow rate), R (kg/hm2) the spread amount per unit area, S (km/h) the tractor’s speed, and W (m) the swath width of the applicator shown in Figure 6.
M = R·S·W/600 (1)
Figure 6 Determination of swath width
The gate opening percentage can be determined according to the flow rate while the discharge location is determined with the gate opening percentage. Thus, the fertilizer application control unit and the direction of the discharge direction control unit can be determined and controlled based on the database according to the amount of fertilizer applied. The flow chart of variable rate applicator operation is shown in Figure 7.
Figure 7 Flowchart of variable rate applicator operation
2.2 Performance test of the variable rate applicator
direction based on the tractor’s speed. The feedback values obtained from the two control units were then recorded. In the second experiment, investigation was performed on the rate and uniformity of a spinner type spreader using the ASAE 341.3 standard [20]. The tractor was operated with fertilizer application amount per unit area of 200 kg/hm2, 300 kg/hm2, and 400 kg/hm2 at a speed of 5 km/h and rotation speed of the spinning disc at 540 r/min to measure distribution uniformity. The ASAE 341.2 standard uses collection trays that are lined up perpendicularly to the line of travel of the vehicle as shown in Figure 8. After the spreading run, the mass collected in each tray is weighed and a simulated overlapped pattern is calculated. The collection tray has the size of 0.3 m (width) 0.35 m (length) 0.1 m (height) and 15 compartments in the study.
Figure 8 Analysis of a dynamic spreading pattern[18] In actual field operations, several consecutive passes are made with overlaps in either Back and Forth mode (adjacent passes in the opposite direction of travel) or RaceTrack mode (adjacent passes in same direction of travel) as shown in Figure 9.
a. Race track mode
b. Back and forth mode Figure 9 Tractor driving modes[3]
For a pattern test to predict field results, this overlapped pattern is computed by a computer program along with two important characteristics, the rate (kg/hm2) and the statistical coefficient of variation (CV) (%) both as functions of the swath width. The rate is essentially the mean of the overlapped pattern while the uniformity is quantified. CV is defined as the standard deviation divided by the mean as shown in Equations (2)-(4)[16].
10
s CV
a
(2)
where, s and a were defined in Equations (3) and (4).
2
1
1
( )
1 n
i i
s a a
n
(3)1
1 n
i i
a a
n
(4)where, s is standard deviation of sample weight for each collector location for the overlapped swaths; ai is accumulated sample weight for each collector location for the overlapped swaths; a is arithmetic mean of ai, and n is number of collector locations used.
Whether an overlapped pattern is “acceptable” depends on the value of CV at a certain swath width. A rule of thumb often used in aerial application is that a cv value lower than 15% is assumed not to cause damage to the crop[21]. This value is used throughout all analyses in this paper. To minimize the total travel distance, the operator will try to use the maximum swath width that results in a pattern of acceptable uniformity[16].
3 Results and discussion
3.1 Relationship between parameters of a variable rate applicator
From the test conducted to establish the database of the controller for the variable rate application system, the relational expression between the amount of fertilizer applied per minute and the fertilizer amount control unit was defined as in Equation (5), in which x represents the gate opening percentage (feed rate) (%) of the fertilizer amount control unit and M represents the amount of fertilizer spread per minute (kg/min):
x=0.9848M+3.3352 (5) The relational expression between the gate opening percentage of the fertilizer amount control unit and the voltage fed back from the actuator is shown in Equation (6), in which v1 represents the
value (volt) fed back from the actuator of the fertilizer amount control unit:
v1 =–0.0311x+4.1041 (6)
Once the spread amount per unit area (prescription) for variable rate application is entered, the fertilizer amount per minute is determined according to the tractor’s speed. Based on Equations (5) and (6), the relationship between prescription (kg/hm2), the tractor’s speed (km/h), and feed rate (%) is as shown in Figure 10.
Figure 10 Prescription and feed rate versus tractor velocity The relational expression for the rotation angle of the discharge location control unit and the voltage fed back from the actuator of the discharge location control unit is given by Equation (7), in which v2 represents the value (volt) fed back from the actuator and
unit:
v2=0.0576y+1.6746 (7)
Once the spread amount per minute is determined based on the spread amount per unit area and the tractor’s speed, the direction of the discharge direction control unit is determined accordingly. The relationship between the location of the discharge direction control unit and the gate opening percentage was found by experiment in Equation (8). In the equation, y represents the rotation angle (°) of the discharge location control unit and x
represents the gate opening percentage (%) of the fertilizer amount control unit:
y=–0.6x+18 (8) Based on Equations (7) and (8), the discharge location () and the gate opening percentage of the fertilizer application amount (feed rate) versus fertilizer amount per minute (flow rate) are shown in Figure 11.
The data on the amount of fertilizer applied per unit area were entered into the system and the data on the speed of the tractor were received through GPS to calculate the feedback values from the discharge direction control unit and the fertilizer amount control unit. The discharge direction control unit and the fertilizer amount control unit were controlled in real time using a microcontroller and a motor drive to ensure uniform spreading patterns according to the fertilizer prescription.
Figure 11 Feed rate and discharge location versus changes in flow rate
3.2 Results of performance test
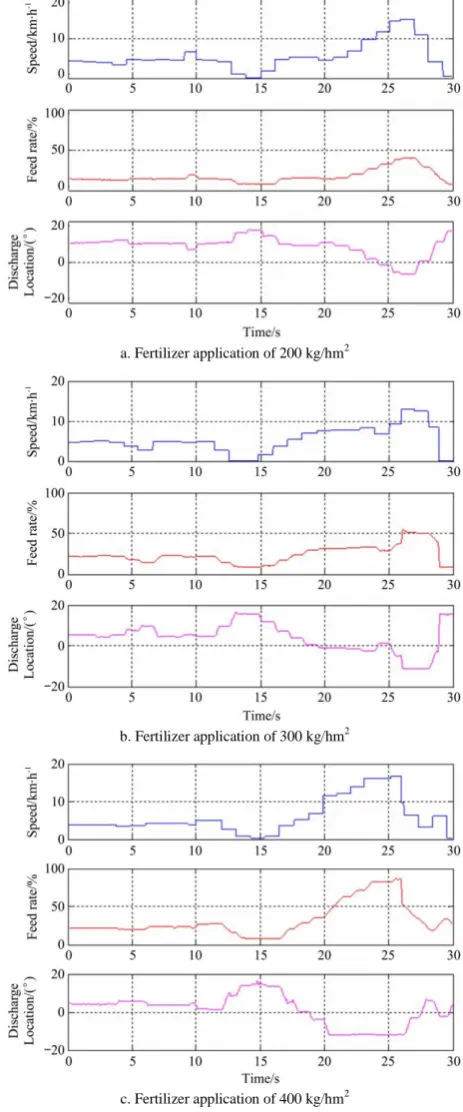
The tractor was operated in various speed with the fertilizer application amounts per unit area at 200 kg/hm2, 300 kg/hm2, and
400 kg/hm2 and feedback values from the fertilizer amount control unit and the discharge direction control unit received and calculated. The relationship between gate opening percentage and the location of the discharge direction unit are shown in Figure 12. As shown in the figure, the gate opening percentage and the discharge direction were controlled in the right manner with the changes in the tractor speed and the amount of fertilizer applied per unit area. The value of speed was observed as distinct discrete signal since it was updated at 1 Hz rate from GPS. Consequently, the GPS setting for a rapid update rate like 5 Hz was required in the future. As for the discharge direction, no further change was observed once the fertilizer application amount reached 80% or higher owing to a structural limitation of the control unit that prevented it from moving to –18° or lower. While the need for structural improvement of the device was recognized, it was judged that there was no relationship between the structural limitation and uniform spreading of the fertilizer as there is only a low possibility of the fertilizer amount controller opening the gate by 80% or more at the operation site.
a. Fertilizer application of 200 kg/hm2
b. Fertilizer application of 300 kg/hm2
c. Fertilizer application of 400 kg/hm2
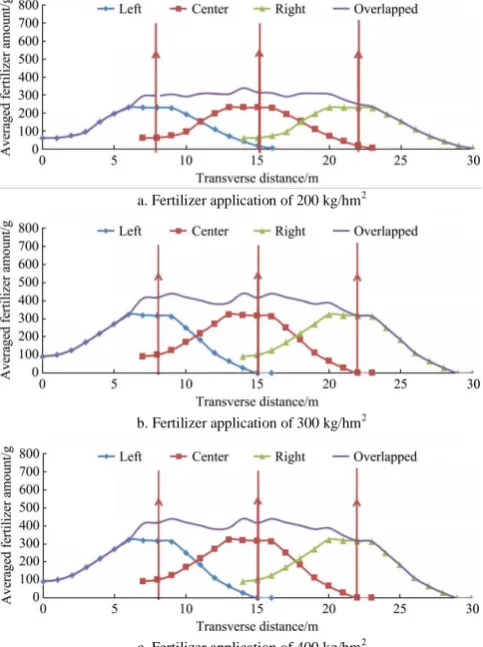
300 kg/hm2, or 400 kg/hm2 with the maximum spread width of 12 m. In back and forth mode, the CV exceeded 15% when the amount of fertilizer application per unit area was 300 kg/hm2 with spread width 7.5 m. On the basis of these findings, the spread width of 7.5 m was selected regardless of the driving mode as the CV did not exceed 15% and analytical graphs were plotted thereof. In the graphs, the resulting values from the performance test of the application system were used for overlapped patterns at the swath width of 7.5 m.
Figures 15 is analytical graphs; the three straight lines in the middle of the graphs indicating the driving direction of the tractor. As shown in the graphs, while the overlapped spreading patterns were observed to be uniform when the amount of fertilizer applied per unit area was 200 kg/hm2, the patterns showed a gradual increase in the amount of fertilizer applied on the right side as the amount of fertilizer applied per unit area increased. This is judged to be due to the fact that, as with the issue pointed out earlier, the level of increase in the fertilizer application amount on the right side of the spreading patterns was higher than that on the left side, with an increase in the amount of fertilizer applied. However, when the analytical graph data were subjected to calculation using a CV calculation formula, CV in Table 1 was obtained as the result. The graphs may seem to indicate that the fertilizer was spread non-uniformly. However, as the CV did not exceed 15%, it is judged that the fertilizer was spread uniformly for 8%-9% CV. The issue of having a higher level of increase in the fertilizer application amount on the right side compared to that on the left side in the spreading patterns as the fertilizer application amount increased has been resolved upon using the variable rate application system, and thereby allowing uniform spreading patterns.
a. Fertilizer application of 200 kg/hm2
b. Fertilizer application of 300 kg/hm2
c. Fertilizer application of 400 kg/hm2
Figure 13 Coefficients of variation (CV) versus spread widths and fertilizer application amount per unit area in race track mode
a. Fertilizer application of 200 kg/hm2
b. Fertilizer application of 300 kg/hm2
c. Fertilizer application of 400 kg/hm2
Figure 14 CV versus spread widths and fertilizer application amount per unit area in back and forth mode
a. Fertilizer application of 200 kg/hm2
b. Fertilizer application of 300 kg/hm2
c. Fertilizer application of 400 kg/hm2
Table 1 Analysis results of coefficients of variation of variable rate application system in race track mode
Fertilizer application amount/kg·hm-2
Spread width
(swath width)/m CV/%
200 7.5 8
300 7.5 9
400 7.5 8
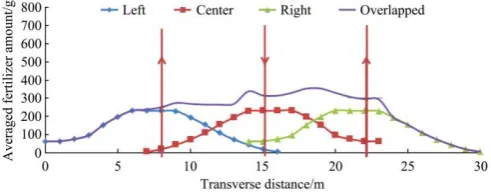
Figure 16 is an analytical graph showing the settings of the tractor’s driving mode as back and forth mode, the spread width as 7.5 m, and the amount of fertilizer applied per unit area as 200 kg/hm2. The overlapped spreading patterns were observed to
be less uniform compared to those in race track mode. This is judged to be due to the phenomenon in which the level of increase in the fertilizer application amount on the right side is higher than that on the left side in the spreading patterns as the fertilizer application amount increased. This repeats itself side to side in turn and results in imbalance by spreading more fertilizer on one side repeatedly and spreading less fertilizer on the other side accordingly. This consequently prevented uniform spreading of the fertilizer compared to race track mode, which repeats the same pattern. When CV was calculated, while the value was 12% and did not exceed 15%, suggesting that the fertilizer was spread uniformly, it was still higher than the value of 8% observed in race track mode, and thereby leading to a conclusion that race track mode is recommended for the driving mode of the tractor.
Figure 16 Analytical graph of 200 kg/hm2 of fertilizer application in back and forth mode
4 Conclusions
In this study, a discharge direction control unit and a fertilizer amount control unit with actuators that provide feedback were attached to a spinner granular applicator to create a variable rate application system. In addition, the values that were fed back according to the locations of the discharge direction control unit, the fertilizer amount control unit, and the amount of fertilizer applied per unit time according to the gate opening percentage of the fertilizer amount control unit were collated into a database to control the variable rate applicator. On the basis of the established database, a variable rate application system was developed and the amount of fertilizer applied was set to 200 kg/hm2, 300 kg/hm2, and 400 kg/hm2 and the performance of the system was evaluated. The evaluation results showed that the fertilizer application amount and the discharge direction were controlled in the right manner in accordance with the amount of fertilizer applied per unit area and the tractor’s speed. A simulation conducted on the relationship between the spread widths and CV based on the dynamic test result showed that the CV was 15% or below even with spread widths of 10 m or higher in race track mode, but exceeded 15% with a spread width of 7.5 m in back and forth mode. This has led to the conclusion that spread widths of 7.5 m or below is recommended for uniform spreading of
fertilizer by the application system. When an analytical graph was plotted with settings of spread width at 7.5 m, CV calculation showed that 8%, 9%, and 8% at 200 kg/hm2, 300 kg/hm2, and 400 kg/hm2 of fertilizer prescription, respectively in race track
mode, and 12% at 200 kg/hm2 in back and forth mode suggesting the system allowed a uniform spreading of fertilizer. In race track mode, the areas in which an insufficient amount of fertilizer was spread were supplemented by subsequent spreading by the tractor, and thereby allowed a uniform spreading of fertilizer. In back and forth mode however, a less uniform spreading of fertilizer was observed in comparison with race track mode as more fertilizer was spread on one side repeatedly and less fertilizer was spread on the other side accordingly. Therefore, it was concluded that the race track mode of a tractor and a spread width of 7.5 m are recommended for use in the variable rate application system. In the future, an automatic variable rate application system according to location will be developed in connection with a soil analysis system, geographical information system, etc.
Acknowledgements
This work was carried out with the support of the “Cooperative Research Program for Agriculture Science & Technology Development” (Project No. PJ01050303), Rural Development Administration, Republic of Korea.
[References]
[1] Helms R S, Siebenmorgen T J, Norman R J. The influence of uneven preflood nitrogen distribution on grain yields of rice. Arkansas farm research-Arkansas Agricultural Experiment Station (USA), 1987; 36(2): 9. [2] Kweon G, Grift T E. Feed gate adaptation of a spinner spreader for
uniformity control. Biosystems Engineering, 2006; 95: 19–34.
[3] Kweon G. Analysis and control of rate and uniformity for granular fertilizer application systems. Ph.D. Thesis. University of Illinois, Urbana, Illinois, 2006.
[4] Kweon G, Grift T E, Miclet D, Virin T, Piron E. Analysis and control of uniformity by the feed gate adaptation of a granular spreader. Journal of Biosystems Engineering, 2009; 34: 95–105.
[5] Sawyer J E. Concepts of variable rate technology with considerations for fertilizer application. Journal of Production Agriculture, 1994; 7(2): 195–201.
[6] Fulton J P, Shearer S A, Chabra G, Higgins S F. Performance assessment and model development of a variable-rate, spinner-disc fertilizer applicator. Trans of the ASAE, 2001; 44(5): 1071–1081.
[7] Parish R L. The effect of spreader fill level on delivery rate. Applied Engineering in Agriculture, 1999; 15(6): 647–648.
[8] Parish R L. Broadcast spreader pattern sensitivity to impeller/spout height and PTO speed. Applied Engineering in Agriculture, 2002a; 18(3): 297–299.
[9] Parish R L. Rate setting effects on fertilizer spreader distribution patterns. Applied Engineering in Agriculture, 2002b; 18(3): 301–304.
[10] Yildirim Y, Kara M. Effect of vane height on distribution uniformity in rotary fertilizer spreaders with different flow rates. Applied Engineering in Agriculture, 2003; 19(1): 19–23.
[11] Hofstee J W, Huisman W. Handling and spreading of fertilizers—part 1: physical properties of fertilizer in relation to particle motion. Journal of Agricultural Engineering Research, 1990; 47: 213–234.
[12] Pettersen J M, Svendsen J A, Ovland S. A method of studying the influence of fertilizer particle size on the distribution from a twin-disc spreader. Journal of Agricultural Engineering Research 1991; 50: 291-303.
[13] Olieslagers R, Ramon H, De Baerdemaeker J. Calculation of fertilizer distribution patterns from a spinning–disc spreader by means of simulation. Journal of Agricultural Engineering Research, 1996; 63(2): 137–152. [14] Dintwa E, Tijskens E, Olieslagers R, De Baerdemaeker J, Ramon H.
[15] Parish R L. A computer program for spread pattern analysis. Applied Engineering in Agriculture, 1987; 3(1): 14–16.
[16] Grift T E. Spread pattern analysis tool (SPAT)—part 1: development and theoretical examples. Trans of the ASAE, 2000; 43(6): 1341–1350. [17] Grift T E, Walker J T, Gardisser D R. Spread pattern analysis tool
(SPAT)—part 2: examples of aircraft pattern analysis. Trans of the ASAE, 2000; 43(6): 1351–1363.
[18] Han C W, Park H J, Lee S Y, Hong Y K, Lee D H, Kweon G. Pattern analysis of a single-disc granule spreader for uniform application of
fertilizer. J. Agric. Life Sci. 2015; 49(5): 321–332. (in Korean)
[19] Han C W, Hong Y K, Kim D C, Kweon G. Particle motion analysis on the disc of a granule fertilizer spreader for uniformity control. J. Agric. Life Sci. 2016; 50(5): 225–237. (In Korean)
[20] ASAE. Procedure for measuring distribution uniformity and calibrating granular broadcast spreaders. American Society of Agricultural Engineers Standards, 2004; S341.3: 198-201.
![Figure 1 Spread pattern variations in different discharge locations[18]](https://thumb-us.123doks.com/thumbv2/123dok_us/591538.2058404/2.595.85.513.191.511/figure-spread-pattern-variations-different-discharge-locations.webp)
![Figure 5 Fertilizer amount control unit[18]](https://thumb-us.123doks.com/thumbv2/123dok_us/591538.2058404/3.595.88.243.660.778/figure-fertilizer-amount-control-unit.webp)
![Figure 9 Tractor driving modesb. Back and forth mode [3]](https://thumb-us.123doks.com/thumbv2/123dok_us/591538.2058404/4.595.74.260.449.706/figure-tractor-driving-modesb-forth-mode.webp)