A R T I C L E
O p e n A c c e s s
Mutational processes contributing to the
development of multiple myeloma
Phuc H. Hoang
1,2, Alex J. Cornish
1, Sara E. Dobbins
1, Martin Kaiser
2and Richard S. Houlston
1,2Abstract
To gain insight into multiple myeloma (MM) tumorigenesis, we analyzed the mutational signatures in 874 whole-exome and 850 whole-genome data from the CoMMpass Study. We identified that coding and non-coding regions are differentially dominated by distinct single-nucleotide variant (SNV) mutational signatures, as well asfive de novo structural rearrangement signatures. Mutational signatures reflective of different principle mutational processes— aging, defective DNA repair, and apolipoprotein B editing complex (APOBEC)/activation-induced deaminase activity— characterize MM. These mutational signatures show evidence of subgroup specificity—APOBEC-attributed signatures associated withMAFtranslocation t(14;16) and t(14;20) MM; potentially DNA repair deficiency with t(11;14) and t(4;14); and aging with hyperdiploidy. Mutational signatures beyond that associated with APOBEC are independent of established prognostic markers and appear to have relevance to predicting high-risk MM.
Introduction
Cancers have variable numbers of somatic mutations that have accumulated during the life history of the tumors as a consequence of diverse cellular processes, including defective DNA replication or DNA repair, and exposure to endogenous or exogenous DNA-damaging agents1,2. Each of these processes results in mutational signatures, which serve as proxy for the cellular processes that have gone amiss. Mathematical deconvolution3 of these mutational signatures in large pan-cancer series has revealed multiple distinct signatures1, several of which are associated with known etiologies, but many remain unexplained1,4,5. Hence, studying the mutational sig-natures of cancers provides a mechanism for gaining insight into the etiological basis of tumor development.
Multiple myeloma (MM) is an incurable malignancy of plasma cells whose pathogenesis is only partially under-stood6. Approximately 40% of MM tumors harbor chro-mosome translocations leading to over-expression of
oncogenes (including CCND1, CCND3, MAF, MAFB,
WHSC1/MMSET, and FGFR3) through juxtaposition to the immunoglobulin heavy-chain locus6. Other tumors exhibit hyperdiploidy (HD), which is also considered to be an important initiating event6. Whole-exome sequencing (WES) and whole-genome sequencing (WGS) studies have so far identified over 40 driver genes that are recurrently altered in MM6–10. However, the molecular mechanisms giving rise to these mutations are yet to be fully elucidated.
Here we report a comprehensive analysis of the muta-tion signatures of over 800 MM genomes. We identify major mutational signatures in MM reflective of three known principle mutational processes: aging1,11,12, DNA repair deficiency1,12–17, and activation-induced deaminase (AID)/apolipoprotein B editing complex (APOBEC) activity (signature 2, 9, and 13)1,13,18,19. These mutational signatures show subgroup specificity and are reflective of the molecular mechanisms involved in tumorigenesis. Additionally, we show that information on mutational signatures beyond that associated with APOBEC has relevance to predicting patient prognosis and defining high-risk MM.
© The Author(s) 2019
Open AccessThis article is licensed under a Creative Commons Attribution 4.0 International License, which permits use, sharing, adaptation, distribution and reproduction in any medium or format, as long as you give appropriate credit to the original author(s) and the source, provide a link to the Creative Commons license, and indicate if changes were made. The images or other third party material in this article are included in the article’s Creative Commons license, unless indicated otherwise in a credit line to the material. If material is not included in the article’s Creative Commons license and your intended use is not permitted by statutory regulation or exceeds the permitted use, you will need to obtain permission directly from the copyright holder. To view a copy of this license, visithttp://creativecommons.org/licenses/by/4.0/.
Correspondence: Richard S. Houlston ([email protected])
1
Division of Genetics and Epidemiology, The Institute of Cancer Research, London, UK
2Division of Molecular Pathology, The Institute of Cancer Research, London, UK
1234567890()
:,;
1234567890(
):,;
1234567890()
:,;
1234567890(
Results
Genome sequencing of multiple myeloma
To examine the diversity of mutational signatures, we analyzed overlapping WGS and WES data on 850 and 874 MM tumor-normal pairs, respectively, generated by the Relating Clinical Outcomes in Multiple Myeloma to Personal Assessment of Genetic Profile Study (CoMM-pass, IA10 release). The frequency of the MM major subgroups—HD, t(11;14), t(4;14), t(14;16), t(14;20), and t (8;14)MYCtranslocation—is similar to other unselected series of patients who have been reported6 (Supplemen-tary Table 1). We used the high-coverage WES data (120–150×, 136,074 single-nucleotide variants [SNVs]) to analyze coding regions and the low-coverage WGS data (6–12×, 1,348,881 SNVs and 44,155 structural variants [SVs]) to provide genome-wide insights into clonal mutations associated with early processes underlying tumorigenesis7,20.
Mutational signatures in multiple myeloma
Application of non-negative matrix factorization
(NMF)11(Supplementary Fig. 1) to extract de novo SNV mutational signatures did not identify any novel muta-tional signatures (Supplementary Figs. 2 and 3), consistent with a recent analysis on CoMMpass exome dataset21. Overall, a total 9 of the 30 mutational signatures refer-enced by COSMIC (Catalog of Somatic Mutations in Cancer) were seen at >1% mutational contribution in the
WGS data (Supplementary Table 2); signature 1 related to aging1; 2 and 13 to activity of the APOBEC family of cytidine deaminases; 9 to polymerase η implicated with the activity of AID during somatic hypermutation1,18,19; signature 30 reflective of mismatch repair deficiency17; and signature 16 which has as yet an unknown etiology. We also extracted flat signatures 3, 5, and 8 in tumors -indicative of DNA repair deficiency (homolgous recom-bination deficiency and nucleotide repair deficiency)1,12–
16
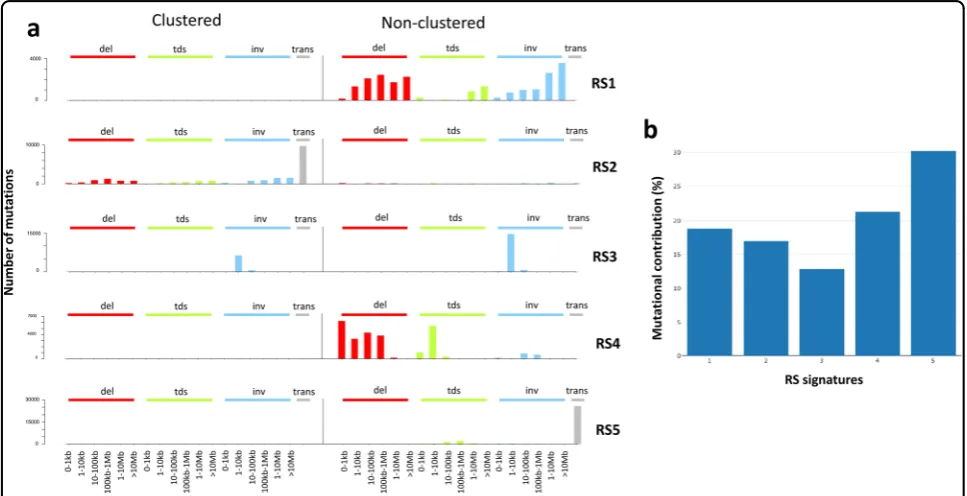
. In view of the potential ambiguous assignment of these three signatures22,23, we considered them collectively thereafter. We did however identify five novel de novo structural rearrangement signatures (RSs) (Fig. 1): RS1 (19% of SVs across samples)—characterized by non-clustered deletions, large-scale tandem duplications and inversions; RS2 (17%)—characterized by clustered trans-locations; RS3 (13%)—characterized by inversions; RS4 (21%)—characterized by non-clustered small-scale dele-tions and tandem duplicadele-tions; RS5 (30%)—characterized by non-clustered translocations. We therefore focused on
the nine major SNV and five de novo SV mutational
signatures for subsequent analyses.
Following on from this, we examined the contributions of the nine major COSMIC SNV mutational signatures in both WES and WGS datasets. The signature profiles recovered from the analysis of clonal WES and exome-restricted WGS data were highly correlated (r=1.00, Spearman’s correlation, Supplementary Fig. 4, Supplementary Table 3). Hence, while
Fig. 1 De novo structural rearrangements signatures. aFive de novo structural rearrangement signatures (RSs) extracted in multiple myeloma.b
the average sensitivity to detect clonal SNVs from the WGS data is 20–35%7, thesefindings indicate that the mutational signatures identified by WGS are valid and representative of early mutational processes in MM. We also observed a high concordance of mutational signature in WES data from CoMMpass and that reported by Walker et al.8 (r=0.86, Spearman’s correlation, Supplementary Fig. 5, Supplemen-tary Table 4), reflecting the generalizability of our observa-tions. No significant association between the major COSMIC SNV signatures and those associated with rearrangements was seen (Supplementary Table 5).
Influence of DNA replication and transcription on mutational signatures
The impact of DNA replication and transcription on mutational signatures was broadly consistent with observations previously made in the analyses of other
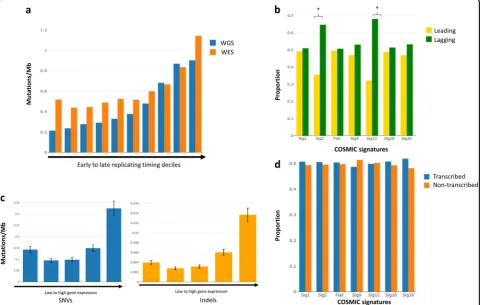
cancers11,12,24. Specifically, an overall increased mutation rate in late-replicating regions was shown (P< 1.0 × 10⁻⁴) (Fig. 2a, Supplementary Table 6), with the exception of signature 13 having higher mutation rate in early-replicating regions (P< 1.0 × 10⁻⁴, Supplementary Fig. 6, Supplementary Table 7), consistent with generalized replication time-dependent DNA damage mechanisms that operate in other cancers such as those of the breast12 and liver11. The difference in how replication timing influences mutation rates in signatures 2 and 13, which are both associated with APOBEC activity, suggests an intrinsically different mutational processes linked to DNA
replication consistent with the model previously
described12.
Similarly, as previously documented, strong replicative strand asymmetry (>30% imbalances)12 was shown with respect to signatures 2 (Q=4.0 × 10⁻¹⁶) and 13 (Q=
Fig. 2 Relationship between replication and transcription in mutational processes. aMutation rates across different DNA replication timing
4.0 × 10⁻¹⁶) with higher mutation in the lagging strand (Fig. 2b, Supplementary Table 8). These findings are consistent with APOBEC activity primarily affecting lag-ging strands.
Overall, increased mutation rate was associated with increased transcription, suggesting the mutagenic role of the transcriptional process in MM (Fig. 2c). This contrasts markedly to hepatocellular carcinoma11, sug-gesting that transcription-associated mutagenesis may
overwhelm transcription-coupled repair in MM25.
Moreover, strikingly elevated mutation rates of both SNVs and indels were shown for highly expressed genes (Fig.2c). A number of these highly expressed genes (i.e., FPKM (fragments per kilobase of exons per million reads) >100), which are also frequently mutated, including EGR126, XBP127, BTG228, DDX529, and
NFKBIA9 (Supplementary Table 9), have well-established roles in plasma cell differentiation and MM. The strong replicative, but weak transcriptional mutational asymmetry (Fig. 2d, Supplementary Table 10) seen in MM is consistent with the mutual exclusivity trend of replicative and transcriptional asymmetries shown in many cancers24.
Mutational signatures in coding and non-coding regions A significant difference in all mutational signatures within coding and non-coding regions was shown (Fig.3, Supplementary Table 11), implying different genomic regions are subject to specific mutational processes, consistent with earlier observations30. AID-attributed
signature 9 predominates in non-coding regions,
whereas exonic mutations are dominated by signatures 1, 2, and 13, implicating aging and APOBEC signatures as important.
Relationship between mutational signatures and kataegis Local hypermutated regions of tumor genomes, or kataegis, have been observed in MM9,31and other B cell malignancies1. We examined COSMIC mutational sig-natures contributing to kataegis (defined on the basis of average inter-mutation distance≤1 kb;3,32Supplementary Table 12a), which were detected in 9% of samples (71/ 874). We did not observe significant and consistent enrichment of COSMIC signatures at kataegis foci com-pared to other mutations in tumors with and without kataegis detected (Supplementary Table 12b). We iden-tified 70 genes disrupted by kataegis (Supplementary Table 13), including CCND1, CCND3, MAF, and FZD2, which are often affected by chromosomal rearrange-ments6,33. Globally, 62% of kataegis foci co-localize with 5% of somatic structural arrangement sites (Supplemen-tary Fig. 7), consistent with previous finding that most genomic rearrangements do not feature kataegis in nearby regions1.
Mutational signatures and myeloma subgroups
We observed significant association between specific
mutational signatures and MM subgroups (Table 1).
Signature 1 was enriched in HD MM (Q=3.2 × 10⁻⁴) consistent with the correlation between age and frequency of HD34 (Supplementary Table 14). APOBEC-attributed signatures 2 and 13 were enriched inMAF-translocation subgroups—t(14;16) (Q=1.7 × 10⁻¹⁵ and Q=3.5 × 10⁻¹⁹, respectively), t(14;20) (Q=1.4 × 10⁻³ and Q=
6.4 × 10⁻⁶, respectively)—and to a lesser extent in t(4;14) (only signature 2,Q=9.3 × 10⁻⁶) consistent with previous reports7,35. Flat COSMIC signatures, attributable to DNA repair deficiency, were enriched in t(11;14) MM (Q=
3.3 × 10⁻⁴) and t(4;14) MM (Q=0.033). We observed an enrichment of non-clustered deletions, large-scale tan-dem duplications, and inversions RS1 (Q=3.8 × 10⁻⁶); and clustered translocation RS2 (Q=0.010) signatures in t(4;14) MM (Supplementary Table 15). Although spec-ulative it is possible that the t(4;14) translocation, which leads to up-regulation of histone methyltransferase (MMSET), may affect genomic instability through some as yet undisclosed epigenetic mechanism.
We further explored the links between established prognostic mutational events (1p deletion, 1q gain, 17p deletion, andTP53mutations) with mutational signatures
(Supplementary Table 16). Associations between
chromosome-arm events at 1p and 1q with COSMIC signatures 2, 13, and RS1 (Q< 0.05) and between TP53
mutations tumors with RS1 (Q=0.033) and RS2 (Q=
7.4 × 10⁻³) raise the possibility of causal relationships.
Mutational signatures and driver genes
may explain the lower frequency of signature 2 mutations associated with driver genes. Signatures 1, 9, 16, 30, and the flat signatures were also associated with late-replicating regions (Supplementary Fig. 6, Supplemen-tary Table 7), but conversely were more frequently asso-ciated with driver gene mutations. To test if the enrichment of mutational processes in driver genes were due to positive selection of certain mutations, we exclu-ded all mutations that occurred at the exact same position in multiple tumors (46% of mutations) and repeated the analysis. Exclusion of recurrent mutations did not change the overall results, inferring that positive selection of specific mutations did not bias the analysis. We did not observe any significant transcriptional strand bias across mutational signatures (Fig. 2d), suggesting that the
differences in mutational contribution between driver genes and other exonic mutations are unlikely to be influenced by transcription.
Prognostic impact of mutational signatures
We next investigated the prognostic impact of muta-tional signatures using the prospective data from CoMMpass. The APOBEC signature has previously been reported to be associated with a worse patient out-come21,35. In this study after adjusting for age, sex, translocation status, chromosome-arm events, and TP53
status, no statistically significant association was shown, suggesting that APOBEC status does not represent an independent biomarker of patient outcome: progression-free survival (PFS: hazard ratio [HR]=2.45, 95%
con-fidence interval [CI]=0.94–6.37, P=0.066) and overall survival (OS: HR=2.81, 95% CI=0.96–10.10, P=0.10) (Supplementary Table 19). We next explored whether incorporating information on major SNVs and SV mutational signatures could further enhance the predic-tion of patient outcome after taking into account of established prognostic factors. Unsupervised hierarchical clustering provided evidence for seven distinct groups (A–G) associated with both PFS (log-rankP=3.4 × 10⁻⁴) and OS (log-rank P=0.011) (Fig. 4, Table 2, Supple-mentary Fig. 8), with group C being enriched for HD MM, group G is featuring tumors with 1p deletion, while group D being characterized by APOBEC mutation, enrichment for MAF-translocation subgroups, 1p deletion, and 1q gain (Supplementary Table 20). Post hoc delineation allowed us to stratify patients in seven groups into low-(A, B, C, and E) and high-risk groups (D, G, and F) (Supplementary Table 21). Classification of MM based on mutational signatures captured by these seven groups is independent prognosis factors (Supplementary Table 22). Notably, group F was independently associated with adverse prognosis (PFS: HR=1.95, 95% CI=1.35–2.81,
P=3.3 × 10⁻⁴; OS: HR=1.47, 95% CI=1.02–2.13,P=
0.039) (Supplementary Table 22), despite not being associated with the high-risk features of APOBEC, t (14;16)/t(14;20), 1p/1q/17p chromosome-arm events or
TP53 mutation status, but was typified by non-clustered structural rearrangements (Fig. 5a, Table 2, Supplemen-tary Fig. 8).
Discussion
Our analysis of over 800 myeloma genomes has afforded a global overview of the mutational processes in MM tumorigenesis. A major finding of this study is that a combination of signatures linked to aging, APOBEC/AID, and indicative DNA repair deficiency—account for around 80% of mutations in MM. Despite the difficulty of assigningflat signatures (3, 5, and 8)22,23, their detection of such profiles in large patient series supports the role of
Fig. 3Contribution of each single-nucleotide variant mutational
signature in coding (blue) and non-coding (orange) regions. Flat signatures include COSMIC signatures 3, 5, and 8
Table 1 Association of major myeloma subgroups and mutational signature (Q< 0.05)
Subgroup Signature enrichment Suggested etiologies
Hyperdiploidy Signature 1 Aging
t(11;14) Flat signatures Potentially DNA repair deficiency
t(4;14) Signatures 2, 30, andflat signatures
APOBEC and potentially DNA repair deficiency
t(14;16) Signatures 2 and 13 APOBEC
t(14;20) Signatures 2 and 13 APOBEC
MYC NA NA
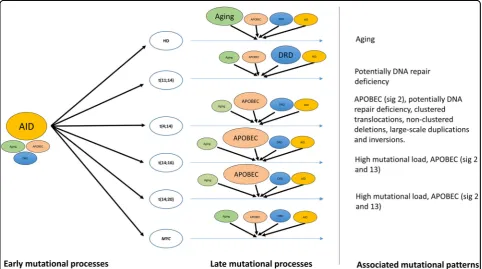
defective DNA repair in MM. By utilizing both WES and WGS data, we were able to extractfive novel structural RSs and identify differential prevalent mutational pro-cesses in coding (aging and APOBEC) and non-coding regions (AID), consistent with a previous report30. Our work supports previous findings30 in implying an early role for AID in shaping the MM mutational landscape. We also identified new and validated previously reported subgroup associations with mutational signatures, allow-ing further categorization of MM beyond simple trans-location status and providing additional insight in the etiological processes implicated in tumorigenesis (Fig.6).
Mutations do not occur uniformly over the genome and local mutation rates are modulated by replication, tran-scription, and chromatin organization12. We observed an enrichment of somatic mutations in late-replicating regions, as seen across several cancers36, and highly expressed regions. Previous analyses, which have sought to establish the mutational profile of myeloma genomes, have been based on data solely from exome sequencing projects. Here we have sought to provide a more com-prehensive analysis; however, we acknowledge that the low coverage of CoMMpass WGS raises the possibility that we may have underestimated the global mutation
Fig. 4 Mutational signatures associated with driver genes. aCumulative mutational contribution of mutational signatures across 50 multiple
myeloma (MM) driver genes7–10(blue, 1679 mutations in total) and other exonic mutations (orange).bNormalized cumulative mutational
contribution of signatures with top ten contribution for most frequently mutated MM driver genes (+) vs. other mutations (−) in tumors with the corresponding driver gene being mutated:KRAS(n=247),NRAS(n=204),DIS3(n=104),TRAF3(n=83),CCND1(n=78),BRAF(n=70),FAM46C(n =70),EGR1(n=65),TP53(n=52),SP140(n=30),PRDM1(n=26), andATM(n=19);n: number of mutations. Flat signatures include COSMIC signatures 3, 5, and 8
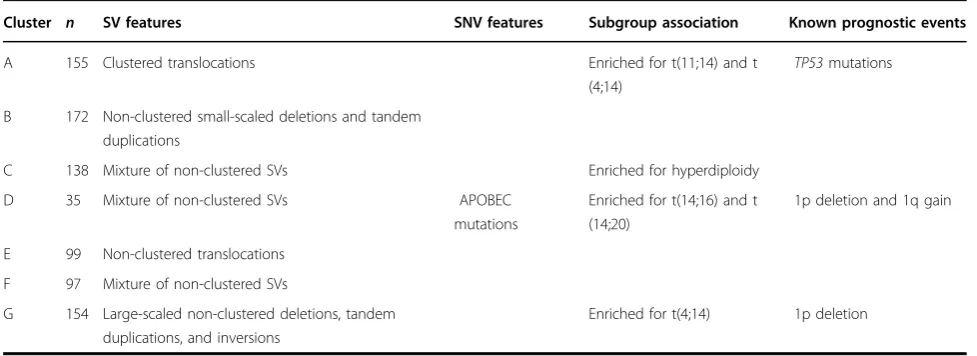
Table 2 Summary of characteristics of the seven cluster subgroups
Cluster n SV features SNV features Subgroup association Known prognostic events
A 155 Clustered translocations Enriched for t(11;14) and t
(4;14)
TP53mutations
B 172 Non-clustered small-scaled deletions and tandem duplications
C 138 Mixture of non-clustered SVs Enriched for hyperdiploidy
D 35 Mixture of non-clustered SVs APOBEC
mutations
Enriched for t(14;16) and t (14;20)
1p deletion and 1q gain
E 99 Non-clustered translocations
F 97 Mixture of non-clustered SVs
G 154 Large-scaled non-clustered deletions, tandem duplications, and inversions
Enriched for t(4;14) 1p deletion
rate. The strong replicative asymmetry observed is con-sistent with mutations in MM being predominantly associated with APOBEC family of mutations24. In addi-tion, we identified that coding drivers are likely to be originated from a number of mutational processes, including aging and DNA repair deficiency. In contrast, while APOBEC enzymes appear to act more ubiquitously within coding regions, they do not specifically affect coding drivers.
The different MM translocation subgroups showed striking differences in their mutational signatures, refl ec-tive of the cellular processes driving respecec-tive clonal expansions (Fig.6). As previously reported, t(14;16) and t (14;20) MM were enriched with APOBEC signatures 2 and 137,35. This is a consequence of the over-expression of APOBEC genes, specificallyAPOBEC3AandAPOBEC3B, mediated through the over-expression of MAF tran-scription factors35. The t(4;14) subgroup was also enri-ched with APOBEC mutational patterns, although only for signature 2 and, to a lesser extent, as compared to
MAF-translocation subgroups. Since signatures 2 and 13 are reflective of different mutational processes12, we speculate that the mutational processes associated with t (4;14) are likely to be different from those with MAF
-translocation subgroups. In contrast, signatures indicative of DNA repair deficiency were associated with t(11;14) and t(4;14) and aging with HD. DNA breaks unsuccess-fully repaired due to defective DNA repair may facilitate the generation of chromosomal translocations37. Because of theflat structure of signatures 3, 5, and 8 robust insight into etiological contribution of DNA repair deficiency to MM tumorigenesis requires assiduous signature fitting and adjustment for confounding covariates23. The mole-cular mechanisms responsible for initiating HD in MM are unknown. However, by inference from childhood acute lymphoblastic leukemia38, it is likely it is a con-sequence of the simultaneous gain of chromosomes in a single abnormal cell division. Cells failing to execute programmed cell death in response to mitotic failure are likely to divide asymmetrically, resulting in the generation of aneuploidy cells39. The association between aging with increased cell division errors40and decreased apoptosis41 further supports a relationship between HD MM and aging. Signatures defined by large-scale structural aber-rations were associated to varying degrees with MM subgroups, but clustered translocations and non-clustered deletions, large-scale tandem duplications, and inversions showed a significant association in t(4;14) MM.
Fig. 5 Integrative clusters based on mutational signatures and patient prognosis. aHeatmap showing proportions of rearrangement
The APOBEC mutational signatures are inextricably linked to a high mutation load7,35and the adverse t(14;16) and t(14;20)MAF-translocation subgroups. We show that molecular classification based solely on APOBEC sig-natures do not fully differentiate the underlying genomic complexity in MM relevant to predicting patient out-come. Hence, while APOBEC activity is an adverse prognostic factor in MM21,35, using it as a sole classifier does not fully capture high-risk MM, which with geneti-cally unstable genome is typified by complex structural variants. Our findings support the need for considering other mutational signatures to refine prediction of patient prognosis.
Our study does, however, suggest that analysis of APOBEC activity together with other molecular features at diagnosis should allow for the identification of high-risk
MM patients that may benefit from more intensive
treatment. Collectively, these data shed new light on the diversity of cellular processes generating somatic muta-tions in MM. Moreover, they provide a strong rationale for integration of mutational signatures data in conven-tional molecular profiling of patient tumors to tailor therapy.
Materials and methods Samples and datasets
All data analyzed were generated as part of the Multiple Myeloma Research Foundation (MMRF) CoMMpass Study (release IA10). WGS data on 850 matched tumor-normal baseline newly diagnosed bone marrow samples were downloaded from the database of Genotype and Phenotype (dbGaP). Matched tumor RNAseq processed by HTseq were used for gene expression analysis. WES variants (detected by at least two out of three variant callers—MuTect, Seurat, and Strelka) from 874 samples, RNAseq, copy number variation (CNV), clinical data, and sequencing-based fluorescent in situ hybridization (Seq-FISH) data (MMRF IA10 dataset) were downloaded from MMRF web portal (https://research.themmrf.org/). WES and WGS data were available for 824 samples.
Somatic mutation calling
Calling of somatic mutations was performed as descri-bed previously7. Briefly, raw WGS sequencing data were quality checked using FastQC (v.0.11.4) and aligned using the Burrows-Wheeler Alignment tool42(BWA v0.7.12) to the human genome hg19/GRCh37 assembly. SNV
Fig. 6 Contribution of major mutational processes operative in multiple myeloma.This model represents differential contribution of various
mutations were called using MuTect43(v1.1.7) according to best practices, utilizing data from dbSNP v147 and COSMIC non-coding variants v7744. Mutations were then
filtered for oxidation artifacts45 and by quality score as described previously7. Mutations mapping to immune hypermutated regions (429 immunoglobulin and the major histocompatibility complex loci, each region extended by 50 kb, as defined in Ensembl v73)46 were excluded to avoid bias from mutation as a consequence of normal B cell development.
Determination of myeloma karyotype
Translocation status of MM tumors was based on Seq-FISH47. HD was defined as amplification of 90% of the chromosome in at least two autosomes7. Prognostic chromosome-arm events (>1 Mb) were defined as deleted or amplified with abs(log2 ratio) ≥0.1613 occurring at 1p12, 1p32.3, 1q21.1, 1q23.3, and 17p136.
Mutational signatures
Characterization of the 30 COSMIC mutational sig-natures (http://cancer.sanger.ac.uk/cosmic/signatures) and de novo extraction of signatures was performed using Palimpsest11,48with default parameters. We compared de novo mutational signatures with 30 pre-defined COSMIC signatures by computing their cosine similarities1. A de novo mutational signature was assigned to a COSMIC signature if the cosine similarity was >0.75 as previously advocated11. If multiple COSMIC signatures passed this threshold, then the most similar COSMIC signature was assigned to the de novo signature. We compared pro-portion COSMIC mutational signatures between high-coverage WES clonal mutations (alternate allele ratio >0.9) and low-coverage WGS mutations restricted to exome regions, as well as between CoMMpass exome and Walker et al.8exome mutations. Correlations were tested using Spearman’s correlation. For those signatures with an apparentflat profile we considered these in concert, by combining the respective contributions of signatures 3, 5, and 8.
We used MANTA to identify somatic SVs from the WGS data adopting default settings49. We applied the same statistical framework used for signature analysis of SVs implemented in Palimpsest48to extract de novo RSs as previously described11. Correlations between SV sig-natures and major COSMIC pre-defined SNV signatures (>1% mutational contribution in WGS) were tested using Spearman’s correlation. No significant correlation was seen after adjusting for multiple testing (i.e.,Q> 0.05).
We examined the relationship between mutational sig-natures and clinico-pathological parameters confining our analysis to the major MM subgroups—HD, t(4;14), t(11;14), t(14;16), t(14;20), and t(8;14) MYC. Test of association between each signature and subgroups was based on a
two-tailed Fisher’s exact test using Benjamini–Hochberg false discovery rate procedure to address multiple testing.
We compared contribution of each mutational sig-nature to coding and non-coding regions using WGS data. To calculate contribution of a mutational signature to a genomic region, we first estimated the probability that each mutation was due to the process underlying each signature and calculated the cumulative probability of all mutations in each region, as per Letouze et al.11. After computing these probabilities, regional differences in trinucleotide composition were accounted for when comparing the contribution of mutational signatures between two genomic regions (regions X and Y). Such normalization was conducted by changing the number of mutations from each mutational category in region X to that expected if the trinucleotide composition of regionX
was identical to the trinucleotide composition of regionY, assuming a constant rate of mutation at positions of each trinucleotide context. The normalized number of muta-tionsUnormC;X of categoryCin region Xwas calculated as:
UnormC;X ¼UC;XV C;YWX
VC;XWY;
where UC,X is the number of mutations of category C
observed in regionX,VC,Xis the number of positions at which a mutation of categoryCcan occur in regionX, and
WXis the size of regionX(in base pairs). AsUC;X normis not
necessarily an integer, it is rounded to the closest integer before comparisons are completed. Mutation numbers were normalized within each tumor. Since small numbers of mutations may impact on normalization, in each comparison the larger region was designated as regionX, the smaller region designated as regionY.
Replication timing and replication strand bias
We used replication sequencing (Repli-seq) data gen-erated by the ENCODE consortium for the lymphoblast cell lines GM12878, GM06990, GM12801, GM12812, and GM12813 to define early- and late-replicating regions, as well as leading and lagging DNA strands using Repli-seq signal peaks from GM12801 as previously described11,12. Mutation rates across deciles of replication timings were estimated globally using WGS data and for each signature, with each mutation assigned to a single signature by Palimpsest11,48. The replication timing slope was esti-mated by linear regression model. To test the null hypothesis that the slope gradients equal zero, the repli-cation timing deciles were permuted 10,000 times. Empirical P values were calculated as the fraction of permutations with absolute slope values at least as great as the absolute slope value computed using the true replication timing deciles.
COSMIC signatures as previously described11, using WGS data. The Wilcoxon’s rank-sum test was used to determine significant difference of mutational contribu-tion from each COSMIC signature between leading and lagging strands. Levels of asymmetry were considered significant if strand imbalances were >30%12andQ< 0.05.
Transcriptional levels and transcriptional strand bias To correlate mutational processes with gene expression,
RNAseq data were normalized to FPKM11. For each
tumor, genes were partitioned into pentiles based on respective FPKM. Immunoglobulin-related genes and genes known to be highly upregulated in MM as a result of translocations (CCND1, CCND3, FGFR3, MMSET,
MAF, MAFB, and MYC)6 were excluded to mitigate
against bias. Mutation rates of genes within each of the
five transcriptional level categories were estimated per tumor based on WES called mutations. Average align-ability score for highly expressed genes was based on
alignability of 75mers defined by the ENCODE/CRG
GEM mappability tool50. We examined mutation rates on transcribed and non-transcribed strands globally and for each signature as described previously11 using Palimp-sest11,48. Wilcoxon’s rank-sum tests, corrected for multi-ple testing, were used to determine significant difference of mutational contribution from each COSMIC signature between transcribed and non-transcribed strands. Levels of asymmetry were again considered significant if strand imbalances were >30%12andQ< 0.05.
Kataegis
We restricted our kataegis analysis to high-coverage WES data, where we have sufficient coverage to detect local hypermutation. Kataegis foci were defined as having six or more consecutive mutations with an average mutational distance≤1 kb, as previously described3,32. Co-localization of kataegis and structural rearrangements was assessed based on the proportion of SV regions having kataegis foci residing within 10 kb. To examine enrich-ment of a mutational signature at kataegis regions, we compared mutational contribution of each signature across all mutations at kataegis foci with other mutations in tumors with and without kataegis being detected using Wilcoxon’s rank-sum test, corrected for multiple testing and imposed a threshold ofQ< 0.05.
Association of mutational signatures with the mutation of driver genes
For SNV mutational signatures, Wilcoxon’s rank-sum tests were used to compare contribution of each muta-tional signature in coding drivers7–10 and other exonic mutations, with normalizing for trinucleotide composi-tion as described above. For each somatic mutacomposi-tion, we estimated the probability that it was the result of each
mutational process considering the trinucleotide context and the number of mutations attributed to each process in the respective tumor as per Letouze et al.11. We then compared, for each driver gene and mutational signature, the probability distribution in mutations affecting the driver gene as compared to all other mutations in tumors with and without the driver gene mutated using Wilcox-on’s rank-sum tests, imposing Benjamini–Hochberg cor-rection for multiple testing. We evaluated all driver genes identified in previous studies7–10withQ< 0.05.
Association of signatures with clinical features
Multivariate Cox regression was performed to adjust for covariates, including age at diagnosis, sex, translocation status, and APOBEC mutational contribution (COSMIC signatures 2 and 13). We used the ConsensusClusterPlus R package51to hierarchically cluster patients based on de novo SV and major COSMIC SNV signatures (>1% con-tribution) extracted from WGS with default settings32. Fisher’s exact test was used to test whether clusters were associated with MM subgroups or driver gene mutations, imposing Benjamini–Hochberg correction for multiple testing. The log-rank test was used to assess the differ-ences in PFS and OS between all cluster groups. To delineate clusters into low- and high-risk groups, pairwise comparisons in survival distributions were performed using the pairwise_survdiff function implemented in the survminer R package33.
Multivariate Cox regression was performed for each subgroup vs. other subgroups, adjusting for age at diag-nosis, sex, translocation status, APOBEC contribution, 1p
deletion, 1q gain, 17p deletion, and TP53
non-synonymous mutations.
Acknowledgements
This work was supported by grants from Myeloma UK, Bloodwise, and Cancer Research UK (C1298/A8362). These data were generated as part of the Multiple Myeloma Research Foundation Personalized Medicine Initiatives (https:// research.themmrf.organdwww.themmrf.org).
Authors’contributions
P.H.H., S.E.D., and R.S.H. conceived and designed the study; P.H.H performed bioinformatics with contribution from A.J.C. and S.E.D.; P.H.H. and R.S.H wrote the manuscript with contributions from S.E.D, A.J.C., and M.K. All authors reviewed thefinal manuscript.
Data availability
WGS and WES raw fastq data were obtained from dbGaP under the study accession code phs000748.v4.p3. WES somatic variants, RNAseq, CNV, Seq-FISH, and clinical data were obtained from MMRF IA10 (https://research. themmrf.org/). Replication timing data were downloaded from the UCSC Genome Browser (http://hgdownload.cse.ucsc.edu/goldenPath/hg19/ encodeDCC/wgEncodeUwRepliSeq/).
Conflict of interest
Publisher’s note
Springer Nature remains neutral with regard to jurisdictional claims in published maps and institutional affiliations.
Supplementary Informationaccompanies this paper at (https://doi.org/
10.1038/s41408-019-0221-9).
Received: 14 January 2019 Revised: 26 April 2019 Accepted: 8 May 2019
References
1. Alexandrov, L. B. et al. Signatures of mutational processes in human cancer. Nature500, 415–421 (2013).
2. Helleday, T., Eshtad, S. & Nik-Zainal, S. Mechanisms underlying mutational signatures in human cancers.Nat. Rev. Genet.15, 585–598 (2014). 3. Alexandrov, L. B., Nik-Zainal, S., Wedge, D. C., Campbell, P. J. & Stratton, M. R.
Deciphering signatures of mutational processes operative in human cancer. Cell Rep.3, 246–259 (2013).
4. Alexandrov, L. B. et al. Mutational signatures associated with tobacco smoking in human cancer.Science354, 618–622 (2016).
5. Pfeifer, G. P. Environmental exposures and mutational patterns of cancer genomes.Genome Med.2, 54 (2010).
6. Manier, S. et al. Genomic complexity of multiple myeloma and its clinical implications.Nat. Rev. Clin. Oncol.14, 100–113 (2017).
7. Hoang, P. H. et al. Whole-genome sequencing of multiple myeloma reveals oncogenic pathways are targeted somatically through multiple mechanisms. Leukemia32, 2459–2470 (2018).
8. Walker, B. A. et al. Mutational spectrum, copy number changes, and outcome: results of a sequencing study of patients with newly diagnosed myeloma.J. Clin. Oncol.33, 3911–3920 (2015).
9. Bolli, N. et al. Heterogeneity of genomic evolution and mutational profiles in multiple myeloma.Nat. Commun.5, 2997 (2014).
10. Lohr, J. G. et al. Widespread genetic heterogeneity in multiple myeloma: implications for targeted therapy.Cancer Cell25, 91–101 (2014).
11. Letouze, E. et al. Mutational signatures reveal the dynamic interplay of risk factors and cellular processes during liver tumorigenesis.Nat. Commun.8, 1315 (2017).
12. Morganella, S. et al. The topography of mutational processes in breast cancer genomes.Nat. Commun.7, 11383 (2016).
13. Nik-Zainal, S. et al. Mutational processes molding the genomes of 21 breast cancers.Cell149, 979–993 (2012).
14. Zou, X. et al. Validating the concept of mutational signatures with isogenic cell models.Nat. Commun.9, 1744 (2018).
15. Kim, J. et al. Somatic ERCC2 mutations are associated with a distinct genomic signature in urothelial tumors.Nat. Genet.48, 600–606 (2016).
16. Jager, M. et al. Deficiency of nucleotide excision repair is associated with mutational signature observed in cancer.Genome Res. 29, 1067–1077 (2019).
17. Drost, J. et al. Use of CRISPR-modified human stem cell organoids to study the origin of mutational signatures in cancer.Science358, 234–238 (2017). 18. Di Noia, J. M. & Neuberger, M. S. Molecular mechanisms of antibody somatic
hypermutation.Annu. Rev. Biochem.76, 1–22 (2007).
19. Puente, X. S. et al. Non-coding recurrent mutations in chronic lymphocytic leukaemia.Nature526, 519–524 (2015).
20. Griffith, M. et al. Optimizing cancer genome sequencing and analysis.Cell Syst. 1, 210–223 (2015).
21. Maura, F. et al. Biological and prognostic impact of APOBEC-induced muta-tions in the spectrum of plasma cell dyscrasias and multiple myeloma cell lines.Leukemia32, 1044–1048 (2018).
22. Rosenthal, R., McGranahan, N., Herrero, J., Taylor, B. S., Swanton, C. Decon-structSigs: delineating mutational processes in single tumors distinguishes DNA repair deficiencies and patterns of carcinoma evolution.Genome Biol.17, 31 (2016).
23. Maura, F. et al. A practical guide for mutational signature analysis in hema-tological malignancies.Nat. Commun.10, 2969 (2019).
24. Haradhvala, N. J. et al. Mutational strand asymmetries in cancer genomes reveal mechanisms of DNA damage and repair.Cell164, 538–549 (2016). 25. Park, C., Qian, W. & Zhang, J. Genomic evidence for elevated mutation rates in
highly expressed genes.EMBO Rep.13, 1123–1129 (2012).
26. Chen, L. et al. Identification of early growth response protein 1 (EGR-1) as a novel target for JUN-induced apoptosis in multiple myeloma. Blood115, 61–70 (2010).
27. Reimold, A. M. et al. Plasma cell differentiation requires the transcription factor XBP-1.Nature412, 300–307 (2001).
28. Leone, E. et al. Targeting miR-21 inhibits in vitro and in vivo multiple myeloma cell growth.Clin. Cancer Res.19, 2096–2106 (2013).
29. Felix, R. S. et al. SAGE analysis highlights the importance of p53csv, ddx5, mapkapk2 and ranbp2 to multiple myeloma tumorigenesis.Cancer Lett.278, 41–48 (2009).
30. Maura, F. et al. Analysis of mutational signatures suggest that aid has an early and driver role in multiple myeloma.Blood128, 116–116 (2016).
31. Ashby, C. C. et al. Whole genome sequencing reveals the extent of structural variants in multiple myeloma and identifies recurrent mutational hotspots within the non-coding regions.Blood130(Suppl. 1), 3032–3032 (2017). 32. Nik-Zainal, S. et al. Landscape of somatic mutations in 560 breast cancer
whole-genome sequences.Nature534, 47–54 (2016).
33. Zhan, F. et al. The molecular classification of multiple myeloma.Blood108, 2020–2028 (2006).
34. Ross, F. M. et al. Age has a profound effect on the incidence and significance of chromosome abnormalities in myeloma.Leukemia19, 1634 (2005). 35. Walker, B. A. et al. APOBEC family mutational signatures are associated with
poor prognosis translocations in multiple myeloma.Nat. Commun.6, 6997 (2015).
36. Stamatoyannopoulos, J. A. et al. Human mutation rate associated with DNA replication timing.Nat. Genet.41, 393–395 (2009).
37. Nambiar, M. & Raghavan, S. C. How does DNA break during chromosomal translocations?Nucleic Acids Res.39, 5813–5825 (2011).
38. Onodera, N., McCabe, N. R. & Rubin, C. M. Formation of a hyperdiploid kar-yotype in childhood acute lymphoblastic leukemia.Blood80, 203–208 (1992). 39. Castedo, M. et al. Cell death by mitotic catastrophe: a molecular definition.
Oncogene23, 2825–2837 (2004).
40. Ly, D. H., Lockhart, D. J., Lerner, R. A. & Schultz, P. G. Mitotic misregulation and human aging.Science287, 2486–2492 (2000).
41. Tower, J. Programmed cell death in aging.Ageing Res. Rev.23(Part A), 90–100 (2015).
42. Langmead, B., Trapnell, C., Pop, M. & Salzberg, S. L. Ultrafast and memory-efficient alignment of short DNA sequences to the human genome.Genome Biol.10, R25 (2009).
43. Cibulskis, K. et al. Sensitive detection of somatic point mutations in impure and heterogeneous cancer samples.Nat. Biotechnol.31, 213–219 (2013). 44. Forbes, S. A. et al. COSMIC: exploring the world’s knowledge of somatic
mutations in human cancer.Nucleic Acids Res.43, D805–D811 (2015). 45. Costello, M. et al. Discovery and characterization of artifactual mutations in
deep coverage targeted capture sequencing data due to oxidative DNA damage during sample preparation.Nucleic Acids Res.41, e67 (2013). 46. Weinhold, N., Jacobsen, A., Schultz, N., Sander, C. & Lee, W. Genome-wide
analysis of noncoding regulatory mutations in cancer. Nat. Genet. 46, 1160–1165 (2014).
47. Miller, C. et al. A comparison of clinical FISH and sequencing based FISH estimates in multiple myeloma: an Mmrf commpass analysis.Blood 128, 374–374 (2016).
48. Shinde, J. et al. Palimpsest: an R package for studying mutational and struc-tural variant signatures along clonal evolution in cancer.Bioinformatics34, 3380–3381 (2018).
49. Chen, X. et al. Manta: rapid detection of structural variants and indels for germline and cancer sequencing applications.Bioinformatics32, 1220–1222 (2016).
50. Derrien, T. et al. Fast computation and applications of genome mappability. PLoS ONE7, e30377 (2012).