Effect of moisture content on some engineering properties of
groundnut pods and kernels
Muhammad, Aliyu Idris
*, Ahmad, Rabi Kabir, Lawan, Ibrahim
(Department of Agricultural and Environmental Engineering, Faculty of Engineering, Bayero University, Kano P.M.B. 3011, Gwarzo road, Kano-Nigeria)
Abstract: Effect of moisture content on some engineering properties of groundnut pods and kernels were investigated. Two
groundnut varieties were used namely: Manipintar and Ex-Dakar. The properties investigated were principal dimensions, porosity, bulk density, true density, angle of repose and static coefficient of friction as dependent variables while moisture content is the independent variable. At an increasing moisture content of 7.3%-25.2% d.b., the mean length, thickness, width, geometric mean diameter, arithmetic mean diameter and surface area for Ex-Dakar pods were 30.6-33.46, 12.55-14.89, 12.8- 14.03, 16.88-18.71, 18.61-20.75 mm and 904.86-1099.73 cm2, respectively. The corresponding mean values for the Manipintar pods were 18.60-30.89, 11.62-15.01, 11.72-14.05, 13.63-18.68, 13.98-19.98 mm and 583.78-1095.80 cm2, respectively. However, for Ex-Dakar kernels, the mean length, thickness, width, geometric mean diameter, arithmetic mean diameter and surface area recorded within moisture range of 8.5%-28.1% were 12.92-13.01, 8.81-9.35, 10.73-11.71, 10.72-11.14, 10.82-11.36 mm and 360.96-389.68 cm2, respectively. Similarly, mean values for the Manipintar kernels were 18.60-30.89, 11.62-15.01, 11.72-14.05, 8.97-11.03, 9.19-11.38 mm, and 252.89-382.16 cm2, respectively. The porosity for Ex-Dakar pods increased from 30.23%-61.77% and from 11.65%-18.63% for the kernels, from 31.37%-59.41% and 11.65%-33.82% for Manipintar pods and kernels. True density increased from 0.35-0.72 and 0.84-1.13 g cm-3 for Ex-Dakar pods and kernels, from 0.39-0.62 and 0.98-1.29 g cm-3 for Manipintar pods and kernels. However, the bulk density showed a decrease from 0.33-0.24 and 0.92-0.55 g cm-3 for Ex-Dakar pods and kernels, and from 0.53-0.21 and 1.12-0.75 g cm-3 for Manipintar pods and kernels. Angle of repose increased from 25.1-28.9o and 24.7-27.1o for Ex-Dakar pods and kernels, and for Manipintar pod and kernels, it increased from 26.3-29.5o and 25.0-29.0o. The mean static coefficient of friction on plywood, galvanize sheet and glass increased at varying moisture contents for both pods and kernels. The establishment of these parameters would serve as reference that is required to achieve the desired results in successful design and operation of groundnut processing equipment.
Keywords: engineering properties, groundnut varieties, moisture content, angle of repose
Citation: Muhammad, A. I., R. K. Ahmad, and I. Lawan. Effect of moisture content on some engineering properties of
groundnut pods and kernels. Agricultural Engineering International: CIGR Journal, 19(4): 200–208.
1 Introduction
Groundnut, sometimes referred as peanut or earthnut
(Arachis hypogea Linnaeus), is an herbaceous plant
species with its pods growing underneath the soil. It is
widely cultivated in warm climates and currently grown
Received date: 2017-04-01 Accepted date: 2017-06-11
* Corresponding author: Muhammad, Aliyu Idris, Department of Agricultural and Environmental Engineering, Faculty of Engineering, Bayero University, Kano P.M.B. 3011, Gwarzo road, Kano-Nigeria. Email: [email protected], +2348032170772, 07020317025.
on nearly 22.2 million hectares worldwide with a total
production of 35 million tons. Groundnut is of two major
varieties; bunch and runner varieties. The bunch varieties
are common in the United States, grow 30-40 cm in
height and do not spread. Then, the runner varieties
which is the most common in West Africa, are shorter
and run along the ground for 30-60 cm. Apart from the
above mentioned varieties, many intermediate hybrids
exist (Muhammad et al., 2015). The crop is an important
source of protein in human diet and livestock feeds; the
kernels are rich in edible oil (43%-55%) and protein
insulation, fuel and fertilizer (Payman et al., 2011). The
cake after oil extraction is used as animal feed, in fact no
part of groundnut is a waste.
The major moisture-dependent physical properties of
biological materials are shape and size, bulk density, true
density, porosity, mass of fruits, angle of repose and
friction against various surfaces. These properties have
been studied for various crops: Millet (Baryeh, 2002;
Bart-Plange and Baryeh, 2003), Groundnut (Firouzi et al.,
2009), Sweet seeds (Simonyan et al., 2009), paddy rice
(Adebowale et al., 2011), Walnut (Altuntas and Erkol,
2010) and Apricot Pit (Shahbazi, 2012). Properties
related to design of groundnut handling equipment were
investigated in various literatures. Among which are
physical dimensions, geometric mean diameter, sphericity
and density, angle of repose, coefficient of static friction
on different surfaces all determined at 4.6% moisture
content (Olajide and Igbeka, 2003). Similarly, properties
for peanut pods and its kernel at moisture content of
8.25% and 10.03% (dry basis) respectively were
determined in (Dilmac and Altuntas, 2012), for Samnut
10, Samnut 14 and Samnut 18 determined 8% moisture
content (Fashina et al., 2014).
Payman et al. (2011) stated that at different
processing stages, groundnut passes several ranges of
moisture content namely: 35% moisture content under the
soil, 15%-25% at harvesting time depending on
environmental conditions and management strategy, and
18%-24% at threshing time. Furthermore, the moisture
content should be reduced to 7% before storage.
Considering the different levels of moisture content
groundnut undergoes and the rapid seed deterioration it
encounters during storage, Alam et al., (2013) emphasized
on the need to investigate some engineering properties of
groundnut as affected by the moisture content changes.
Such properties include: length, thickness and width,
geometric mean diameter, sphericity, unit mass, volume,
surface area, bulk and true density, angle of repose,
porosity and static coefficient of friction and also rupture
strength. The knowledge would be used in designing of
various handling equipment for pneumatic conveying,
separating, shelling, drying, and storage of the product.
The aim of the study was to determine some
engineering properties of groundnuts commonly
cultivated in Northwestern Nigeria as the basis for the
redesign and improvement of local groundnut handling
equipment. This has become necessary looking at the
prevalent low-quality kernels from groundnut processing
clusters which poses risk of kernels contaminations.
2 Materials and Methods
2.1 Materials used in the study
Some of the materials used in the study includes;
digital slide vernier caliper, digital balance, graduated
measuring cylinders of different sizes, vacuum oven,
angle of repose measuring apparatus, pycnometer, steel
sheet, plywood, glass, two groundnut varieties; Ex-Dakar
and Manipintar.
2.2 Sampling
The groundnut varieties selected were Ex-Dakar and Manipintar. These were believed to be the commonest varieties in the local market of the study area (Dawanau
market of Kano Sate, Nigeria) during the year 2016. The
samples were to remove all foreign matter such as dust,
debris, stones, and immature pods and kernels.
2.3 Determination of Engineering Properties
2.3.1 Determination of Moisture Content
The initial moisture content was determined using
ASABE standard (2008) described in (Payman et al.,
2011) on dry basis. Triplicate samples (pods and kernels)
of 200 g for each variety were dried in air convection
oven set at temperature of 100 ± 3°C and monitored for a
period of 72 hrs. At the end moisture content was
calculated on dry basis using the relationship described
by Simonyanet al. (2009):
100
i d wb
i
W W MC
W
−
= × (1)
where, MCwb = Moisture content (% w.b.); Wi = Initial
mass of groundnuts (kg), and Wd = dry mass of the
samples (kg).
Furthermore, desired moisture levels of the
groundnuts to conduct the experiment were prepared by
adding the required amount of distilled water calculated
from the given relationship:
( )
100
i f i
f
W M M
Q
M
− =
where, Wi, Mi and Mf are the initial mass (g), initial
moisture content (% d.b.) and final moisture content of
the groundnut samples (% d.b.), respectively. Prior to
conducting each experiment, the required amount of
samples were taken out of refrigerator and allowed to
equilibrate with room temperature for about 2 hrs (Firouzi
et al., 2009).
The resultant moisture contents of groundnut were 7.3,
10.2, 14.1, 23.5 and 25.2 % d.b. for the pods and 8.5%,
10.2%, 13.6%, 25.4% and 28.1% d.b. for kernels for the
two varieties. All the physical properties of the groundnut
were determined at these moisture levels with three
replications at each level.
2.3.2 Determination of Principal Dimensions
The three principal dimensions (length width and
thickness) of each groundnut pods and kernels were
determined by measurements using digital slide Vernier
calipers on one hundred samples of groundnut pods and
kernels for each variety and at three different moisture
content levels.
The Geometric Mean Diameter (GMD) and
Arithmetic Mean Diameter (AMD) of pods and kernels
were calculated according to the relationship obtained
from (Mohsenin, 1986; Payman et al., 2011).
1 3
( )
D= LWT (3)
( )
3
a
L W T
D = + + (4)
2.3.3 Determination of Surface area
The surface area, A was calculated in accordance with
Odesanya et al. (2015) as:
2
A=πD (cm2) (5)
where, D = Geometric mean diameter (cm).
2.3.4 Determination of Porosity
The porosity (P) of the groundnut pods and kernels at
different moisture contents were calculated from the
mean values of bulk density (ρb) and true density (ρT)
using the relationship obtained in (Davies, 2009):
1 b
T ρ
P
ρ
= − (6)
2.3.5 Determination of Bulk Density
The bulk density was determined by filling a
graduated cylinder of 500 mL with the groundnuts up to
its brim from a height of about 150 mm and the excess
was removed by striking off the top with stick and
weighing the contents of cylinder. The bulk density (ρb)
of groundnut pods and kernels was then calculated by
dividing the mass (M) to the volume (Vb) of 500 mL
(Aydin, 2007).
b b
M
ρ
V
= (7)
2.3.6 Determination of True Density
True density of the groundnut pods and kernels was
determined by liquid displacement method (using toluene;
C7H8 as the liquid). Toluene was used because it has
lower surface tension and lower specific mass when
compared to water. The volume of sample and true
density (ρT) were calculated using the Equations 8 and 9
respectively as given by (Altuntas and Erkol, 2010;
Payman et al., 2011):
( tp p) ( pts ps)
td s
tolu tolu
M M M M
M V
ρ ρ
− − −
= = (8)
ps p T
s
M M
ρ
V
−
= (9)
where, Vs = Volume of sample (m3); Mtd = weight of
displaced toluene (g); ρtolu = density of toluene (kg m-3);
Mtp = weight of pycnometer and toluene (g); Mp = weight
of pycnometer (g); Mpts = weight of pycnometer, toluene
and sample (g); Mps = weight of pycnometer and sample
(g).
2.3.7 Determination of Angle of Repose
The angle of repose was determined by using wooden
box and two plates; fixed and adjustable. The wooden
box was filled with the groundnut sample and the
adjustable plate was gradually lifted until the material
start to slide over the inclined surface at this point the
angle of inclination was recorded as the angle of repose
for the groundnut samples (Muhammad et al., 2015).
2.3.8 Determination of Static Coefficient of Friction
The static coefficient of friction of groundnut pods
and kernels against three different surfaces; namely steel
sheet, plywood, and glass was determined using a
wooden frame (10 cm×10 cm×6 cm) without base and lid
which was placed over different surfaces and filled with
on the surface to be lifted for inclination from the
horizontal. The angle of inclination of the surface was
increased gradually until the box with the content just
started to slide down. This angle between the inclined
surface and the horizontal was measured, the tangent of
which gave the static coefficient of friction as stated in
Equation (10). This method was used by other researchers
like (Gupta and Das, 1997; Baryeh, 2002; Bart-Plange
and Baryeh, 2003).
μs= tanφ (10)
where, μs = static coefficient of friction; φ = angle
between the inclined surface and the horizontal at which
samples just start to slide down. Three replications for
each groundnut sample were made.
3 Results and Discussion
3.1 Sizes Dimension
3.1.1 Principal Dimensions of the two groundnut
varieties
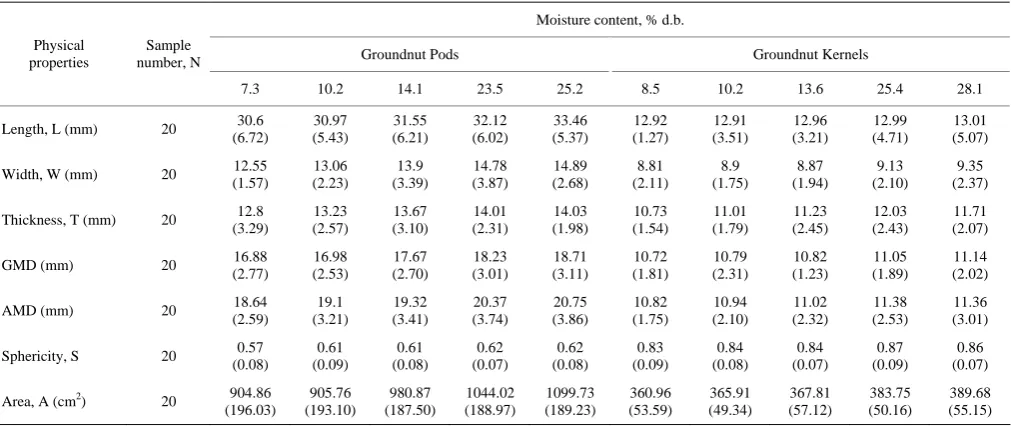
Table 1 showed the means of physical properties of
groundnut pods and kernels for Ex-Dakar variety. It
could be seen that the length, width and thickness for the
pods were presented at various moisture contents with
length ranging from 30.6-33.46 mm, width ranging from
12.55-14.89 mm and thickness ranging from 12.8-
14.03 mm all recorded at 7.3% and 25.2% moisture
content, respectively. Similarly, the length, width and
thickness recorded for Ex-Dakar groundnut kernels were
in the range of 12.92-13.01 mm, 8.81-9.35 mm, 10.73-
11.71 mm at moisture content of between 8.5%-28.1%,
respectively. These results were similar to that reported
by (Payman et al., 2011). However, for Manipintar in
Table 2, the length, width and thickness for the pods were
presented at various moisture levels with length ranging
from 18.60-30.89 mm, 11.62-15.01 mm, and 11.72-
14.05 mm at moisture levels ranging from 7.3%-25.2%,
respectively. Similarly, for the kernels, the length, width
and thickness were recorded in the range of 12.10-
15.50 mm, 8.11-9.87 mm, and 7.36-8.77 mm at moisture
range of between 8.5%-28.1%, respectively. Similar
result was reported by Firouzi (2009). In comparing the
two varieties, it could be deduced that the sizes of Manipintar in terms of length, width and thickness were
larger than that of Ex-Dakar.
Table 1 Some Physical Properties of Ex-Dakar Groundnut Variety at different moisture contents
Moisture content, % d.b.
Groundnut Pods Groundnut Kernels Physical
properties
Sample number, N
7.3 10.2 14.1 23.5 25.2 8.5 10.2 13.6 25.4 28.1 Length, L (mm) 20 30.6
(6.72) 30.97 (5.43) 31.55 (6.21) 32.12 (6.02) 33.46 (5.37) 12.92 (1.27) 12.91 (3.51) 12.96 (3.21) 12.99 (4.71) 13.01 (5.07) Width, W (mm) 20 12.55
(1.57) 13.06 (2.23) 13.9 (3.39) 14.78 (3.87) 14.89 (2.68) 8.81 (2.11) 8.9 (1.75) 8.87 (1.94) 9.13 (2.10) 9.35 (2.37) Thickness, T (mm) 20 12.8
(3.29) 13.23 (2.57) 13.67 (3.10) 14.01 (2.31) 14.03 (1.98) 10.73 (1.54) 11.01 (1.79) 11.23 (2.45) 12.03 (2.43) 11.71 (2.07) GMD (mm) 20 16.88
(2.77) 16.98 (2.53) 17.67 (2.70) 18.23 (3.01) 18.71 (3.11) 10.72 (1.81) 10.79 (2.31) 10.82 (1.23) 11.05 (1.89) 11.14 (2.02) AMD (mm) 20 18.64
(2.59) 19.1 (3.21) 19.32 (3.41) 20.37 (3.74) 20.75 (3.86) 10.82 (1.75) 10.94 (2.10) 11.02 (2.32) 11.38 (2.53) 11.36 (3.01) Sphericity, S 20 0.57
(0.08) 0.61 (0.09) 0.61 (0.08) 0.62 (0.07) 0.62 (0.08) 0.83 (0.09) 0.84 (0.08) 0.84 (0.07) 0.87 (0.09) 0.86 (0.07) Area, A (cm2) 20 904.86
(196.03) 905.76 (193.10) 980.87 (187.50) 1044.02 (188.97) 1099.73 (189.23) 360.96 (53.59) 365.91 (49.34) 367.81 (57.12) 383.75 (50.16) 389.68 (55.15) Note: Standard deviations are in parenthesis.
The geometric mean diameter (GMD) and arithmetic
mean diameter (AMD) obtained at moisture contents of
7.3%-25.2% ranged from 16.88-18.71 mm and 18.61-
20.75 mm for the pods, respectively whereas the
corresponding kernels ranged from 10.72-11.14 mm for
GMD and 10.82-11.36 mm for AMD and were obtained
at moisture contents of 8.5%-28.1%, respectively (Table
1). This property of groundnut pods and kernels tended to
increase as moisture level increased. Similar result was
reported by Odesanya et al. (2015) for Ex-Dakar
groundnut variety. Furthermore, from Table 2, the GMD
in the range of 13.63-18.68 mm and 13.98-19.98 mm at
moisture levels between 7.3%-25.2%, respectively.
Similarly, the corresponding GMD and AMD for the
kernels ranged from 8.97-11.03 mm and 9.19-11.38 mm
at moisture levels between 8.5%-28.1%, respectively. The
result was slightly different from that reported by
Odesanya et al. (2015) for Samnut 22 and Ex-Dakar
groundnut varieties. However, knowing this property is
of paramount important in the selection of concave size
for designing of shelling or decorticating and separation
machines. Conclusively, Manipintar variety has larger
GMD and AMD than that of Ex-Dakar. When
processing the two varieties, both will require different
concave size.
Table 2 Some Physical Properties of Manipintar Groundnut Variety at different moisture contents
Moisture content, % d.b.
Groundnut Pods Groundnut Kernels Physical
properties
Sample number, N
7.3 10.2 14.1 23.5 25.2 8.5 10.2 13.6 25.4 28.1 Length, L (mm) 20 18.60
(2.09) 20.70 (3.21) 25.19 (3.89) 28.97 (4.01) 30.89 (5.70) 12.10 (3.26) 13.05 (2.75) 13.85 (3.12) 14.72 (3.40) 15.50 (2.68) Width, W (mm) 20 11.62
(1.96) 12.55 (3.30) 13.49 (3.12) 14.84 (3.54) 15.01 (2.09) 8.11 (1.81) 8.45 (2.09) 8.65 (2.52) 8.97 (2.33) 9.87 (2.20) Thickness, T (mm) 20 11.72
(1.97) 12.46 (3.47) 12.70 (3.90) 13.90 (2.99) 14.05 (2.75) 7.36 (0.98) 7.54 (1.45) 7.63 (2.30) 8.63 (1.87) 8.77 (1.73) GMD (mm) 20 13.63
(2.98) 14.79 (4.10) 16.28 (3.08) 18.15 (3.62) 18.68 (3.15) 8.97 (1.57) 9.40 (2.09) 9.71 (3.01) 10.44 (3.20) 11.03 (3.43) AMD (mm) 20 13.98
(3.41) 15.24 (4.12) 17.13 (4.36) 19.24 (4.57) 19.98 (3.78) 9.19 (1.22) 9.68 (2.31) 10.04 (3.00) 10.77 (1.97) 11.38 (2.41) Sphericity, S 20 0.73
(0.09) 0.71 (0.08) 0.65 (0.07) 0.63 (0.09) 0.60 (0.08) 0.74 (0.08) 0.72 (0.09) 0.70 (0.07) 0.71 (0.08) 0.71 (0.09) Area, A (cm2) 20 583.78
(98.08) 687.44 (103.92) 832.75 (106.76) 1034.54 (105.23) 1095.80 (109.32) 252.89 (45.76) 277.79 (52.13) 295.90 (50.78) 342.73 (49.65) 382.16 (63.10) Note: Standard deviations are in parenthesis.
3.1.2 Surface Area
The surface area for the pods (Table 1) ranged from
904.86-1099.73 cm2 at a moisture range of 7.3%-25.2%
while for the kernels, it ranged from 360.96-389.68 cm2
at moisture range of between 8.5%-28.1%, respectively.
The surface area showed an increase when the moisture
content increased. Similar trend was observed in Aydin
(2007). However, for Manipintar variety (Table 2), the
surface area ranged from 583.78-1095.80 cm2 for the
pods at moisture ranges of 7.3%-25.2% while the surface
area ranging from 252.89-382.16 cm2 at moisture content
between 8.5%-28.1% were for the kernels. This is in
accordance with the results obtained by Aydin (2007).
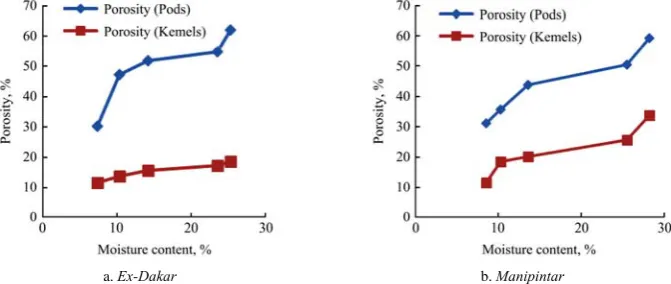
3.2 Porosity
The porosity for Ex-Dakar groundnut pods and
kernels (Figure 1a) increased from 30.23%-61.77%
within a moisture range of 7.3%-25.2% and from
11.65%-18.63% in a moisture range of 8.5%-28.1%,
respectively. Similarly, the porosity for Manipintar
variety for pods and kernels (Figure 1b) ranged from
31.37%-59.41% within a moisture content of 7.5%-25.2%
and from 11.65%-33.82% in moisture range of 8.5%-
28.1%, respectively. It could be seen that the porosity for
both groundnut varieties increased with the increase of
moisture content. This finding was in conformity with
what was reported by Aydin (2007) and Payman et al.
(2011). It could be observed from the graphs that the
porosity for Ex-Dakar groundnut variety was slightly
higher that of Manipintar variety.
3.3 True Density
The true density for Ex-Dakar groundnut pods
increased with the increase of moisture content and it
varied from 0.35-0.72 g cm-3 when the moisture increased
from7.3%-25.2% (Figure 2a). Similarly, the true density
for the kernels changed from 0.84-1.13 g cm-3 within the
range of 8.5%-28.1% (Figure 2a). However, true density
for Manipintar pods and kernels were shown in Figure 3.
It ranged from 0.39-0.62 g cm-3 for the pods within the
moisture range of 7.3%-25.2% (Figure 3a). Furthermore,
the kernels’ true density ranged from 0.98-1.29 g cm-3
within ranged of 8.5%-28.1%. This same trend was
3.4 Bulk Density
The bulk density of Ex-Dakar pods decreased from
0.33-0.24 g cm-3 when the moisture content increased
from 7.3%-25.2% (Figure 2a). This was also applied to
the kernels where a decrease in bulk density from
0.92-0.55 g cm-3 was recorded from a corresponding
increase in moisture content from 8.5%-28.1% (Figure
2b). On the other hand, bulk density of Manipintar pods
decreased from 0.53-0.21 g cm-3 when the moisture
increased from 7.3%-25.2% (Figure 3a). Likewise, for the
kernels, with a moisture range of 8.5%-28.1%, it
decreases from 1.12-0.75 g cm-3 (Figure 3b).This trend
has been reported by many researchers (Aydin, 2007;
Firouzi, 2009; Payman et al., 2011).
a.Ex-Dakar b. Manipintar
Figure 1 Effect of moisture content on Porosity for Ex-Dakar and Manipintar groundnut varieties
a. Groundnut pods b. Groundnut kernels
Figure 2 Effect of moisture content on True and Bulk densities for Ex-Dakar groundnut pods and kernels
a. Groundnut pods b. Groundnut kernels
Figure 3 Effect of moisture content on True and Bulk densities for Manipintar groundnut pods and kernels 3.5 Angle of Repose
Figure 4a showed the angle of repose for Ex-Dakar
groundnut variety. The angle of repose increased from
25.1-28.9o in line with increase in moisture contents from
7.3%-25% for the groundnut pods, similarly with a
moisture increment from 8.5%-28.1% of the groundnut
kernels, the angle of repose also increased from 24.7-
27.1o. The maximum value of angle of repose (28.9o) for
the pods was slightly lower than that (28.4o) reported by
However, for Manipintar variety, the increase in moisture
content from 7.3%-25% resulted in an increase for the
pods from 26.3-29.5o. This was the case with groundnut
kernels as moisture content increased from 8.5%-28.1%,
there was a corresponding increase from 25.0-29.0o of
angle of repose (Figure 4b). Similar increasing trend was
also reported by Firouzi (2009).
a. Ex-Dakar b. Manipintar
Figure 4 Effect of moisture content on angle of repose for Ex-Dakar and Manipintar variety 3.6 Static coefficient of friction
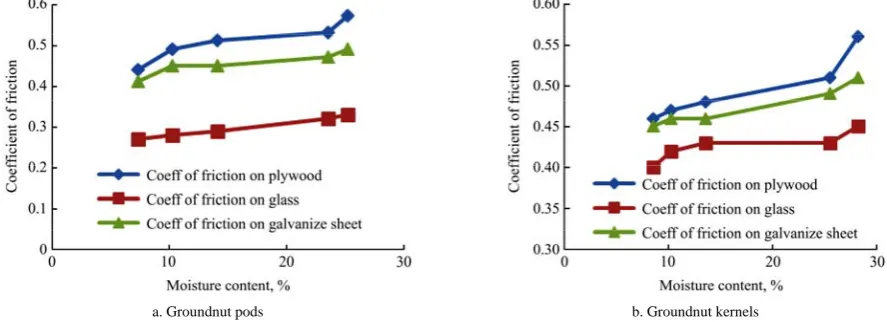
The static coefficient of friction of Ex-Dakar variety
on plywood, glass and galvanize sheet were presented in
Figure 5. The static coefficient of friction for the pods
(Figure 5a) increased from 0.46-0.59 for plywood,
0.43-0.51 for galvanized sheet, and 0.31-0.41 for glass
with the increasing moisture content from 0.73%-25.2%.
This was also applied to the kernels (Figure 5b) in which
the static coefficient of friction increased from 0.45-0.56,
0.45-0.51, and 0.40-0.45 for plywood, galvanized sheet
and glass at an increasing moisture levels of 8.5%-28.1%,
respectively. It could be observed from the result that the
static coefficient of friction for plywood was higher than
that of galvanized sheet and glass.
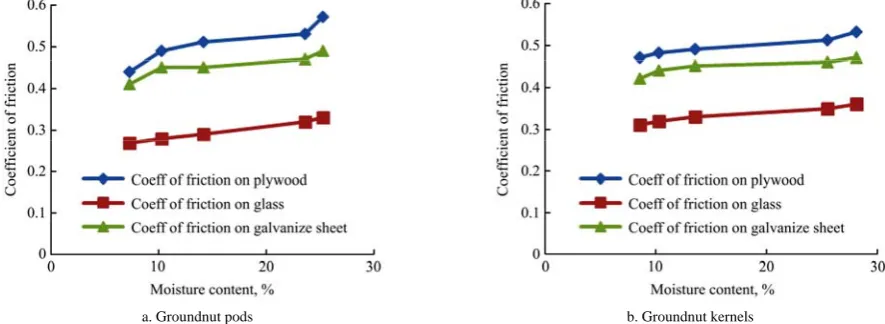
The static coefficient of friction for Manipintar
variety presented in Figure 6 indicated an increase on all
the surfaces. The increase of coefficient of friction
between moisture levels might be explained by the
increase in cohesive force of wet groundnuts with the
surface, because the surface become stickier as moisture
content level increased. The static coefficient of friction
for plywood (0.44-0.57) was higher than for galvanized
sheet (0.41-0.49) and glass (0.27-0.33) in the moisture
range of 7.3%-25.2% (Figure 6a). Also for kernels,
plywood has the highest coefficient of friction (0.47-0.53),
followed by galvanized sheet (0.42-0.47) and glass has
the lowest (0.31-0.36). All these values were within
moisture range of 8.5%-28.1%. This trend was in
agreement with many researchers (Aydin, 2007; Firouzi,
2009; Payman et al., 2011).
a. Groundnut pods b. Groundnut kernels
a. Groundnut pods b. Groundnut kernels
Figure 6 Effect of moisture content on static coefficient of friction on different materials for Manipintar groundnut pods and kernels
4 Conclusion
The effect of moisture content on some engineering
properties of two groundnut varieties was investigated.
The principal dimensions, porosity, true density, angle of
repose and static coefficient of friction were found to
increase with increasing moisture content of the
groundnut irrespective of the variety. However, the bulk
density decreased with the increase in moisture content
for both varieties. The highest static coefficient of friction
was recorded on plywood and was found to increase with
increment in groundnut moisture content in all the
varieties. On the other hand, the least static coefficient of
friction was on glass among the three surfaces
investigated. And this was found to increase with increase
in moisture content of the groundnuts pods and kernels.
The study of moisture dependent properties of agriculture
products is of paramount importance as these guarantee
an extended shelf life. The safety of processed products
like groundnut lies in the moisture content at which it was
handled. Very high and very low moistures may
compromise the quality of groundnuts, leading to damage,
insect pest attack and possible contamination during
handling operations and storage.
Acknowledgement
The authors would like to thank Bayero University,
Kano, Nigeria for funding the graduate study.
References
Adebowale, A. A., L. O., Sanni, H. O., Owo, and O. R., Karim.
2011. Effect of variety and moisture content on some engineering properties of paddy rice. Journal of Food Science and Technology, 48(5): 551–559.
Alam, M. M., M. M., Rahman, M. A., Samad, R., Ashrafi, and M. M., Rahman. 2013. Effect of storage container and initial seed moisture content on quality of shelled groundnut seed. Journal of Agroforestry and Environmen, 7(1): 23–26.
Altuntas, E., and M. Erkol. 2010. Physical properties of shelled and kernel walnuts as affected by the moisture content. Czech Journal of Food Sciences, 28(6): 547–556.
Aydin, C. 2007. Some engineering properties of peanut and kernel. Journal of Food Engineering, 79(3): 810–816.
Bart-Plange, A., and E. A. Baryeh. 2003. The Physical Properties of Category B Cocoa Beans. The Physical Properties of Category B Cocoa Beans, 60(3): 219–227.
Baryeh, E. A. 2002. Physical properties of Millet. Journal of Agricultural Engineering Research, 51(1): 39–46.
Davies, R. M. 2009. Some Physical Properties of Groundnut Grains. Research Journal of Applied Sciences, Engineering and Technology, 1(2): 10–13.
Dilmac, M., and E. Altuntas. 2012. Selected some engineering properties of peanut and its kernel. International Journal of Food Engineering, 8(2): 1168-1174.
Fashina, A. B., A., Saleh, and F. B. Akande. 2014. Some engineering properties of three selected groundnut (Arachishypogaea L.) varieties cultivated in Nigeria. CIGR Journal, 16(4): 268–277.
Firouzi, S., M. N. S. Vishgaei, and B. Kaviani. 2009. Some physical properties of groundnut (Arachis hypogaea L.) Kernal cv. NC2 as a function of moisture content. American-Eurasian Journal of Agriculture and Environmental Science, 6(6): 675–679.
Gupta, R. K., and S. K., Das. 1997. Physical properties of Sunflower seeds. Journal of Agricultural Engineering Research, 66(1): 1–8.
materials (2nd ed.). New York: Gordon and Breach Science Publisher.
Muhammad, A. I., M., Isiaka, A. A., Fagge, M. L., Attanda, I., Lawan, and N. D., Dangora. 2015. Some Engineering properties of three varieties of Groundnut pods and kernels. Arid Zone Journal of Engineering, Technology and Environment, 11: 61–75.
Odesanya, K. O., K.A., Adebiyi, and T. A. O., Salau. 2015. Estimation of Engineering Parameters for the Development of a Groundnut Decorticator. International Journal of Novel Research in Engineering and Applied Sciences, 2(1): 2–25. Olajide, J. O., and J. C., Igbeka 2003. Some physical properties of
groundnut kernels. Journal of Food Engineering, 58(2): 201–204. Payman, S. H., F. R., Ajdadi, I., Bagheri, and M. R., Alizadeh.
2011. Effect of moisture content on some engineering properties of peanut varieties. Journal of Food Science and Technology, 48(5): 551–559.
Shahbazi, F. 2012. Effects of Moisture Content , Impact Direction and Impact Energy on the Cracking Characteristics of Apricot Pit. World Applied Sciences Jurnal 20(11): 1520–1528. Simonyan, K. J., Y. D., Yiljep, O. B., Oyatoyan, and G. S., Bawa.