Reliability Analysis of the Internet of Things Based on
Ordered Binary Decision Diagram
https://doi.org/10.3991/ijoe.v14i08.9185
Wei Guan
Guangdong Polytechnic of Water Resources and Electric Engineering, Guangzhou, China
Abstract—The reliability of the Internet of Things (IoT) system is analyzed and studied through ordered binary decision diagram (OBDD) to improve its design, application, and development. Based on the OBDD analysis, a reliabil-ity evaluation method named as enhanced node expansion (ENE) is proposed. This method provides an effective solution for the reliability assessment of IoT with large scale and complex network structure. A link importance assessment method based on OBDD analysis is also established. The proposed method can accurately and effectively evaluate the reliability of the IoT network and is practical for discussing the reliability, design, and development of this system.
Keywords—Internet of things, ordered binary decision diagram, reliability, en-hanced node expansion method
1
Introduction
In 2005, the concept of “the Internet of Things (IoT)” was formally proposed by the International Telecommunications Union (ITU). ITU pointed out in the ITU Inter-net Report 2005: the InterInter-net of Things that the 21st Century is an omnipresent “In-ternet of things communication era when all objects from cars to roads, furniture to houses and even the world can communicate with each other according to their needs through the network [1]. At the end of 2008, the chief executive of International Business Machine first proposed the concept of “intelligent earth”, namely, embed-ding sensors in every place around the world and adembed-ding labels to all items incluembed-ding cars, clothing, and toothbrushes. These objects are generally connected to form the IoT, and their management, adjustment, and integration are achieved through large-scale servers and “cloud computing.” Ultimately, "Internet + networking = the intelli-gent earth" is formed, and IoT is predicted to be the next wave for the information industry [2].
sig-nal, the stability of the communication link is deficient, the terminal of IOT is widely distributed, and the structure is simpler than the terminal of the computer network and thus faces the shortcomings of the terminal work deficiency and vulnerability to at-tack. The network is a mobile network without a fixed topology, and the overall con-nectivity of the network is not guaranteed. The applied industries of IoT, such as food safety and intrusion detection, require that IoT provides rapid and accurate response to unexpected events, users, and managers and realizes the accurate communication between people and things. The infrastructure of the network must also have an eco-nomic department. This network requires coordinated operation of the system in an efficient and reliable mode, and reliability is fully considered in the network design, deployment, and network management phases.
2
State of the art
Ordered binary decision diagram (OBDD) is a standard expression form of Boole-an function Boole-and a new data structure. Based on OBDD, BooleBoole-an functions cBoole-an be effectively expressed and operated, which can be regarded as a new abstract data type. The successful application of OBDD in large-scale integrated circuit logic synthesis and verification has attracted attention from academia and industrial application cir-cles. To date, OBDD technology and its industrial application have made considerable progress and produced considerable research results.
of ordered binary decision diagrams determined by polynomial size, Brosenne et al. studied uncertainty, where the layer was driven by the same variable. K is a constant that shows that a similar hierarchy collapses for existence, parity, and most accepted modes [5]. Bibilo presented a multilevel representation algorithm for incomplete definitions of Boolean function systems with various initial functions. Multilevel representation is based on Shannon decomposition. The experimental results show that the proposed algorithm is effective for the synthesis of library element logic cir-cuits [6]. Marugán et al. believed that enterprises needed to optimize any decision made to improve their competitiveness. The relationship between reasons and deci-sions is influenced by the decision-making process, and the best solution for each logistical or organizational problem could be established by finding the main reasons involving the best decisions. The decision process is analyzed qualitatively and quan-titatively using the logical decision tree and binary decision diagram. Moreover, a new kind of different ranking method is proposed for the logical decision tree of sev-eral case studies [7]. Khadiev discussed the famous K-OBDD model and proved the breadth-based hierarchy of Boolean function classes based on K-OBDD. The proof of the hierarchy is the sufficient condition that Boolean functions are represented as the complex properties of K-OBDD and Boolean function-server application function. The function is the modification of the known pointer jumping (PJ) and indirect stor-age access (ISA) function [8].
Most scholars studied the theory and calculation method of OBDD; however, only a few focused on its application to the reliability of the IoT. Therefore, in view of the above situation, this paper analyzes and studies the reliability of the IoT by using ordered binary decision diagram.
3
Method
3.1 Analysis of the architecture of the IoT
The IOT is a huge information system, covering all aspects of information technol-ogy, including, coding, sensing, communication, network, and many other aspects, with a variety of architectures. The structure of the IoT proposed by China mainly includes three parts shown in Figure 1.
Human-computer
interaction Hardware manufacturing technology
Data processing Program development
Data field distance
transmission communicationLong distance
Short distance
transmission of data communicationShort distance
Data acquisition Perception, detection
Integrated circuit Software technology Codec and standard
Application layer
Network layer
Perceptive layer
Process of information
processing Key technology
Internet of things system
Fig. 1. Typical architecture of the IoT
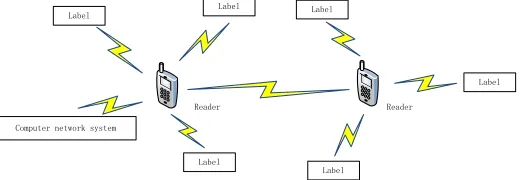
The perception layer is the end, collecting object information in the IoT. This layer is located at the bottom of the three-layer structure of the IoT, which digitizes the physical characteristics of the objects. Therefore, the perception layer is the founda-tion of the whole industrial chain and the link with the largest total demand. The most important technology for the application of the perception layer is RFID. RFID refers to the use of radio frequency signals to achieve non-contact transmission. The system is usually composed of an electronic tag, a reader and an upper unit, as shown in Fig-ure 2. The workflow of the RFID system is that the reader sends the encoded infor-mation around the transmitter through the transmitting antenna. When the label enters the working area of the transmitting antenna, it receives the signal and activates the label. The activated tag determines the reader's request and permission information according to the received information and completes the corresponding operation according to the judgment result. If the outcome is a read command, then the tag sends the corresponding information to the reader through the antenna, and the reader receives the data and sends them to the upper unit main system for related processing. If the outcome is the written command, then the tag modifies the internal data in ac-cordance with the reader's request.
The network layer is located in the middle of the three-layer structure of the IoT and mainly connects the perception layer to the traditional network, the user access, and the communication of information according to the application layer. The main technologies include wireless ad hoc networks and traditional wired and wireless networks. Wireless ad hoc networks (AdHoc) can independently build networks with-out the support of fixed network facilities. All nodes in the network have equal status, no special central control node exists, and the nodes can communicate directly with those in their own communication range. When the distance between the destination node and the source node exceeds the direct communication distance of the node, they can communicate through the intermediate node forwarding data, that is, the data must pass through more jumps so that they can reach the destination. This communi-cation requires that nodes in the network not only have the functions required by ordinary mobile terminals, but also have the routing function of message forwarding. AdHoc network is not dependent on fixed and special network facilities. This system can quickly establish and close the network and can also access Internet or cellular wireless network. This feature provides a favorable guarantee for its extensive use in the IoT.
The application layer is the interface between the IoT and users (people, organiza-tions, and other systems), which is combined with the specific needs of the industry to realize the diversified application of the IoT. The key technologies include complex data management and open-loop management of different application systems.
3.2 Reliability analysis
Reliability theory had originated in the early 1920s. The earliest research area was machine maintenance, but it did not receive enough attention. During the Second World War, a large number of war equipment and equipment encountered the large scale of scrap in the process of transportation and storage due to low reliability. As a result, countries began to pay attention to reliability research, which has become the focus of many researchers. With the development of science and technology, all kinds of systems become increasingly large and complex, and the working environment diversifies. This outcome increases system requirements to not only accuracy but also high reliability.
degree is used to measure the probability of reliability, expressed as R(t), which indi-cates the probability of a product working normally in time t, as shown in formula (1).
( )
(
)
1( )
0t( ) ( )
R t =P T t> = !F t =
"
f t d t . (1)In (1), T indicates the normal working time of the product, and f(t) is the product failure distribution density function.
The large number of terminal devices in the IOT is the basis for realizing the func-tion of the system. Only when the equipment is working normally and without fault can the system function be operated. The reliability of the equipment is characterized by the inherent reliability of the system itself. Many terminals are in the state of un-manned surveillance for a long time. Human interference occurred during the work, which requires the terminal to have high reliability.
Communication in the IoT greatly differs from general communication. The main difference is the large number of nodes in the IoT. Communication is not a single one-to-one communication but a multi-to-one communication. The working environ-ment of the communication node is complex, and the structure of the node is relative-ly simple, easy to be disturbed and attacked by the outside world. The node in the IoT is dynamic and the communication link is unstable. The reliability of communication in the environment of IoT is analyzed in the light of the situation of electromagnetic interference and the movement of communication nodes.
The network is the core of the IoT. The reliability of the IoT represents the reliabil-ity of the system to a certain extent. The reliable connectivreliabil-ity of the network is the main direction of the research of network reliability, but the connectivity of the net-work cannot fully reflect the reliability of the netnet-work. Assessing the reliability of the network from all aspects is necessary, including the network connectivity rate, net-work capacity, delay, and packet loss rate, which are the main contents of the reliabil-ity of the IoT.
3.3 Reliability evaluation based on ordered binary decision diagram
Binary decision diagram (BDD) is an efficient structured expression of Boolean functions. BDD can reduce the storage space by classifying the equivalent state of Boolean functions into the same structure. The if-then-else Boolean operator is x!y0
and y1 is x!y0,y1=(x"y0)(-x"y1). The Boolean expression consisting of only the
if-then-else Boolean operator, the Boolean variable, and the Boolean constants 0 and 1 is called INF paradigm. If the expression of Boolean variable x in the Boolean ex-pression t is marked as t|x=1 and the exex-pression of x valued 0 is marked as t|x=0, then it is not difficult to find the equivalent form of the Boolean expression t:
1 0
| , |
x xt x
= !
t
=t
= . (2)varia-bles in t is performed one by one, the process is represented by a tree graph then the binary decision diagram (BDD) can be obtained.
0 1
x
0 1 0 1
0 1
y x
y z
0 1
y
z x
x y z
xy xyz
Fig. 3. BDD expression of Boolean function
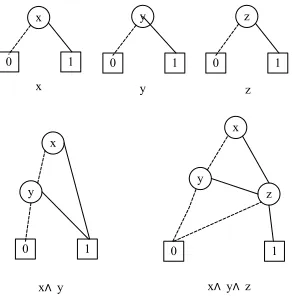
In Figure 3, the Boolean function f=xyz is taken as an example to illustrate the structure form of BDD. BDD has a hierarchical feature, which consists of multi-layer circular nodes and the bottom two rectangular nodes. Each layer can have multiple circular nodes, but all round nodes in the same layer except the lowest layer corre-spond to the same Boolean variables; the lowest two nodes are rectangular, represent-ing logical true or logical false. Each circular node has two directional edges to point to the next layer. One edge is marked with a solid line and the other, a dotted line: the solid line edge points to the bottom structure when the node takes 1, also known as the 1- child; the dashed line edge points to the bottom structure when the node takes 0, called the 0- child. The same Boolean function can generate different structures but equivalent BDD through different order of variables. Therefore, by optimizing the order of variables, the number of nodes in BDD can be reduced, and the overall com-putational complexity can be reduced.
If the BDD is created for a Boolean function in a clear sequence of variables, the result is an ordered binary decision diagram, namely, an ordered BDD. Breadth First Search (BFS) has been proved to be an effective OBDD ranking principle, and this BFS principle is also adopted here. From the above analysis and method, any Boolean function can be transformed into a non-circular ordered binary decision diagram is-sue.
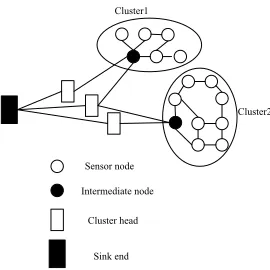
of the IoT can be defined as the connectivity probability between the two nodes in the undirected graph, that is, the reliability of the two terminals networks. The two termi-nals here refer to the two endpoints of the Sink end and sensor nodes in the IoT. Based on the research methods and results of the two terminals’ reliability of the IoT network, this system can be similarly used in the reliability of K-end network between K endpoints and the full-end network reliability between all endpoints in the network.
Cluster1
Cluster2
Sensor node
Intermediate node
Cluster head
Sink end
Fig. 4. Undirected graph representation of Internet of things
According to the above analysis, the IoT can be represented by an undirected ran-dom graph G= (V, E), where V is a set of nodes and E V V! " is a set of edges. For each node vi, the probability of normal work is pi, and the probability of failure of the
node is (1-pi). The edge between the node vi and node vj is written as vij, whose
prob-ability is pij, and the probability of failure at that edge is (1- pij). The undirected
ran-dom graph G= (V, E) model is applied to study the two-terminal reliability of the IoT, based on the following two assumptions. One is to assume that the failure of nodes and edges is statistically independent. The second one is to assume that the topologi-cal structure remains the same.
The reliability of graph G= (V, E) can be represented by the following Boolean ex-pression:
( )
{ }
(
( )
0(
s v)
)
v adjacentnodeofs
f G x f G=>
!
=
#
". (3)
In (3), s is the source node, v is the node adjacent to s, x0 is the Boolean variable of
to see if a subnet OBDD that is isomorphic to the current subnet exists in the hash table. If an isomorphism sub OBDD exists in the hash table, then it will return to isomorphic subnet OBDD. If no isomorphic subnet OBDD exists, then proceed to the next step. This discriminating step can avoid repeated construction of isomorphic subnet OBDD and save considerable computation time. The fourth step is to perform the Boolean operations on the OBDD and store the result robdd (G) in the hash table.
( )
( )
(
)
( )
( )
( )
' ;
'
obdd obdd obdd s vj
obdd obdd obdd
r G r xj and r G
r G r G or r G
=> =
= . (4)
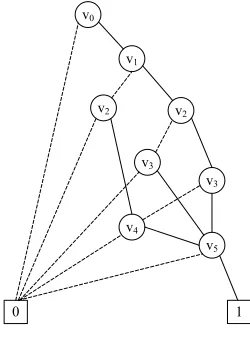
As an example, Figure 5 is the OBDD structure of the network G built by the ENE method, in which v0 is the source starting point, v5 is the target node, and
f=x0"((x1"x3)(x2"x4))"x5.
0 1
v4
v5
v3
v3
v2
v2
v1
v0
Fig. 5. OBDD structure of network G
According to the Shannon decomposition theorem:
1 0
b b
f b f
=
!
=+
b f
!
= . (5)The reliability of the network can be calculated as follows:
( )
(
( )
)
(
)
(
( )
)
(
)
(
( )
)
1
0
Pr 1 |
Pr 0 |
i i
rel rel obdd obdd i rel obdd obdd x
i rel obdd obdd x
f G f r G
x f r G
x f r G
!
! =
! =
= =
= "
+ = " . (6)
In (6), ( )
obdd
r G indicates the OBDD construction function of the network G,
( )
|i1obdd x
r G = means the OBDD construction function of subnet when xi=1, and
( )
| 0obdd x
The reliability of G= (V, E) can be calculated through a series of calculations. The failure factor is not taken into account in the reliability obtained. By variable permuta-tion, the variable displacement is conducted by adding the edge variable for the node variable x in equation (3). (xj) is replaced to (xij)(xj), and the xij is a Boolean
varia-ble of the edge eij. The reliability formula (6) is changed accordingly.
( )
(
)
(
( )
)
(
)
(
( )
)
1
0
|
1 |
j j
rel ij j rel obdd obdd x
ij j rel obdd obdd x
f G p p f r G
p p f r G
! =
! =
= " "
+ ! " " . (7)
In (7): pj is the probability of node vj working normally, and pij is the working
probability of edge eij between node vi and node vj. At this point, through the iterative
calculation of OBDD structure and reliability, the results of network G two-terminal network reliability calculation can be obtained.
The main operation of the ENE method lies in the recursive call process. Each nested call is the reliability calculation of the subnet of the current IoT network, and the ENE method uses the hash table and the three-level variable long bit vector label method to avoid the repeated calculation of the isomorphic subnet. In addition, the recursion process can be figuratively understood as the non-repeated traversal of the vertex of graph G. Therefore, the two-stage operation OBDD construction of ENE method and the complexity of reliability calculation process are both less than O(n). According to the above analysis, the total complexity of ENE method is less than O(2n). If the edge order is optimized, the complexity of ENE method can be reduced to O(n).
3.4 Link importance analysis of IoT based on ordered binary decision diagram
The importance of the network link of the IoT is an evaluation method of the link to the reliability of the IoT. The fragile links in the IoT can be determined by analyz-ing the link importance. Based on this result, the fragile link can be enhanced. This method not only effectively reduces the network failure probability, but also reduces the loss caused by network failure. At present, the research calculation of the fault probability related measure still lacks an effective analysis method for large scale network analysis. Figuring out which link importance analysis method is practical and efficient is also necessary.
For the IoT with n links, the Birnbaum measure is defined as follows:
( )
( )
( )
, 0 Bi i
F t
I t i n
F t !
= " <
! . (8)
In (8), F t
( )
indicates the fault distribution function of network G; F ti( )
suggests the fault distribution function of link ei. From the relationship between the reliabilityand the fault distribution function, the Birnbaum measure of link ei satisfies the
fol-lowing formula:
( )
( )
( )
, 0B i
i
R t
I t i n
R t !
= " <
! . (9)
In (9), R t
( )
means the reliability function of the network; R ti( )
represents the reli-ability function of the link ei.For the IoT network G with n links, if its corresponding OBDD structure is OBDD(G), then the Birnbaum measure of the link ei of the network G can be
calcu-lated as follows:
( )
(
( )
|j 1)
(
( )
|j 0)
B
i O x O x
I t =REL OBDD G = !REL OBDD G = . (10)
4
Results
4.1 Reliability verification of the IoT
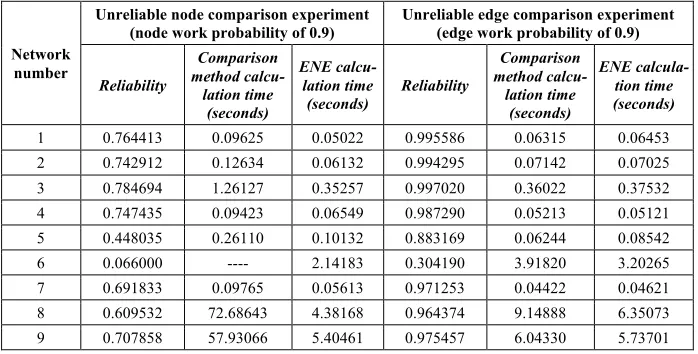
This paper implements the ENE method in C language and compares it with the method of studying the unreliable node network and the method of studying the edge unreliable network through the experiment. The former comparison method uses the variable order optimization method of Singhal to compare the experiment. The latter one uses the heuristic edge order optimization method of Le. Several benchmark net-works are tested in the experiment, and the test results are recorded in Table 1. These networks used in testing are often used as benchmark test networks in the literature for verifying and testing the correctness and efficiency of reliability algorithm.
exper-iment, after each method runs 20 times, the average computing time is recorded as the time overhead in the table. The execution time more than one hour is marked as "-" in the table.
In the contrast experiment of unreliable nodes, from the data from the left half of the table, networks 1 – 4 and network 7 can be seen. These networks are small in scale and simple in topology, and there is little difference between the average opera-tion time of the ENE method and the contrast method (Singhal method). However, for networks 6-8-9, the scale is relatively large. The ENE method is obviously faster than the Singhal method. Particularly with network 6, the Singhal method has more than 1 hour of operation time, whereas the ENE method only takes 2.14083 seconds. The experimental results show that the larger the network size is, the faster the ENE meth-od is compared with the Singhal methmeth-od.
From the experimental data of the right half of Table 1, we can see that the average computing time of the ENE method and the contrast method (Le method) has little difference in the calculation time of the reliability of the unreliable edge network. For networks 1 – 5 and network 7, the network size is smaller, and the correlation be-tween the nodes is less. The operation efficiency of the comparison method – Le method is slightly better than that of the ENE method. However, for networks 6-8-9, the scale is large, the proportion of the associated edges is relatively large, and net-work 8 is obvious. Because the Le method's edge order optimization process increases the computational complexity, the operation time of the ENE method is better than that of the Le method. The experimental results show that in a large network and complex edge structure, ENE method is faster than the Le method.
Table 1. Algorithm running time comparison
Network number
Unreliable node comparison experiment
(node work probability of 0.9) Unreliable edge comparison experiment (edge work probability of 0.9)
Reliability
Comparison method calcu-lation time
(seconds)
ENE calcu-lation time
(seconds) Reliability
Comparison method calcu-lation time
(seconds)
ENE calcula-tion time (seconds) 1 0.764413 0.09625 0.05022 0.995586 0.06315 0.06453 2 0.742912 0.12634 0.06132 0.994295 0.07142 0.07025 3 0.784694 1.26127 0.35257 0.997020 0.36022 0.37532 4 0.747435 0.09423 0.06549 0.987290 0.05213 0.05121 5 0.448035 0.26110 0.10132 0.883169 0.06244 0.08542 6 0.066000 ---- 2.14183 0.304190 3.91820 3.20265 7 0.691833 0.09765 0.05613 0.971253 0.04422 0.04621 8 0.609532 72.68643 4.38168 0.964374 9.14888 6.35073 9 0.707858 57.93066 5.40461 0.975457 6.04330 5.73701
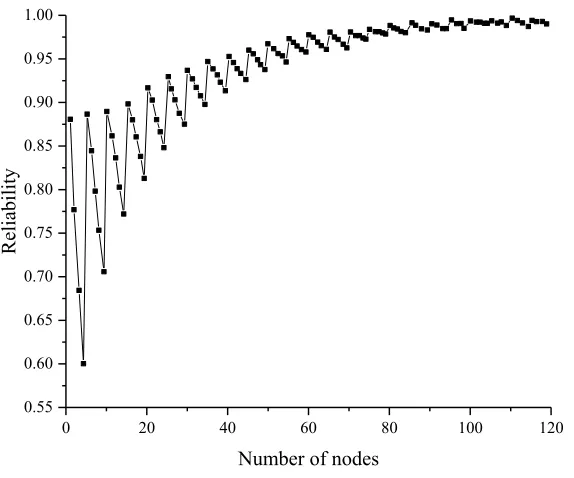
This section assumes that the reliability of each node is R1=0.88, the reliability of
the system is R0=0.95, and the effective node coverage of the normal work of the
system is r=80% to illustrate the practicability of the optimized model. The correla-tion diagram between system reliability and node number is shown in Figure 6.
0 20 40 60 80 100 120
0.55 0.60 0.65 0.70 0.75 0.80 0.85 0.90 0.95 1.00
Re
liabilit
y
Number of nodes
Fig. 6. Correlation diagram between system reliability and node number
As can be seen from Figure 6, the system reliability is not a monotonous number of nodes, thus finding out the number of nodes corresponding to the reliability of the first method is necessary. This example shows that when the IoT system contains 40 nodes, resources are saved the most, and the reliability is 0.9557, which fulfills the required system reliability of 0.95.
4.2 Verification of the importance of the IoT
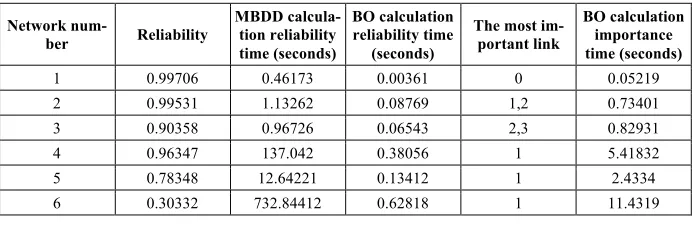
The BO algorithm is tested and verified, and the verification code is implemented in C language. The BDD function library designed by Nielsen is used for reference. In the experimental environment, the hardware running computer is configured as 1.8GHz frequency CPU and 512MB memory, and the software operating system adopts Linux system Fedora13.
ref-erence to verify the efficiency of the BO algorithm. The test network is a large num-ber of networks selected from the classic reliability literature. These networks are often used as benchmarking networks to test the correctness and efficiency of the two contrast algorithms. The source nodes and destination nodes are represented by black dots in each network graph. The experimental comparison assumes that the link fail-ure probability of these networks is 0.9. The result of the run test is listed in Table 2. Comparing the two algorithms in the calculation time of reliability, BO algorithm has high efficiency in computing large scale network, especially when calculating the reliability of No.4 test network and No.6 test network, the time gap between MBDD algorithm and BO algorithm is quite large. In addition, from Table 2,the BO algo-rithm has a very low overhead when calculating the link importance of the network. For example, for No.6 test network with hundreds of links, the computational cost is only more than 10 seconds.
Table 2. Comparison results between reliability and important link analysis experiment
Network
num-ber Reliability
MBDD calcula-tion reliability time (seconds)
BO calculation reliability time
(seconds)
The most im-portant link
BO calculation importance time (seconds)
1 0.99706 0.46173 0.00361 0 0.05219 2 0.99531 1.13262 0.08769 1,2 0.73401 3 0.90358 0.96726 0.06543 2,3 0.82931 4 0.96347 137.042 0.38056 1 5.41832 5 0.78348 12.64221 0.13412 1 2.4334 6 0.30332 732.84412 0.62818 1 11.4319
5
Conclusion
6
References
[1]Suárez, A. D., Parra, O. J. S., & Forero, J. H. D. Design of an Elevator Monitoring Appli-cation using Internet of Things. International Journal of Applied Engineering Research, 2018, vol. 13(6), pp. 4195-4202.
[2]Pan, X. The Design and Reliability Analysis of Elevator Monitoring System Based on the
Internet of Things. International Journal of Smart Home, 2016, vol. 10(12), pp. 183-192 https://doi.org/10.14257/ijsh.2016.10.12.17
[3]Li, L. Gu, T. Chang, L. Xu, Z. Liu, Y. Ciphertext-Policy Attribute-Based Encryption
Based on an Ordered Binary Decision Diagram. IEEE Access, 2017, vol. 5(99), pp.
1137-1145 https://doi.org/10.1109/ACCESS.2017.2651904
[4]Bollig, B. On the Minimization of (Complete) Ordered Binary Decision Diagrams. Theory
of Computing Systems, 2016, vol. 59(3), pp. 532-559
https://doi.org/10.1007/s00224-015-9657-x
[5]Brosenne, H. Homeister, M. Waack, S. Nondeterministic Ordered Binary Decision
Dia-grams with Repeated Tests and Various Modes of Acceptance. Information Processing Letters, 2017, vol. 98(1), pp. 6-10 https://doi.org/10.1016/j.ipl.2005.11.011
[6]Gubbi, J. Buyya, R. Marusic, S. Palaniswami, M. Internet of Things (IoT): A Vision,
Ar-chitectural Elements, and Future Directions. Future Generation Computer Systems, 2013, vol. 29(7), pp. 1645-1660 https://doi.org/10.1016/j.future.2013.01.010
[7]Perera, C. Zaslavsky, A. Christen, P. Georgakopoulos, D. Context Aware Computing for
The Internet of Things: A Survey. IEEE Communications Surveys & Tutorials, 2013, vol.
16(1), pp. 414-454 https://doi.org/10.1109/SURV.2013.042313.00197
[8]Al-Fuqaha, A. Guizani, M. Mohammad,i M. Aledhari, M. Ayyash, M. Internet of Things:
A Survey on Enabling Technologies, Protocols, and Applications. IEEE Communications Surveys & Tutorials, 2015, vol. 17(4), pp. 2347-2376 https://doi.org/10.1109/COMST.20 15.2444095
7
Author
Wei Guan, is associate professor at the Department of Computer Information En-gineering, Guangdong Polytechnic of Water Resources and Electric EnEn-gineering, Guangzhou 510635, China ([email protected]). His research interests include Internet of Things.