Reliability Computation with Perfect and Imperfect
Vertices via Binary Decision Diagram of a Computer
Communication Network
Dr. Manoj Singhal
Abstract— In today’s market the requirement of computer
communication network is increasing due to the exponential growth of internet. As a result traffic on computer communication network is increasing day by day. In this heavy traffic scenario, the nodes and the links may fail in any real computer communication network. Therefore reliability consideration is an important factor in computer communication network. In this paper I have found the reliability of a computer communication network represented in the form of a graph. Firstly I have considered that nodes in the graph are perfect and only communication links can fail with known probability. Secondly I have considered that the nodes and the edges of the graph are imperfect. It means nodes as well as communication links may fail with known probability.
Keywords—Binary Decision Diagrams (BDD), Computer communication Network (CNN), Directed Acyclic Graph (DAG), Modified Binary Decision Diagram (MBDD), Ordered Binary Decision Diagram (OBDD).
I. I
NTRODUCTIONNetwork reliability analysis receives considerable attention for the design, validation, and maintenance of many real world systems, such as computer, communication, or power networks. The components of a network are subject to random failures, as more and more
enterprises become dependent upon computer
communication network (CCN) or networked computing applications. Failure of a single component may directly affect the functioning of a network. So the probability of each component of a CCN is a crucial consideration while considering the reliability of a network. Hence the reliability consideration is an important factor in CCN [1]. The IEEE 90 standard defines the reliability as “the ability of a system or component to perform its required functions under stated conditions for a specified period of time.” Many algorithms have been presented to solve the problem of network reliability. These algorithms are based on the exact methods as well as the approximation methods [2, 3, 4]. Some of them are based on the min-paths/min-cuts methods. In these methods we first enumerate all the min-paths and min-cuts of the given CCN, and then these min-paths/min-cuts are manipulated to get their counterpart in the sum of disjoint product form. Min-cuts methods have been used since 1960 to compute the reliability of a network [5]. The authors [6] have shown that min-cuts based algorithms are more efficient then the min-paths based algorithms only for the networks where numbers of min-cuts are less than the number of min-paths. However the number of min-paths/min-cuts
increases. It is impractical to enumerate all the min-paths/min-cuts of a very large network. Some of the others are based on the factoring theorem [7, 8]. Moskowitz was the first to use the factoring theorem directly to compute the reliability of a network [9]. The factoring theorem divides the reliability problems into two sub problems and the formula is given below:
R(G) = Pe. R(G/ edge e functions) +
(1–pe) . R(G/edge e fail) ---(1)
This factoring formula must be applied only when there is no reduction on the graph is possible. It has shown that the optimal binary structure of the factoring algorithm for undirected networks can be generated by means of pivoting. Before applying the factoring, we must apply the reduction techniques like polygon to chain or series-parallel [10]. If a network has imperfect nodes as well as imperfect links, then such type of structure will increase the complexity to compute the reliability of the network. The most commonly used method for nodes failure is incident edge substitution [11]. In this method, for an edge ei, we put vieivjin the min-path function for the perfect
nodes, because if we consider an edge ei, then this edge
must contains two end vertices say viand vj. So we have to
simplify the Boolean function. The min-path function for the perfect nodes is the union of all min-paths from source to sink. By performing such type of operations we need large memory. One more feasible solution is to slightly change the probability function used in the factoring theorem and factor on links that have at least one end point [12]. The authors [13] have shown an efficient and exact method to compute the reliability of a network with imperfect vertices. One other method was shown by Xing with imperfect coverage and common cause failure [14]. One other author has tried to convert an undirected network in to a directed network and then compute the reliability of a network. This algorithm generates result with minor errors within reasonable time. This algorithm also generates bad result for some networks. This has been shown by Y. Chen [15]. One of the others algorithm is the brute-force algorithm. It uses the path function and have presented by V. A. Netes [16].
This paper is organized as follows. First, I give a brief introduction to Binary decision diagrams (BDD) in section II. Then, in section III I have define three types of network reliability. In section IV, I have proposed the description of our method for computing network reliability by using BDD. In section V, I have shown the experimental results. Finally I draw some conclusions in section VI.
II. B
INARYD
ECISIOND
IAGRAMAkers [17] first introduced BDD to represent Boolean functions i.e. a BDD is a data structure used to represent a Boolean Function. Bryant [18] popularized the use of BDD by introducing a set of algorithms for efficient construction and manipulation of BDD structure. The BDD structure provides compact representations of Boolean expressions. A BDD is a directed acyclic graph (DAG) based on the Shannon decomposition. The Shannon decomposition for a Boolean function is defined as follows:
f = x. fx = 1+x. fx = 0 --- (2)
where x is one of the decision variables, and f is the Boolean function evaluated at x = i.
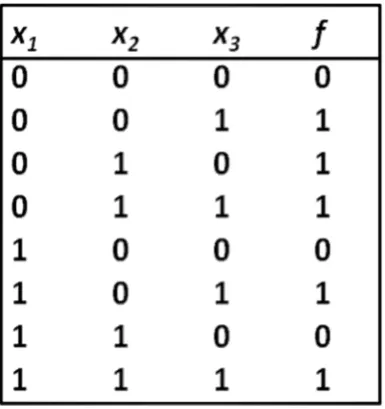
By using Shannon’s decomposition, any Boolean expression can be transformed in to binary tree. The authors [19] have shown a method to minimize Boolean expression with sum of disjoint product functions by using BDD. BDD are used to work out the terminal reliability of the links. In the network reliability framework, Sekine & Imai [20] have shown how to functionally construct the corresponding BDD. The authors [21] have shown an alternate approach to find the network reliability by using BDD. Table 1 shows the truth table of Boolean function f and its corresponding Shannon’s tree is shown in figure 1.
Table 1: Truth table of a Boolean Function f
Fig.1. Corresponding Shannon Tree
Sink nodes are labeled either with 0, or with 1, representing the two corresponding constant expressions. Each internal node u is labeled with a Boolean variable var(u), and has two out-edges called 0-edge, and 1-edge. The node linked by the 1-edge represents the Boolean expression when xi= 1 , i.e. fxi = 1; while the node linked
by the 0-edge represents the Boolean expression when xi=
0, i.e. fxi=0. The two outgoing edges are given by two
Fig.2. Shrinking Process
Indeed, such representation is space consuming. It is possible to shrink by using following three postulates.
Remove Duplicate Terminals:
Delete all but one terminal vertex with a given label, and redirect all arcs into the deleted vertices to the remaining one.Delete Redundant Non Terminals:
If non terminal vertices u, and v have var(u) = var(v), low(u) = low(v), and high(u) = high(v), then delete one of the two vertices, and redirect all incoming arcs to the other vertex.Delete Duplicate Tests:
If non terminal vertex v has low(v) = high(v), then delete v, and redirect all incoming arcs to low(v).If we apply all these three rules then the decision tree can be reduced. The shrinking process is shown in figure 2.
A. Ordered Binary Decision Diagram
For an ordered BDD (OBDD), we impose a total ordering ≺ over the set of variables and require that for any vertex u, and either non terminal child v, their respective variables must be ordered. The authors [22, 23] have shown two different methods to find the reliability of the network by using OBDD.
B. Dual Binary Decision Diagram
If two or more BDD have the same size and representing the same Boolean function, then these BDD are known as Dual BDD, because they are Dual of each other. The size of the BDD means the total number of non terminal vertices and the number of non terminal vertices at particular level [24]. A particular sequence of variables is known as a variable ordering. It has been observed that the size of the BDD strongly depends on the ordering of variables [25]. There are three types of variable ordering (optimal, good and bad) depending on the size of the different BDD [26]. An ordering is said to be optimal if it generates the minimum size BDD. A new approach for finding various optimal variable ordering to generate
has shown the process how to improve the reliability of a network by using augmented BDD [28, 29].
C. Modified Binary Decision Diagram
The modified binary decision diagram (MBDD) is a binary decision diagram which is either dual BDD or the smaller size BDD. [30].
III. N
ETWORKR
ELIABILITYThe reliability of a network G is the probability that G supports a given operation. We distinguish three kinds of operation and hence three kind of reliability [31].
Two Terminal Reliability:
It is the probability that two given vertices, called the source and the sink, can communicate. It is also called the terminal-pair reliability [32].K Terminal reliability:
When the operation requires only a few vertices, a subset k of N(G), to communicate each other, this is K terminal reliability [33].All Terminal Reliability:
When the operation requires that each pair of vertices is able to communicate via at least one operational path, this is all terminal reliability. We can see that 2-terminal reliability and all terminal reliability are the particular case of K-terminal reliability.IV. C
OMPUTATION OFN
ETWORKR
ELIABILITYFig.3. A Directed Network
Let us suppose that all the nodes are perfect and only the edge can fail with known probability say 0.9. Since it is a disjoint network containing two disjoint min-paths, therefore !2 optimal variable ordering are possible to generate minimum size BDD [34].
Our algorithm executes in three main steps.
1. Order the link by applying a good heuristic approach. 2. Generate the BDD by min-path function for the
perfect vertices as well as for imperfect vertices. 3. Apply Shannon’s decomposition to compute the
reliability.
By applying our heuristic approach, I have found the ordering of variables. These orderings are e1< e2< e3and
e3< e1< e2.
The min-path function R for perfect nodes is the union of all min-paths from source to sink and is given below:
R = H1U H2 ---(3)
The computation of the probability of the BDD can be calculated recursively by resorting to the Shannon decomposition.
Pr{F}= p1Pr{Fx1=1}+(1 − p1)Pr{Fx1=0}= Pr{Fx1=0}+
p1(Pr{Fx1=1}−Pr{Fx1=0}) ---(4)
where p1is the probability of the Boolean variable x1to be
true and (1− p1) is the probability of the Boolean variable
x1to be false.
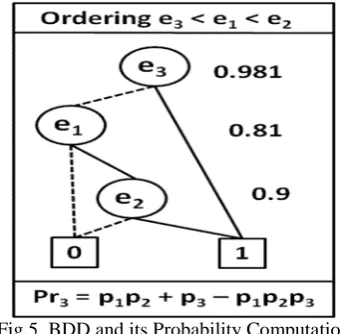
The BDD and its probability computation for two different variable orderings are shown in figure 4 and figure 5 respectively.
Fig.4. BDD and its Probability Computation (Perfect Nodes)
Fig.5. BDD and its Probability Computation (Perfect Nodes)
The BDD shown in figure 4 and figure 5 are known as OBDD, because the communication links are ordered by two different orderings. These BDD are also called dual binary decision diagrams, because they are dual of each other and they are of same size and representing the same Boolean function. Here I have found that the reliability obtained by these dual BDD is equal.
Now I will find the reliability of the given CCN by considering that the nodes and links may fail with known probability say 0.9.
By applying our heuristic approach, the two different orderings are as follows:
S < e1< n < e2< e3< T and S < e3< e1< n < e2< T.
Again I have to build the reliability function with imperfect nodes. This will be done by substituting vieivj
for the edge ei in the path function of perfect nodes
because an edge always contains two end vertices. . The BDD and its probability computation are shown in figure 6 and figure 7 for two different orderings.
Fig.7. BDD and its Probability Computation (Imperfect nodes)
Similarly the BDD shown in figure 6 and figure 7 are dual of each other and reliability results are same.
V. E
XPERIMENTALR
ESULTSOur program is written in the C language and computations are done by using a Pentium 4 processor with 512 MB of RAM. The computation speed heavily depends on the variables ordering because the size of the BDD heavily depends on the variable ordering. The size of BDD means the total number of nodes in the BDD and number of nodes in a particular level. I have found that the reliability obtained by dual BDD is same.
VI. C
ONCLUSIONIn a real network the nodes and link may fail. The complexity of the reliability analysis will grow exponentially if the nodes of the network are imperfect. I have computed the reliability of a CCN by BDD for perfect and imperfect vertices by two different variable ordering. The reliability obtained by the two different variable ordering are same (for perfect vertices) and is 0.981. The reliability obtained for imperfect vertices is same and is 0.788049.
R
EFERENCES[1] A. Rauzy (1993), “New algorithms for fault tolerant trees analysis”,Reliability Engineering and System Safety, vol. 5, no. 59, pp. 203–211.
[2] Andrea Bobbio, Caterina Ferraris, Roberta Terruggia (2006), “New Challenges in Network Reliability Analysis”, Technical Report, pp. 1-8, TR-INF-UNIPMN.
[3] C. Lucet and J.-F. Manouvrier (1999), “Exact methods to compute network reliability”, in Statistical and Probabilistic Models in Reliability, D. C. Ionescu and N. Limnios, Eds. Birkhauser Boston, pp. 279–294.
[4] D. Torrieri (1994), “Calculation of node-pair reliability in large networks with unreliable nodes,”IEEE Trans. Reliability, vol. 43, no. 3, pp. 375–377.
[5] P. A. Jensen and M. Bellmore (1969), “An algorithm to determine the reliability of a complex system,” IEEE Trans. Reliability, vol. 18, no. 4, pp. 169–174.
[6] Y. G. Chen and M. C. Yuang (1996) , “A cut-based method for terminal-pair reliability,”IEEE Trans. Reliability, vol. 45, no. 3, pp. 413–416.
[7] A. Satyanarayana and M. K. Chang (1983), “Network reliability and the factoring theorem,”Networks, vol. 13, pp. 107–120. [8] L.B. Page and J. E. Perry (1989), “Reliability of directed
networks using the factoring theorem”, IEEE Trans. Reliability 38: 556-562.
[9] F. Moskowitz (1958), “The analysis of redundancy networks,” AIEE Trans. Communications and Electronics, vol. 39, pp. 627– 632.
[10] M. Resende (1986), “A program for reliability evaluation of undirected networks via polygon-to-chain reductions,” IEEE Trans. Reliability, vol. 35, no. 1, pp. 24–29.
[11] K. K. Agarwal (1975), J.S. Gupta and K. B. Mishra, “A simple method for evaluation of a communication system”, IEEE Trans. Communication 23:563-566.
[12] O. Theologou and J. Carlier (1991), “Factoring and reductions for networks with imperfect vertices”,IEEE Trans. Reliability, vol. R-40, pp. 210–217.
[13] Sy-Yen Kuo, Fu-Min Yeh, and Hung-Yau Lin (2007), “Efficient and Exact Reliability Evaluation for Networks With Imperfect Vertices”, IEEE Transactions on Reliability, vol. 56, no. 2, pp.288-300.
[14] Liudong Xing (2008), “An Efficient Binary Decision Diagram Based Approach for Network Reliability and Sensitivity Analysis”, IEEE Trans. On Systems, Man and Cybernetics, pp. 105-115.
[15] Y. Chen, A. Q. Hu, K. W. Yip, X. Hu, and Z. G. Zhong (2003), “A modified combined method for computing terminal-pair reliability in networks with unreliable nodes,” inProceedings of the 2nd Int’l Conference onMachine Learning and Cybernetics, , pp. 2426–2429.
[16] V. A. Netes and B. P. Fillin (1996), “Consideration of node failure in network reliability calculations”, IEEE Trans. Reliability 45: 127-128.
[17] B. Akers (1992), “Binary decision diagrams”, IEEE Trans. Computers, vol. C-27, pp.509–516, 1978.
[18] R. E. Bryant, “Symbolic Boolean manipulation with ordered binary-decision diagrams”,ACM Computing Surveys, vol. 24, no. 3, pp. 293–318.
[19] D. Sensarma, S. Naskar and S. S. Sarma (2012), “On An Optimization Technique using Binary Decision Diagram”, IJCSEA, Vol.2 No. 1, pp73-86
[20] H. Imai, K. Sekine, and K. Imai (1999), “Computational investigations of all terminal network reliability via BDDs”, IEICE Transactions on Fundamentals, vol. E82-A, no. 5, pp.714–721.
[21] Manoj Singhal, R. K. Chauhan, Girish Sharma(2010) , “An alternate approach to compute the reliability of a computer communication network using Binary Decision Diagrams”, Communications in Computer and Information Science, pp. 160-170, IC3 2010, Springer-Verlag Berlin Heidelberg.
[22] F. Yeh, S. Lu, and S. Kuo (2002), “OBDD-based evaluation of k-terminal network reliability”,IEEE Trans. Reliability, vol. R-51, no. 4, pp. 443-451.
[23] F. M. Yeh, and S. Y .Kuo (1997), “OBDD based network reliability calculation”, IEEE Electronics Letter 33(9) : 759-760. [24] Manoj Singhal, R. K. Chauhan, , Girish Sharma (2010), “A New
Advanced Networking and Applications. Vol. 1 issue 4. pp. 230-235.
[25] Manoj Singhal, R. K. Chauhan, , Girish Sharma (2010), “Effects of Variable Ordering on Binary Decision Diagrams for Computation of Reliability of a Computer Communication Network”, Journal of Computer Science, Vol. 4, issue 6, pp. 1837-1845.
[26 ] Manoj Singhal, R. K. Chauhan, Girish Sharma (2010),“Network Reliability Computation using Different Binary Decision Diagrams“, International Journal of Distributed and Parallel Systems, Vol. 1, No. 1, pp. 82-91.
[27] Manoj Singhal, R. K. Chauhan, Girish Sharma (2011), “A New approach for finding the Various Optimal Variable Ordering to generate the Binary Decision Diagrams (BDD) of a Computer Communication Network”, International Journal of Computer Applications, Vol. 31, No.3, pp. 1-8.
[28] J. U. Herrmann (2009), "On Augmented OBDD and Performability for Sensor Networks," Int'l J. Performability Engineering, accepted for publication 2009.
[29] J. U. Herrmann (2010), “Improving Reliability Calculation with Augmented Binary Decision Diagrams”, IEEE International Conference on Advanced Information Networking and Applications, pp. 328-333.
[30] ManojSinghal, R. K. Chauhan, Girish Sharma (2009), “Use of Modified Binary Decision Diagrams in Reliability Evaluation of a Directed Computer Communication Network”, The Icfai University Journal of Computer Sciences, Vol. III No. 3, pp. 22-30.
[31] G. Hardy, C. Lucet, and N. Limnios (2005), “Computing all-terminal reliability of stochastic networks with binary decision diagrams”, in Proc.11th International Symposium on Applied Stochastic Models and Data Analysi, pp. 1468-1473.
[32] S. Kuo, S. Lu, F. Yeh (1999), “Determining terminal pair reliability based on edge expansion diagrams using OBDD”, IEEE Trans. Reliability, Vol. 48, no. 3, pp. 234-246.
[33] Gary Hardy, Corinee Lucet and Nikolaos Limnios (2007), “K-Terminal Network reliability Measures with Binary Decision Diagrams”, IEEE Tran. On Reliability Vol.56, No. 3.
[34] Singhal, Manoj, Chauhan R. K., Sharma, Girish.: “Binary Decision Diagrams and Its Variable Ordering for Disjoint Network”, International Journal of Advanced Networking and Applications”,Vol. 3, issue 6, pp. 1430–1437, May-June 2012.