Radiative transfer models (RTMs) for field phenotyping inversion
of rice based on UAV hyperspectral remote sensing
Yu Fenghua
1,
Xu Tongyu
1,2*,
Du Wen
1,
Ma Hang
1,
Zhang Guosheng
1,
Chen Chunling
1,2(1. College of Information and Electrical Engineering, Shenyang Agricultural University, Shenyang 110866, China; 2. Liaoning Engineering Research Center for Information Technology in Agriculture, Shenyang 110866, China)
Abstract: The nondestructive and rapid acquisition of rice field phenotyping information is very important for the precision
management of the rice growth process. In this research, the phenotyping information LAI (leaf area index), leaf chlorophyll content (Cab), canopy water content (Cw), and dry matter content (Cdm) of rice was inversed based on the hyperspectral remote
sensing technology of an unmanned aerial vehicle (UAV). The improved Sobol global sensitivity analysis (GSA) method was used to analyze the input parameters of the PROSAIL model in the spectral band range of 400-1100 nm, which was obtained by hyperspectral remote sensing by the UAV. The results show that Cab mainly affects the spectrum on 400-780 nm band, Cdm
on 760-1000 nm band, Cw on 900-1100 nm band, and LAI on the entire band. The hyperspectral data of the 400-1100 nm
band of the rice canopy were acquired by using the M600 UAV remote sensing platform, and the radiance calibration was converted to the canopy emission rate. In combination with the PROSAIL model, the particle swarm optimization algorithm was used to retrieve rice phenotyping information by constructing the cost function. The results showed the following: (1) an accuracy of R2=0.833 and RMSE=0.0969, where RMSE denotes root-mean-square error, was obtained for C
ab retrieval;
R2=0.816 and RMSE=0.1012 for LAI inversion; R2=0.793 and RMSE=0.1084 for Cdm; and R2=0.665 and RMSE=0.1325 for Cw.
The Cw inversion accuracy was not particularly high. (2) The same band will be affected by multiple parameters at the same time.
(3) This study adopted the rice phenotyping information inversion method to expand the rice hyperspectral information acquisition field of a UAV based on the phenotypic information retrieval accuracy using a high level of field spectral radiometric accuracy. The inversion method featured a good mechanism, high universality, and easy implementation, which can provide a reference for nondestructive and rapid inversion of rice biochemical parameters using UAV hyperspectral remote sensing.
Keywords: UAV, rice phenotyping inversion, hyperspectral remote sensing, PROSAIL model, global sensitivity analysis,
precision management
DOI: 10.25165/j.ijabe.20171004.3076
Citation: Yu F H, Xu T Y, Du W, Ma H, Zhang G S, Chen C L. Radiative transfer models (RTMs) for field phenotyping
inversion of rice based on UAV hyperspectral remote sensing. Int J Agric & Biol Eng, 2017; 10(4): 150–157.
1 Introduction
Rice is the world’s most important staple crop for
Received date: 2016-12-02 Accepted date: 2017-04-18 Biographies: Yu Fenghua, PhD candidate, research interest:
agricultural remote sensing, Email: [email protected]; Du Wen,
PhD candidate, research interest: agricultural remote sensing, Email: [email protected]; Ma Hang, Master student, research interest: agricultural remote sensing, Email: [email protected];
Zhang Guosheng, Master student, research interest: agricultural
remote sensing, Email: [email protected]; Chen Chunling,
PhD, Associate Professor, research interest: agricultural remote sensing, Email: [email protected].
*Corresponding author: Xu Tongyu, PhD, Professor, research
interest: agricultural remote sensing, College of Information and Electrical Engineering, Shenyang Agricultural University, Shenyang 110866, China. Email: [email protected].
July, 2017 Yu F H, et al. Radiative transfer models (RTMs) for field phenotyping inversion of rice Vol. 10 No.4 151 agricultural topic both domestically in China and
internationally. Unmanned aerial vehicle (UAV) remote sensing technology is a type of detection technology that was a product of the development of space and computer technology. The ability to apply rapid, nondestructive, large-area synchronous detection technology to the collection of rice-growing and rice-growth information, to obtain rice-growth status, has important significance to guiding the precise informatization of rice production[2,3]. At present, UAV remote sensing technology is a hot research field, and it has been widely used to monitor the dynamic change of farmland, forestry, facilities, and other resources by analyzing the remote sensing data collected by UAVs. A large field of rice-yield estimation by remote sensing, along with pest monitoring and an agricultural remote sensing monitoring information system, has been established. The development and application of UAV and remote sensing technology has made rice production and research transition from the use of traditional methods to a new stage of quantitative precision agriculture[4].
A UAV platform equipped with satellite remote sensing can obtain more abundant agricultural remote sensing data, with better precision and greater dimensional precision than traditional satellite remote sensing. However, since the micro-UAV platform is directly involved in the data collection process, it may itself have a certain impact on the data collection. Therefore, effectively maximizing UAV remote sensing data acquisition and agricultural agronomic parameter inversion accuracy is the key to using the micro-UAV remote sensing research platform for agriculture[5].
Calderón et al.[6] used Ciganda and other near-infrared reflectance spectroscopy techniques to establish the relationship between the maize leaf and canopy, and thereby the chlorophyll content of maize leaves was retrieved. By obtaining the canopy spectral information of wheat, Atzberge was able to obtain a better model accuracy (R2=0.82) using partial least-squares regression
(PLS) to establish the NDVI and canopy chlorophyll models[7,8]. Swain[9] used UAV remote sensing inversion to determine rice yield and total biomass. NDVI has been used for regression analysis in the young
panicle differentiation stage to estimate rice yield and total biomass, and in the fitting the R2 accuracy of the
model was 0.728 and 0.760, respectively. These results show that using high-resolution remote sensing data acquired by a micro-UAV remote sensing system to determine the yield and biomass inversion of a rice-growing area over a good range is viable, and, moreover, reduces the level of error introduced by satellite remote sensing. In some studies, some scholars have used the GNDVI vegetation index to retrieve the LAI, and the accuracy of the inversion model (R2=0.65)
can also be used to detect the LAI via UAV remote sensing. A UAV equipped with a variety of spectrometers for remote sensing monitoring of rice, can obtain spectral information of a series of corresponding crop, agronomic parameter inversion, but including some crop spectral analysis strains with high, plant type, internal temperature information is not the optimal way[10-13].
In the research described in this paper, a UAV equipped with a hyperspectral imaging camera was used to gather rice canopy spectral information. The sensitive band of PROSAIL input parameters was obtained by global sensitivity analysis (GSA), using the particle swarm optimization (PSO) algorithm of the PROSAIL model, the PROSAIL simulation model of rice canopy spectral information, and the actual measured canopy spectral information in order to obtain the smallest difference in rice the chlorophyll concentration (Cab), the
equivalent water thickness (Cw), the dry matter content
(Cdm), and the leaf area index (LAI), comprising the four
parameters for determining the growth response of rice.
2 Materials and methods
2.1 Testing site
Figure 1 Test site: Japonica rice experiment field at Shenyang Agricultural University, 2016
2.2 Instruments and equipment
A hyperspectral imaging camera (Gaiasky-mini) equipped with an incident light sensor (Dualix Spectral Imaging, Inc., China) is used to collect the remote sensing images of the Japonica rice canopy (Figure 2). There are 256 channels in the hyperspectral camera. The spectral range of the hyperspectral imager is 400- 1100 nm and its spectral resolution is 3.5 nm. The imaging method of the spectrometer is built-in push broom. The images were acquired with 16-bit radiometric resolution[14].
Figure 2 UAV-M600 and Gaiasky-mini hyperspectral imaging camera
The platform for hyperspectral image acquisition is a six-rotor UAV (M600, DJI, China). The UAV can lift 6.5 kg and has a flight time of approximately 20 min. In order to eliminate the effects of vibration in the spectral image acquisition process, the UAV was equipped with a RONIN-MX attitude control system.
2.3 Hyperspectral image and rice sample collection
Hyperspectral images of Japonica rice were collected by the airborne acquisition system between 11:30 and 13:30 on July 28, 2016. The scene of the experiment is
shown in Figure 3. The UAV flew at an altitude of 50 m above the rice canopy. After hyperspectral image collection, 36 Japonica rice leaves were collected from the canopy in an area measuring 1 m2 of each experimental plot and stored immediately in refrigerated containers for biophysical parameter analysis (Cab, Cw,
Cdm, and LAI).
Figure 3 Scene of experiment
2.4 Japonica rice biophysical parameter collection
2.4.1 Cw and Cdm measurement of rice leaves
In the laboratory, the fresh weight and area of rice leaves were measured. Rice leaf samples were cleaned and immediately placed into a 105ºC oven for 30 min to inactivate enzymes. The rice leaf samples were then dried at 65°C for 72 h or more until the quality of rice leaves was consistent[15-17]. The quality criterion was
Cdm. The EWT Equation is:
CW =(LFWC−LDWC)/LA (1) where, LFWC represents the quality of fresh leaves of Japonica rice and LDWC and LA the quality of dried leaves of Japonica rice and the total area of Japonica rice samples, respectively.
2.4.2 Cab measurement of rice leaves
July, 2017 Yu F H, et al. Radiative transfer models (RTMs) for field phenotyping inversion of rice Vol. 10 No.4 153 were performed in triplicate under a green light. The
pigments were separated by reverse-phase HPLC using a Hewlett-Packard HP 1100 liquid chromatograph. Separation was performed using an elution gradient with the mobile phases: water/ion pair reagent/methanol (1/1/8, v/v/v) and methanol/acetone (1/1, v/v). The ion pair reagent was 0.05 M tetrabutylammonium and 1 M ammonium acetate in water[18-20]. Sequential detection was performed with a photodiode array detector at 410 nm, 430 nm, 450 nm and 666 nm, respectively. Data were collected and processed with a LC HP ChemStation (Rev.A.05.04). Pigments were identified by co-chromatography with authentic samples and from their spectral characteristics.
2.4.3 LAI measurement of rice leaves
LAI measurement of rice leaves was performed using a pair of LAI-2200C sensors. Accurate measurement of rice canopy transmission requires simultaneous measurements of sky brightness to be taken above (A readings) and below (B readings) the canopy, while viewing the same region of sky[21]. The height of the canopy in our study required all of the A readings to be obtained using a sensor located in one of the identified clearings. The sensors were matched using the recommended method and synchronized to GPS time at the start of every time period. The reference sensor was placed on a leveled 2.7 m high tripod and set to obtain A readings every 30 s. All clearings provided unobstructed views of the sky, but 180° view caps were fitted to both sensors to exclude the sun and operator from view.
2.5 PROSAIL models
The PROSAIL model, coupled with the PROSPECT and SAIL models, is one of the most widely used radiative transfer models, and it is often used to invert biochemical parameters[22]. The PROSPECT model is based on leaf scale, and can be used to simulate the reflectivity and transmittance of leaf blades. The SAIL model uses the vegetation canopy as the scale. It takes the output of the PROSPECT model as its input variable, along with leaf distribution function, solar zenith angle, soil background and other factors. Therefore, the PROSAIL model can be used to establish the relationship
between the plant canopy spectrum and the LAI, the concentration of biochemical substances in leaves, and the quantitative relationship between soils. The main input variables are shown in Table 1.
Table 1 Partial input parameters of PROSAIL model
Model Parameter Meaning Range of values
N leaf structure parameter 1-4
Cab/ug·cm-2 chlorophyll concentration 20-80
Car/ug·cm-2 carotenoid concentration 4-17
Cm/g·cm-2 dry matter content 0.002-2.00
PROSPECT
Cw/cm equivalent water thickness 0.0005-0.04
LAI leaf area index 1-5
ALA/(º) average leaf angle 20-50
SL hot spot 0.01-1
Skyl sky diffuse reflection ratio 0.01-0.4 tto/(º) observed zenith angle −50-50 SAIL
tts/(º) solar zenith angle −50-50
2.6 Global sensitivity analysis
PROSAIL models vary in design, complexity, number of input variables, and processing speed. Not all PROSAIL input variables play an equally important role; they are also spectrally dependent. For the larger majority of remote sensing applications there is no need to vary all of the variables. Global sensitivity analysis (GSA) techniques, which quantify the relative importance of each input parameter to PROSAIL outputs, can help set safe default values for those less influential input parameters. GSA can greatly simplify model calibration by enabling the most influential parameters to be targeted for data acquisition and refinement[23].
Sobol is the most popular variance-based method for GSA. This modification has been demonstrated to be effective in identifying the so-called Sobol sensitivity indices. These indices quantify both the main sensitivity effects (first-order effects) (the contribution to the variance of the PROSAIL output by each input variable) and total sensitivity effects (the first-order effect plus interactions with other input variables) of the input variables. Formally, given a model Y = f(X), where Y is
the model output, X = (X1, X2,…, Xk) is the input parameter vector. A variance decomposition of f
suggested by Sobol is:
1,...,
1 1 1
( ) k i k k ij... k
i i j i
V Y V V v
= = = +
=
∑
+∑ ∑
+ (2)Ωk=|
X|0≤Xi≤1, i=1,…,k}; V(Y) is the total unconditional
variance; Vi is the partial variance or “main effect” of Xi
on Y and is given by Vi= V[E(Y|Xi)]; and Vij is the joint
impact of Xi and Xj on the total variance minus their
first-order effects. Here, the first-order sensitivity index
Si and total effect sensitivity index STi are:
[ ( | )]
( ) ( )
i i
i
V V E Y X
S
V Y V Y
= = (3)
[ ( | )]
...
( )
i
Ti i ij
j i
E V Y X
S S S
V Y
≠
= +
∑
+ = ∼ (4)2.7 Modeling and model evaluation
2.7.1 Hyperspectral data assimilation
In this study, the PSO algorithm was used to optimize the differences between the hyperspectral observations of the rice canopy and the PROSAIL simulation, and to minimize the difference between the simulated and observed values[24]. The PSO algorithm is simple and easy to apply and, using it, the solution of the problem to be optimized is represented by the position coordinates of the particle, and the current optimal solution (the optimal value) and the current optimal solution of the entire particle population are tracked by the particle[25].
2.7.2 Model evaluation
The model’s performance was mainly evaluated by the following indices: the correlation coefficients of the calibration (R2) and the root-mean-square error (RMSE).
The best model should have a maximum value of R2 and
a minimum value of the RMSE.
3 Results and discussion
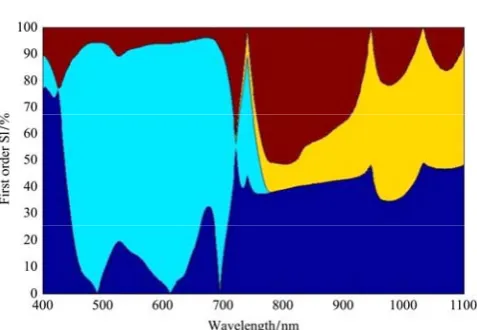
3.1 GSA reflectance results
Five thousand subsamples were used for the GSA. Since its efficiency is relatively slow, it takes 1258 s to analyze the four input parameters (LAI, Cw, Cab and Cdm)
of the PROSAIL model. The Sobol total order sensitivity index (STi) results for the PROSAIL model
across the 400-1100 nm region are shown in Figure 4. Despite the large number of PROSAIL input variables, some variables can be obtained directly. Hence, the majority of variables related to micrometeorology and plant physiology have no impact on reflectance. Variables that can be measured directly include hotspot, soil reflectance and leaf structural parameters.
Figure 4 GSA total sensitivity index (STi) for PROSAIL
reflectance
Figure 5 GSA first-order sensitivity index (Si) for PROSAIL
reflectance
As can be seen from Figures 4 and 5, the total sensitivity of the main parameters is different in different wave bands. The canopy reflectance at 400-750 nm was mainly affected by the chlorophyll content, and the total sensitivity of the chlorophyll content to the canopy reflectance was approximately 80%. Almost all of the vegetation indices related to chlorophyll retrieval are within this range. The Cw only affects the spectral band
over 800 nm. In the near-infrared (NIR) band of 800- 1100 nm, Cw, Cdm, and LAI are the three most important
parameters affecting the canopy reflectance, and the total sensitivity of the three parameters is approximately 95%. For the LAI and Cdm, the spectrum is affected within the
range of 400-1100 nm.
3.2 Japonica rice biophysical variable retrieval
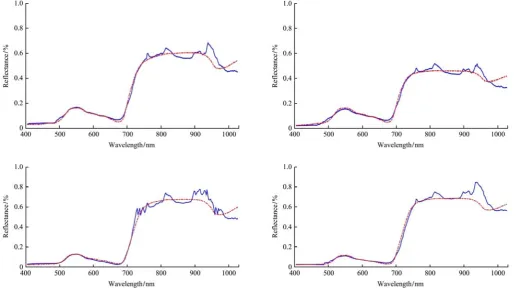
Figure 6 shows the average R2 performance of the
PSO methods over 10 runs against validation data. The dashed line represents the R2 accuracy of the full
July, 2017 Yu F H, et al. Radiative transfer models (RTMs) for field phenotyping inversion of rice Vol. 10 No.4 155 PROSAIL model.
Table 2 Accuracy of the four PROSAIL model parameters
Biophysical variable R2 RMSE
LAI 0.816 0.1012
Cw 0.665 0.1325
Cdm 0.793 0.1084
Cab 0.833 0.0969
From the Table 2, it is seen that the accuracy of chlorophyll is the best (R2=0.833, RMSE=0.0969), which
is mainly because the main chlorophyll sensitive band is between 450-750 nm, and the boundary noise of the hyperspectral image of the band in the range 400- 1100 nm between the two bands is relatively large, and
has a low signal-to-noise (SNR) ratio, which affects the accuracy of data inversion. When the chlorophyll sensitive band is in the central part of the entire band, the SNR of the hyperspectral remote sensing data is better. The accuracy of Cw is the worst because the sensitive
band of water is below 800 nm, and the SNR of the hyperspectral information of the rice canopy at 800- 1100 nm is low, which affected the assimilation effect of
Cw. The change of LAI and Cdm affects the whole band
in the range 400-1100 nm, and there is no obvious characteristic band, so the accuracy of inversion effect is greatly affected by other parameters.
Red line: PSO Simulation of the spectral curve. Blue line: The actual measured spectral curve.
Figure 6 Simulated and actual spectral curves after assimilation by PSO algorithm
4 Discussion
Low-altitude hyperspectral remote sensing of Japonica rice by a UAV has the advantages of high efficiency, high image resolution, low cost, and the ability to obtain multiscale and temporal ground remote sensing data. It provides us with a more efficient technique for real-time monitoring of the rice field. Rice is the most important food crop in the world and the leaves in its canopy are more complex. The different distribution, different angles, and different nutrition of
radiometric calibration was performed every 5 min. The hyperspectral remote sensing data collected by the UAV was mainly used for accurate retrieval of the input biophysical parameters of the PROSAIL model. Since the PROSAIL model is complex, a model parameter sensitivity analysis was performed to quantitatively evaluate the influence of each input parameter on the output results. Determining the main effect of different band parameters is the goal of an effective application. In this study, we used GSA to analyze the input parameters of the PROSAIL model. Sensitivity analysis methods can be divided into local and global types. Local sensitivity analysis was carried out within the range of single parameter variation, and the effect of coupling between parameters is neglected, which is difficult to apply in the study of a complex nonlinear model. GSA is used to analyze the changes over the entire range of parameters, and considering the influence of the coupling between different parameters on the output of the model, GSA is very suitable for a complex nonlinear model, and is thus widely used. The PROSAIL model showed that images in the range 400-1100 nm were affected by multiple factors at the same time. The process of this research, through sensitivity analysis, showed that any one band is affected by many variables, so pathological inversion is carried out; that is, different parameters corresponding to the same spectral curve are combined. The data assimilation method was used in this research, and although it was relatively easy to achieve, to reduce the problem of pathological inversion, traditional knowledge from agricultural experience was needed as well.
In this experiment, a manually selected region of interest was used from the remote sensing image in ENVI, which had a negative effect on obtaining better prediction accuracy and fast extraction of spectral information. This is a key issue that needs to be addressed in future studies.
5 Conclusions
Our studies demonstrated that using UAV hyperspectral remote sensing technology combined with the PROSAIL model was able to retrieve the physiological parameters
of rice. The rice canopy hyperspectral data in the range 400-1100 nm were acquired using the M600 UAV remote sensing platform, and the radiance calibration was converted to the canopy emission rate. In combination with the PROSAIL model, the PSO algorithm was used to retrieve rice phenotyping information by constructing the cost function. The results showed the following:
(1) The Cab retrieval accuracy was R2=0.833 and
RMSE=0.0969, the LAI inversion accuracy was R2=0.816
and RMSE=0.1012, the Cdm inversion accuracy of was
R2=0.793 and RMSE=0.1084, and the Cw inversion
accuracy was R2=0.665 and RMSE=0.1325. As the
hyperspectral band in this study used 1000 nm or larger noise, the Cw inversion accuracy was not particularly
high.
(2) Because the same band is affected by multiple parameters at the same time, the problem of inversion of phenotyping information occurs when using this method.
(3) This study adopted a rice phenotyping information inversion method to acquire rice hyperspectral information by a UAV based on the phenotypic information retrieval accuracy achieved owing to the high field spectral radiometric accuracy. In this study, UAV remote sensing and the PROSAIL model were combined to invert the phenotyping information of a rice field, which comprised a good mechanism, high universality, and easy implementation. This study provides a theoretical basis for nondestructive and rapid inversion of rice biochemical parameters using UAV hyperspectral remote sensing.
Acknowledgements
The authors gratefully acknowledge the support of the National Key Research and Development Plan of China (Grant No. 2016YFD020060307), Key Project of Education Department of Liaoning province (LSNZD201605).
[References]
July, 2017 Yu F H, et al. Radiative transfer models (RTMs) for field phenotyping inversion of rice Vol. 10 No.4 157 Eng, 2016; 9(5): 132–142.
[2] Li F, Victor A, Zhao H, Zhao Y J, Cui X F. PLSR-based airborne hyperspectral remote sensing retrieval of leaf nitrogen content in potato fields. Chinese Journal of Agrometeorology, 2014; 35(3): 338–343. (in Chinese)
[3] Zang Y, Gu X Y, Zhou Z Y, Luo X W, Zang Y, Qi X Y, et al. Review of tensairity and its applications in agricultural aviation. Int J Agric & Biol Eng, 2016; 9(3): 1-14.
[4] Gutierrez M. Effect of leaf and spike morphological traits on the relationship between spectral reflectance indices and yield in wheat. International Journal of Remote Sensing, 2015; 36(3): 701–718.
[5] Wu B F, Gommes R, Zhang M, Zeng H W, Yan N N, Zou W T, et al. Global crop monitoring: a satellite-based hierarchical approach. Remote Sensing, 2015; 7(4): 3907–3933.
[6] Calderón R, Navas-Cortés J A, Lucena C, Zarco-Tejada P J. High-resolution airborne hyperspectral and thermal imagery for early detection of Verticillium wilt of olive using fluorescence, temperature and narrow-band spectral indices. Remote Sensing of Environment, 2013; 139(23): 231–245. [7] Huang Y, Thomson S J, Brand H J, Reddy K N.
Development of low-altitude remote sensing systems for crop production management. Int J Agric & Biol Eng, 2016; 9(4): 1–11.
[8] Zhang P, Deng L, Lyu Q, He S L, Yi S L, Liu Y D, et al. Effects of citrus tree-shape and spraying height of small unmanned aerial vehicle on droplet distribution. Int J Agric & Biol Eng, 2016; 9(4): 45–52.
[9] Chunhua Z, John M. The application of small unmanned aerial systems for precision agriculture: a review. Precision Agriculture, 2012; 12(13): 693-712.
[10] Xue X Y, Tu K, Qin W C, Lan Y B, Zhang H H. Drift and deposition of ultra-low altitude and low volume application in paddy field. Int J Agric & Biol Eng, 2014; 7(4): 23–28. [11] Zhou Y, Hao J P, Zheng J. The development and research
trend of beam string structure exploration. Industrial Building, 2013; 8(5): 155–160. (in Chinese)
[12] Verrelst J, Dethier S, Rivera J P, Munoz-Mari J, Camps-Valls G, Moreno J. Active learning methods for efficient hybrid biophysical variable retrieval. IEEE Geoscience and Remote Sensing Letters, 2016; 13(6): 1012–1016.
[13] Verrelst J, Rivera J P, Moreno J. ARTMO's global sensitivity analysis (GSA) toolbox to quantify driving variables of leaf and canopy radiative transfer models. EARSeL eProceedings, Speical Issue 2: 9th EARSeL Imaging
Spectroscopy Workshop, 2015; pp.1-11
[14] Verrelst J, Rivera J P, van der Tol C, Magnani F, Mohammed G, Moreno J. Global sensitivity analysis of the SCOPE model: What drives simulated canopy-leaving sun-induced fluorescence. Remote Sensing of Environment, 2016; 166(6): 8-21.
[15] Li X, Yu B, Xin L, Min T, Shi H. Canopy NDVI analysis and yield estimation for cotton in different nitrogen treatments. Transactions of the CSAM, 2014; 45(7): 231–236. (in Chinese)
[16] Yang Y J. It is possible for unmanned aerial vehicle (UAV) fly into the billions of markets. Chinese Pesticide, 2015; 12: 48–55. (in Chinese)
[17] Yasin Z M, Rahman T K A, Zakaria Z. Optimal least squares support vector machines parameter selection in predicting the output of distributed generation. IEEE, 2014: 152–157.
[18] Luo X W. Thoughts on speeding up the development of agricultural aviation technology in China. Agriculture Technology & Equipment, 2014; 5: 7–15. (in Chinese) [19] Hunt E R, Doraiswamy P C, Mcmurtrey J E, Daughtry C S T,
Perry E M, Akhmedov B. A visible band index for remote sensing leaf chlorophyll content at the canopy scale. International Journal of Applied Earth Observation & Geoinformation, 2013; 21(4): 103–112
[20] Hirooka Y, Homma K, Maki M, Sekiguchi K. Applicability of synthetic aperture radar (SAR) to evaluate leaf area index (LAI) and its growth rate of rice in farmers’ fields in Lao PDR. Field Crops Research, 2015; 176: 119–122.
[21] Liu C G, Wang Y J, Pan K W, Jin Y Q, Jin L, Li W, et al. Photosynthetic carbon and nitrogen metabolism and the relationship between their metabolites and lipid peroxidation in dwarf bamboo (Fargesia rufa Yi) during drought and subsequent recovery. Trees, 2015; 29(6): 1–15.
[22] Rivera J P, Verrelst J, Leoneko G, Moreno J. Multiple cost functions and regularization options for improved retrieval of leaf chlorophyll content and LAI through inversion of the PROSAIL model. Remote Sensing, 2013; 5(7): 3280–3304. [23] Mulla D J. Twenty five years of remote sensing in precision
agriculture: Key advances and remaining knowledge gaps. Biosyst. Eng., 2013; 114(4): 358–371.
[24] Piekarczyk J. Application of remote sensing in agriculture. Geoinformatica Polonica, 2014; 13(1): 69–75.