Mining Competitors from Large Unstructured Datasets
1.Ms. B. Kavitha, Final MCA.,
2. Mr. C. Mani, M.C.A., M.Phil., M.E., Associate Professor/MCA
Department of MCA, Nandha Engineering College (Autonomous), Erode-52.
---
************************
---Abstract:
In any competitive business, success is based on the ability to make an item more appealing to customers than the competition. A number of questions arise in the context of this task: how do we formalize and quantify the competitiveness between two items? Who are the main competitors of a given item? What are the features of an item that most affect its competitiveness? Despite the impact and relevance of this problem to many domains, only a limited amount of work has been devoted toward an effective solution. In this paper, we present a formal definition of the competitiveness between two items, based on the market segments that they can both cover. Our evaluation of competitiveness utilizes customer reviews, an abundant source of information that is available in wide range of domains. We present efficient methods for evaluating competitiveness in large review datasets and address the natural problem of finding the top-k competitors of a given item. Finally, we evaluate the quality of our results and the scalability of our approach using multiple datasets from different domains. Index Terms—Data mining, Web mining, Information Search and Retrieval, Electronic commerce.
---
************************
---I. INTRODUCTION
Along line of research has demonstrated the strategic importance of identifying and monitoring a firm’s competitors [1]. motivated by this problem, the marketing and management community have focused on empirical methods for competitor identification [2], [3], [4], [5], [6],as well as on methods for analysing known competitors [7].extant research on the former has focused on mining comparative expressions (e.g. ”item a is better than item b”)from the web or other textual sources [8], [9], [10], [11], [12],[13]. even though such expressions can indeed be indicators of competitiveness, they are absent in many domains. For instance, consider the domain of vacation packages (e.g flight-hotel-car combinations). in this case, items have no assigned name by which they can be queried or compared with each other. further, the frequency of textual comparative evidence can vary greatly across domains. for example ,when comparing brand names at the firm level (e.g. “googlevs yahoo” or “sony vs panasonic”), it is
indeed likely that comparative patterns can be found by simply querying the web. however, it is easy to identify mainstream domains where such evidence is extremely scarce, such as shoes, jeweler, hotels, restaurants, and furniture. motivated by these shortcomings, we propose a new formalization of the competitiveness between two items, based on the market segments that they can both cover.
1.[competitiveness]: let µ be the population offal possible customers in a given market. we consider that an item covers a customeru2 unify it can cover all of the customer’s requirements. then, the competitiveness between two items, jis proportional to the number of customers that they can both cover.
our competitiveness paradigm is based on the following observation: the competitiveness between two items is based on whether they compete for the attention and business of the same groups of customers (i.e. the same market segments). for example, two restaurants that exist in different countries are obviously not competitive,
since there is no overlap between their target groups. Consider the example shown in figure
The figure illustrates the competitiveness between three items i, j and k. Each item is mapped to the set of features that it can offer to a customer. Three features are considered in this example: A, B and C. Even though this simple example considers only binary features (i.e. available/not avail-able), our actual formalization accounts for a much richer space including binary, categorical and numerical features. The left side of the figure shows three groups of customers g1, g2, and g3. Each group
represents a different market segment. Users are grouped based on their preferences with respect to the features. For example, the customers in g2 are
only interested in features A and B. We observe that items i and k are not competitive, since they simply do not appeal to the same groups of customers. On the other hand, j competes with both i (for groups g1
and g2) and k (for g3). Finally, an interesting
observation is that j competes for4 users with i and for 9 users with k. In other words, k is a stronger competitor for j, since it claims a much larger portion of its market share than i.
This example illustrates the ideal scenario, in which we have access to the complete set of customers in a given market, as well as to specific market segments and their requirements. In practice, however, such information is not available. In order to overcome this, we describe a method for computing all the segments in a given market based on mining large review datasets. This method allows us to op-erationalize our definition of competitiveness and address the problem of finding the top-k competitors of an item in any given market. As we show in our work, this problem presents significant computational challenges,
especially in the presence of large datasets with hundreds or thousands of items, such as those that are often found in mainstream domains. We address these challenges via a highly scalable framework for top-k computation, including an efficient evaluation algorithm and an appropriate index.
Our work makes the following contributions:
• A formal definition of the competitiveness between two items, based on their appeal to the various customer segments in their market. Our approach overcomes the reliance of previous work on scarce comparative evidence mined from text.
• A formal methodology for the identification of the different types of customers in a given market, as well as for the estimation of the percentage of customers that belong to each type. • A highly scalable framework for
finding the top-k competitors of a given item in very large dataset
II. RELATED WORKS
This paper builds on and significantly extends our preliminary work on the evaluation of competitiveness to the best of our knowledge, our work is the first to address the evaluation of competitiveness via the analysis of large unstructured datasets, without the need for direct comparative evidence. nonetheless, our work has ties to previous work from various domains.
candidate competitors [1], [5], [7]. Finally, managerial competitor identification has also been presented as a sense-making process in which competitors are identified based on their potential to threaten an organizations identity [4].
B. Competitor Mining Algorithms:
Identify key competitive measures (e.g. market share, share of wallet) and showed how a firm can infer the values of these measures for its competitors by mining (i) its own detailed customer transaction data and (ii) aggregate data for each competitor. Contrary to our own methodology, this approach is not appropriate for evaluating the competitiveness between any two items or firms in a given market. Instead, the authors assume that the set of competitors is given and, thus, their goal is to compute the value of the chosen measures for each competitor. In addition, the dependency on transactional data is a limitation we do not have.
Doan et al. explore user visitation data, such as the geo-coded data from location-based social networks, as a potential resource for competitor mining [33]. While they report promising results, the dependence on visitation data limits the set of domains that can benefit from this approach discussed in the introduction, such evidence is typically scarce or even non-existent in many mainstream domains. As a result, the applicability of such approaches is greatly limited. We provide empirical evidence on the scarcity of co occurrence information in our experimental evaluation.
C. Finding Competitive Products:
Recent work has explored competitiveness in the context of product de-sign. The first step in these approaches is the definition of a dominance function that represents the value of a product. The goal is then to use this function to create items that are not dominated by other, or maximize items with the maximum possible dominance value. A similar line of work [39], [40] represents items as points in a multidimensional space and looks for subspaces where the appeal of the item is maximized. While relevant, the above projects have a completely different focus from our own, and hence the
proposed approaches are not applicable in our setting.
D. Skyline computation:
Our work leverages concepts andtechniques from the extensive literature on skyline computation. These include the dominance concept among items, as well as the construction of the skyline pyramid used by our Miner algorithm. Our work also has ties to the recent publications in reverse skyline queries [42],Even though the focus of our work is different, we intend to utilize the advances in this field to improve our framework in future work.
III. METHODOLOGY
The typical user session on a review platform, such as Yelp, Amazon or Trip Advisor, consists of the following steps:
1) Specify all required features in a query. 2) Submit the query to the website’s search engine and retrieve the matching items.
3) Process the reviews of the returned items and make a purchase decision.
In this setting, items that cover the user’s requirements will be included in the search engine’s response and will compete for her attention. On the other hand, non-covering items will not be considered by the user and, thus, will not have a chance to compete. Next, we present an example that extends this decision-making process to a multi-user setting.
wi-fi, while the second segment includes 50 customers who are only interested in parking.
TABLE 1: Hotels and their Features.
In order to measure the competition between any two hotels, we need to identify the number of customers that they can both satisfy. The results are shown in Table 3. The Hilton and the Marriot can cover segments q1, q3, and q4. Therefore, they
compete for (100 + 50 + 60)/660 32% of the entire market. We observe that this is the lowest competitiveness achieved for any pair, even though the two hotels are also the most similar. In fact, the highest competitiveness is observed between the Marriot and the Westin, that compete for 70% of the market. This is a critical observation that demonstrates that similarity is not a good proxy for competitiveness. The explanation is intuitive. The availability of both a pool and a bar makes the Hilton and the Marriot more similar to each other and less similar to the Westin. However, neither of these features has an effect on competitiveness. First, the pool feature is not required by any of the customers in this market. Second, even though the availability of a bar is required by segment q6, none
of the three hotels can cover all three of this segment’s requirements. Therefore, none of the hotels compete for this particular segment.
Another intuitive observation is that the size of the segment has a direct effect on competitiveness. For example, even though the Westin shares the same number of segments
(4) with the other two hotels, its competitiveness with the Marriot is significantly higher. This is due to the size of the q5 segment,
which is more than double the size of q4
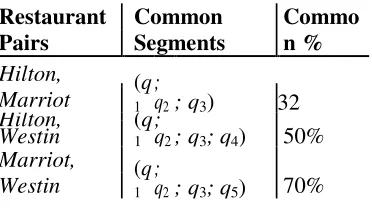
TABLE 2: Common segments for restaurant pairs
Restaurant Pairs
Common Segments
Commo n % Hilton,
Marriot (1q; q2; q3) 32
Hilton,
Westin (1q
;
q2; q3; q4) 50%
Marriot,
Westin (1q
;
q2; q3; q5) 70%
The above example is limited to binary features. In this simple setting, it is trivial to determine if two items can both cover a feature. However, as we discuss in detail in Nam
e
Ba r
Breakf ast
Gy m
Parki ng
Poo l
Wi-Fi Hilto
n
Ye
s No Yes Yes Yes Yes
Marri
ot Yes Yes No Yes Yes Yes
Westi
n No Yes Yes Yes No Yes
Section 2.1, the items in a market can have different types of features (e.g. numeric) that may be only partially covered by two items. Formally, let p(q) be the percentage of users represented by a query q and let Vqi,j be the
pair wise coverage offered by two items i and j to the space defined by the features in q. Then, we define the competitiveness between i and j in a market with a feature subset F as follows:
CF(i,j) =∑q∈2Fp(q)Vqi,j,
E. This definition has a clear probabilistic interpretation:
Given two items i, j, their competitiveness(i, j)represents the probability that the two items are included in the consideration setoff a random user. This new definition has direct implications for consumers, who often rely on recommendation systems to help them choose one of several candidate products. The ability to measure the competitiveness between two items enables the recommendation system to strategically select the order in which items should be recommended or the sets of items that should be included together in a group recommendation. For instance, if a random user u shows interest in an item i, then she is also likely to be interested in the items with the highest CF(i,)values. Such competitive items are likely to meet the criteria satisfied by I and even cover additional parts of the feature space. In addition, as the user u rates more items and the system gains a more accurate view of her requirements, our competitiveness measure can be trivially adjusted to consider only those features from(and only those value intervals within each feature) that are relevant four. This competitiveness-based recommendation paradigm is a departure from the standard approach that adjusts the weight (relevance) of an item for a user based on the rating that submits for items similar to j. As discussed, this approach ignores that (i) the similarity may be due to irrelevant or trivial features and(ii) for a user who likes an item i, an item j that is far superior than I with respect to the user’s requirements (and thus quite different) is a better recommendation candidate than an item j that
is highly similar toiling the following two sections we describe the computation of the two primary components of competitiveness: (1)the pair wise coverage Vqi, j of a query that includes binary, categorical, ordinal or numeric features, and (2) the percentage(q)of users represented by each query q.
I. Pair wise Coverage
We begin by defining the pair wise coverage of a single feature f. We then define the pair wise coverage of an entire query of features q. Definition 2.[Pair wise Feature Coverage]: We define the pair wise coverage Vfi,jof a feature by two items i,j as the percentage of all possible values off that can be covered by both I and j.
Binary and Categorical Features:
Categorical features take one or more values from a finite space. Examples of single-value features include the brand of a digital camera or the location of a restaurant. Examples of multi-value features include the amenities offered by a hotel or the types of cuisine offered by a restaurant. Any categorical feature can be encoded via a set of binary features, with each binary feature indicating the (lack of) coverage of one of the original feature’s possible values. In this simple setting, the feature can be fully covered (iff[i] =f[j] = 1or, equivalently[i]f[j] = 1), or not covered at all. Formally, the pair wise coverage of a binary feature by two items i, j can be computed as follows : Vfi,j=f[i]f[j](binary features)
[Numeric Features]:Numeric features take values from predefined range. Henceforth, without loss of generality, we consider numeric features that take values in[0,1], with higher values being preferable. The pair wise coverage of a numeric feature by two items I and j can be easily computed as the smallest (worst) value achieved for either item. For instance, consider two restaurants i, jwithvalues0.8and0.5for the feature food quality. Their pair-wise coverage in this setting is0.5. Conceptually, the two items will compete for any customer who accepts a quality0.5. Customers with higher standards would eliminate restaurant j, which will never have a chance to compete for their business. Formally, the pair wise coverage of a numeric feature by two items i, j can be computed as follows
Ordinal Features:
Ordinal features take values from a finite or dared list. A characteristic example is the popular five star scale used to evaluate the quality of a service or product. For example, consider that the values of two items I and j on the 5-star rating scale are⋆⋆and⋆⋆⋆, respectively. Customers that demand at least 4 stars will not consider either of the two items, while customers that demand at least 3 stars will only consider item j. The two items will thus compete for all customers that are willing to accept 1or 2 stars. Therefore, as in the case of numeric features, the pair wise coverage for ordinal features is determined by the worst of the two values. In this example, given that the two items compete for 2 of the 5 levels of the ordinal scale (1 and2 stars), their competitiveness is proportional to2/5 = 0.4.
Pair wise coverage of a feature query:
We now discus show coverage can be extended to the query level. Figure 2visualizes a query that includes two numeric featuresf1andf2. The figure also includes two competitive items I and j, positioned according to their values for the two features:f1[i] = 0.3, f2[i] = 0.3, f1[j] = 0.2, andf2[j] = 0.7. We observe that the percentage of the 2-dimensional space that each item covers is equivalent to the area of the rectangle defined by the beginning of the two axes(0,0)and the item’s values forf1andf2. For example, the covered area for itemiis0.30.3 = 0.09, equal to9%of the entire space. Similarly, the pair wise coverage provided by both items is equal to 0.20.3 = 0.06(i.e.6%of the market).
II. Estimating Query Probabilities:
The definition of competitiveness considers the probability(q)that a random customer will be represented by a specific query of features q, for every possiblequeryq22F. In this section, we describe how these probabilities can be estimated from real data. Feature queries are direct representation of user preferences. Ideally, we would have access to the query logs of the platform’s (e.g. Amazon’s or Trip Advisor’s) search engine. In practice, however, the sensitive and proprietary nature of such information
makes it very hard for firms to share publicly. Therefore, we design an estimation process that only requires access to an abundant resource: customer reviews. Each review includes customer’s opinions on a particular subset of features of the reviewed item. Extant research has repeatedly validated the use of reviews to estimate user preferences with respect to different features in multiple domains, such as phone apps [14], movies [15], electronics , and hotels .A trivial approach would be to estimate the demand for each feature separately, and then aggregate the individual estimates at the subset level. However, this approach as-sums feature independence, a strong assumption that would first have to be validated across domains. To avoid this assumption and capture possible feature correlations, we consider all the features mentioned in each review as single query. We then compute the frequency of each querying our review corpus, and divide it by the sum of the frequencies of all queries.
III. Extending our Competitiveness Definition: Feature Uniformity:
of features and an interest interval for each feature). We can then compute the competitiveness between two items by simply counting the number of data points that fall in the cells that they can both cover. We can also recomputed the sums of each cell offline with the prefix-sum array technique as well as reduce the space complexity via approximations or multidimensional histograms. A parameter of the grid-construction process is the cell size, with larger cells sac-refining accuracy for the sake of efficiency. In practice, this parameter will be determined by the granularity of the input data, as well as the practitioner’s computational constraints.
IV. Finding The Top-K Competitors:
Given the definition of the competitiveness in Eq. 1, we study the natural problem of finding the top-k competitors of a given item. Formally: Problem .
1)Top-k Competitors Problem:
We are presented with a market with a set often items I and a set of features. Then, given a single itemi2 I, we want to identify the k items from that maximizes(i,).A naive algorithm would compute the competitiveness between i and every possible candidate. The complexity of this brute force method is clearly(2|F|n2logK),which can be easily dominated by the power set factor and, as we demonstrate in our experiments, is
impractical for large datasets. One option could be to perform the naive computation
in a distributed fashion. Even in this case, however, we would need one thread for each of then2pairs. This is far from trivial, if one considers that could measure in the tens of thousands. In addition, a naïve Map Reduce implementation would face the bottleneck of passing everything through the reducer to account for thyself-join included in the computation. In practice, the self-join would have to be implemented via a customized technique for reduce-side joins, which is a non-trivial and highly expensive operation These issues motivate us to introduce CMiner, an efficient exact algorithm for Problem 1. Except for the creation of our indexing mechanism, every other aspect of CMiner can also be incorporated in a parallel solution.
2)The CMiner Algorithm:
Next, we present CMiner, an exact algorithm for finding the top-k competitors of a given item. Our algorithm makes use of the skyline pyramid in order to reduce the number of items that need to be considered. Given that we only care about the top-k competitors, we can incrementally compute the score of each candidate and stop when it is guaranteed that the top-k have emerged. The pseudo code is given in Algorithm 1.Discussion of CMiner: The input includes the set of items I, the set of features F, the item of interest i, the number k of top competitors to retrieve, the set Q of queries and their probabilities, and the skyline pyramids. The algorithm first retrieves the items that dominate, via masters(i)(line1). These items have the maximum possible competitiveness with i. If at least k such items exist, we report those and conclude (lines 2-4). Otherwise, we add them to Top K and decrement our budget of k accordingly (line 5). The variable LB maintains the lowest lower bound from the
current top-k set (line 6) and is used to prune candidates. In line 7, we initialize the set of candidates X as the union of items in the first layer of the pyramid and
the set of items dominated by those already in the Top K. This is achieved via calling GET SLAVES(T opK, DI). In every iteration of lines 8-17,CMiner feeds the set of candidates X to the UPDATETOPK()routine, which prunes items based on the LB threshold. It then updates the Top K set via the MERGE() function, which identifies the items with the highest competitiveness from T opK[X. This can be achieved in linear time, since both X and T are sorted. In line 13, the pruning threshold LB is set to the worst (lowest) score among the new T opK. Finally, GETSLAVES() is used to expand the set of candidates by including items that are dominated by those in X. Discussion of UPDATETOPK(): This routine processes the candidates in X and finds at most candidates with the highest competitiveness with i. The routine utilizes a data structure local Top K, implemented as an associative array: the score of each candidate serves as the key, while its I deserves as the value.
We presented a formal definition of competitiveness between two items, which we validated both quantitatively and qualitatively. Our formalization is applicable across domains, overcoming the shortcomings of previous approaches. We consider a number of factors that have been largely overlooked in the past, such as the position of the items in the multi-dimensional feature space and the preferences and opinions of the users. Our work introduces an end-to-end methodology for mining such information from large datasets of customer reviews. Based on our competitiveness definition, we addressed the computation-ally challenging problem of finding the top-k competitors of a given item. The proposed framework is efficient and applicable to domains with very large populations of items. The efficiency of our methodology was verified via an experimental evaluation on real datasets from different domains. Our experiments also revealed that only a small number of reviews is sufficient to confidently estimate the different types of users in a given market, as well the number of users that belong to each type.
V. REFERENCES
[1] M. E. Porter, Competitive Strategy: Techniques for Analyzing Industries and Competitors. Free Press, 1980.
[2] R. Dishpan and H.Gatingon, “Competitive analysis ,”Marketing Letters, 1994.
[3] B. H. Clark and D. B. Montgomery, “Managerial Identification of Competitors ,”Journal of Marketing, 1999. [4] W. T. Few, “Managerial competitor identification: Integrating the categorization, economic and organizational identity perspectives, “Doctoral Dissertation, 2007. [5] M. Bergen and M. A. Petered, “Competitor identification and com-petit or analysis: a
broad-based managerial approach ,”Managerial and Decision Economics, 2002.
[6] J. F. Porac and H. Thomas, “Taxonomic mental models in competitor definition, “The Academy of Management Review, 2008. [7] M.-J. Chen, “Competitor analysis and inter firm rivalry: Toward theoretical integration, “Academy of Management Review, 1996. [8] R. Li, S. Bao, J. Wang, Y. Yu, and Y. Cao, “Cminer: An effective algorithm for mining competitors from the web,” in ICDM, 2006. [9] Z. Ma, G. Pant, and O. R. L. Sheng, “Mining competitor relation-ships from online news: A network-based approach ,”Electronic Commerce Research and Applications, 2011. [10] R. Li, S. Bao, J. Wang, Y. Liu, and Y. Yu, “Web scale competitor discovery using mutual information,” in ADMA, 2006.
[11] S. Bao, R. Li, Y. Yu, and Y. Cao, “Competitor mining with the web ,”IEEE Trans. Know l. Data Eng., 2008.
[12] G. Pant and O. R. L. Sheng, “Avoiding the blind spots: Competitor identification using web text and linkage structure,” in ICIS, 2009. [13] D.Zelenko and O.Semin, “Automatic competitor identification from public information sources, “International Journal of Computational Intelligence and Applications, 2002.
[14] R. Decker and M. TruServ, “Estimating aggregate consumer preferences from online product reviews, “International Journal of Re-search in Marketing, vol. 27, no. 4, pp. 293– 307, 2010.