209 Information Technology and Control 2018/2/47
Forward Adaptive Laplacian
Source Coding Based on
Restricted Quantization
ITC 2/47
Journal of Information Technology and Control
Vol. 47 / No. 2 / 2018 pp. 209-219
DOI 10.5755/j01.itc.47.2.16670 © Kaunas University of Technology
Forward Adaptive Laplacian Source Coding
Based on Restricted Quantization
Received 2016/11/04 Accepted after revision 2018/03/05
http://dx.doi.org/10.5755/j01.itc.47.2.16670
Corresponding author: [email protected]
Bojan Denic, Zoran Peric, Nikola Vucic
University of Nis, Faculty of Electronic Engineering, Department of Telecommunications, Aleksandra Medvedeva 14, 18000 Nis, Serbia,
e-mail: [email protected], [email protected], [email protected]
Vladimir Despotovic
University of Belgrade, Technical Faculty in Bor Vojske Jugoslavije 12, 19210 Bor, Serbia, e-mail: [email protected]
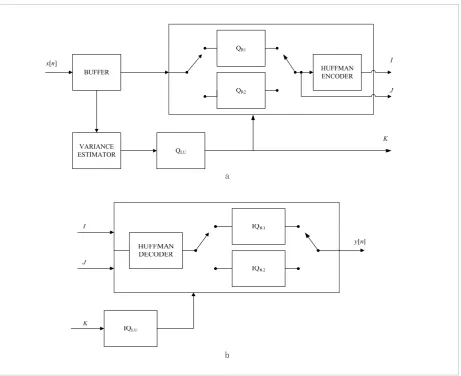
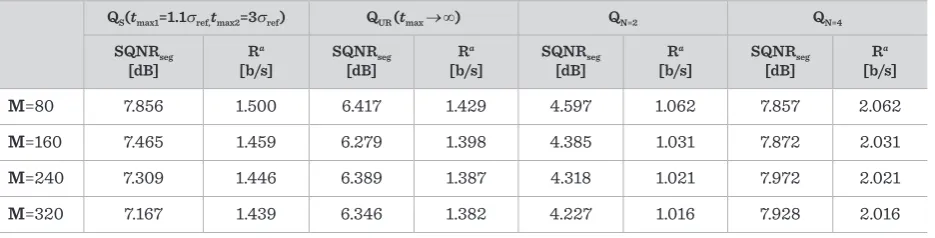
A novel solution for Laplacian source coding based on the three-level restricted quantization is proposed in this paper. The restricted quantization provides the reduction of granular distortion with the proper choice of the support region. We use the combination of two three-level restricted quantizers having unequal support regions, which are selected based on the lower distortion. The quantizers are designed using the Lloyd-Max’s algorithm, by assuming the restricted Laplacian distribution of the input signal. The outputs are encoded using the Huffman code. In order to improve the performance the forward adaptive algorithm was employed, where the adaptation to the signal variance (power) was performed on frame-by-frame basis. Theoretical analysis has shown that in this manner the robustness and adaptability of the proposed solution is enabled. The experimental results prove that the proposed switched three-level restricted quantizer is superior in comparison to the three-level unrestricted quantizer, and outperforms the one-bit (two-level) Lloyd-Max’s quantizer, while offering performance comparable to the two-bit (four-level) Lloyd-Max’s base-line with large savings in bit rate.
Information Technology and Control 2018/2/47 210
1. Introduction
Quantization is the most important step in ana-log-to-digital (A/D) signal conversion. It implies ap-proximating a continuous range of values with a finite (preferably small) range of discrete values known as codewords. In an optimal quantizer design, the task is to design a quantizer, for the assumed probability den-sity function (pdf) of the signal, such that the quanti-zation error is minimal. While there is no restriction imposed on the chosen pdf, if it deviates from the one for which the optimal quantizer is designed for, the performance of the quantizer decreases.
Lloyd-Max’s algorithm is extensively used in optimal scalar quantizer design (minimizes the mean squared error) [4, 10, 11, 20]. It iteratively computes the quan-tization parameters (representative levels and de-cision thresholds) starting from some initial values, and converging to the optimal ones in a finite number of steps [8]. It works fast when the number of levels N is low, but can be time-consuming for high N.
The asymptotic theory (high-resolution quantiza-tion) considers the issue of reduced complexity of de-sign and implementation using the optimal compand-ing quantization [4, 10, 11, 20], which has been widely applied in signal processing either for fixed length [16, 18, 19] or for variable length coding [6].
The quality of the quantized signal is influenced by the width of the quantizer’s support region and if the input signal exceeds this support region, the clipping occurs, which introduces the error known as the over-load distortion. If the quantizer’s support region is de-creased, the space between its output values (i.e. the granular region) is also decreased, leading to smaller granular distortion, but at the same time increasing the overload distortion. Hence, the quantizer design requires determining a balance between granular and overload distortion [13].
When the bounds of the support region are infinite, we consider the case of unrestricted quantizer. Restrict-ing the bounds to finite values defines the restricted quantizer. The main idea behind the use of restricted instead of unrestricted quantization lies in the fact that it provides reduction of the granular distortion (improves the signal quality) with the decrease of the support region for a fixed number of quantization levels N (the levels density is increased). The proper
choice of bounds for the support region is of extreme importance [13, 14].
Recently, restricted quantization was analyzed in [18] and [19]. Forward adaptive restricted and unre-stricted scalar compandors with the same compres-sion function and the same number of representative levels were introduced in [18] for Laplacian sources, where the restricted compandor was used whenev-er all the signal amplitudes within the frame wwhenev-ere inside the support region, else the unrestricted one was used. In this way, the granular distortion was de-creased, while the overload distortion was completely eliminated. A similar analysis for the Gaussian sourc-es was conducted in [16].
The systems exploiting three-valued alphabet have been reported in [1, 2, 5, 21, 22]. In [1] and [2], it was applied in ECG compression and sensor network sys-tems, respectively, while in [5], it was efficiently used in delta modulation system for Laplacian source cod-ing. The steganography method known as LSB match-ing was studied in [21] and [22], where the three-val-ued alphabet has been added to the pixel values of the cover image.
In this paper, we developed the three-level quantizer with a goal to upgrade the one-bit quantizer solution. Note that the asymptotic theory does not apply here, since the optimal performance could not be achieved. It is designed employing the Lloyd-Max’s algorithm, while its outputs are encoded using the Huffman code [7, 20]. We propose the use of switched quantization, choosing between two restricted quantizers with dif-ferent support regions, unlike [16, 18, 19], where the combination of restricted and unrestricted quantiz-er was used. Moreovquantiz-er, we use a diffquantiz-erent switching rule, with minimal distortion being the criterion for switching.
211 Information Technology and Control 2018/2/47
solutions in [16] and [18] where the authors want to achieve the maximization in the signal quality, the proposed solution offers high data compression. The performances of the proposed codec are eval-uated using the Signal to Quantization Noise Ratio (SQNR) and bit rate. The effectiveness of the pro-posed algorithm has been proven theoretically and experimentally. The experimental results are com-pared with the baselines including three-level unre-stricted quantization, one-bit and two-bit Lloyd-Max quantization [4, 10, 11, 20].
The reminder of the paper is organized as follows: in Section 2 we present a detailed description of de-sign of the restricted three-level quantizer and the switched quantizer with the forward adaptive coding scheme. In Section 3 we present and discuss the ex-perimental results and finally we give concluding re-marks in Section 4.
2. Scalar Quantizer Design
2.1. Restricted Three-Level Scalar Quantizer
The restricted three-level scalar quantizer QR is
spec-ified by the parameters referred to as decision thresh-olds ti such that -tmax = t0 < t1 < t2 < t3 = tmax, where tmax is the upper bound and ti∈R, and representative levels
Y = {y1, y2, y3}⊂R, such that y1 < y2 < y3, where N = 3 is a codebook size.
Quantization cells denoted with αiare defined as αi = (ti-1, ti], i = 1, 2, 3. Each cell αi is represented by the level
yi∈αi. If the input signal value x falls into the interval
αi,that value is quantized by the level yi. Therefore,
a scalar quantizer can be defined as a function QR:
R →Y that maps value x into level yi where QR (x) = yi, for x∈αi. The cells αi constitute the granular region,
hence the name granular cells.
In Figure 1, we present the symmetrical three-level quantizer involving zero level y2. Due to the
symme-try, the following equations will hold: −t1 = t2 and −y1 = y3. Therefore, the design of the proposed quantizer in-cludes finding the parameters t2 and y3 for a given tmax. We presume that information source that needs to be quantized is memoryless and zero-mean restricted Laplacian with probability density function (pdf) [4, 10, 11, 20]:
(
)
max 2 exp 1 , 2 2 1 exp x p x t σ σ σ σ - = - - (1)where σ is the standard deviation.
Lloyd-Max’s algorithm was applied in the following steps:
Step1.Initialization of the threshold t2(0) = 0.71σref and level y3(0) = 1.42σref [5].
Step2. Computation of new values of level y3 and threshold t2 using [11]:
Forward Adaptive Laplacian Source Coding Based on the Restricted Quantizers
7
( ) ( )(
)
( )(
)
max 2 max 2 1 3 , , i i re t t i t t f refxp x dx
y
p x dx
σ
σ
+ =
∫
∫
, i=1,2,... (2)
( )1 ( )2 1 3( )1
2 2
i i
i y y
t
+ +
+ = + , i=1,2,... (3)
Step3. Interruption of the Lloyd-Max’s algorithm when next iteration does not produce any change in distortion.
The mean squared distortion D, which is used as a measure of the error introduced by the restricted quantizer, is given by [4, 10, 11, 20]:
( )
(
)
(
) (
)
2 max 2 2 0 2 3 2 , 2 , t t tD x p x dx
x y p x dx
σ σ σ = + −
∫
∫
. (4)SQNR, which is used as a measure of the quality of the quantized signal, is given by [4, 10, 11, 20]:
( )
10log10( )
( )
SQNR
PsorD σ σ σ =
, (5)
where Psor(σ) is the power of the input source defined as [11]:
( )
max 2(
)
0
2 ,
t
sor
P σ =
∫
x p xσ dx. (6)Let p1,p2and p3denote probabilities that a sample of the input signal belongs to the first, second or third quantization cell, respectively:
( )
( )
max(
)
2 3 1 2 max , 2 exp 1 1 2 2
2 exp 1
t
t
p p p x dx
t t σ σ σ σ σ = = − − = − − −
∫
, (7)( )
2(
)
2 2 max 0 2 exp 1 2 , 2 exp 1 t t
p p x dx
t σ σ σ σ − − = = − −
∫
. (8)The quantizer representative levels are encoded using the Huffman code. The level having the highest probability is encoded with codeword ‘0’ and the other two levels are encoded with the codewords ‘10’ and ‘11’.
The bit rate is defined as [20]:
( )
3( )
1 N
i i
i
R σ = p σ l
=
=
∑
, (9)where li is the length of the Huffman codeword corresponding to the level yi.
1 2 3 4 5 6
5.5 6 6.5 7 7.5 8 8.5
tmax / σref
SQ
N
R [dB]
Restricted N = 3 Unrestricted N = 3
Figure 2. SQNR dependence on the upper bound threshold tmaxfor the proposed three-level restricted quantizer
In Figure 2, we illustrate the dependence of SQNR of the restricted quantizer QR, which is designed for different values of the support region upper bound tmax (using Lloyd-Max’s algorithm) and σ= σref = 1. We observe the gain in performance in terms of SQNR compared to the unrestricted quantizer QUR(tmax → ∞) [5], especially when QUR is designed for smaller tmax values. Note that designing for larger tmax (e.g. for 6σref) provides the SQNR score close to the one of QUR.
The dependence of the probability that a sample of the input signal belongs to a particular quantization cell on tmax is depicted in Figure 3, demonstrating that p2 representing the cell α2= (-t2, t2) is more probable than the other two. The probability p2 increases for higher tmax.
We can guarantee that the restricted quantization is a suitable solution for the sources bounded by the amplitude, but the situation changes when we deal with the unrestricted ones. This effect is visible in Figure 4, where the higher probability that the sample occurs outside the restricted quantizer support region indicates the higher amplitude mismatch (between the designed range of the quantizer and the input infinite range), leading to larger quantization error.
In order to eliminate this drawback, we propose the switched quantization that will be described in the next subsection.
(2)
Forward Adaptive Laplacian Source Coding Based on the Restricted Quantizers
7
( ) ( )(
)
( )(
)
max 2 max 2 1 3 , , i i re t t i t t f refxp x dx y
p x dx
σ
σ + =
∫
∫
, i=1,2,... (2)
( )1 2( )1 ( )3 1
2 2
i i
i y y
t
+ +
+ = +
, i=1,2,... (3)
Step3. Interruption of the Lloyd-Max’s algorithm when next iteration does not produce any change in distortion.
The mean squared distortion D, which is used as a measure of the error introduced by the restricted quantizer, is given by [4, 10, 11, 20]:
( )
(
)
(
) (
)
2 max 2 2 0 2 3 2 , 2 , t t tD x p x dx
x y p x dx
σ σ σ = + −
∫
∫
. (4)SQNR, which is used as a measure of the quality of the quantized signal, is given by [4, 10, 11, 20]:
( )
10log10( )
( )
SQNR
PsorD σ σ σ =
, (5)
where Psor(σ) is the power of the input source defined as [11]:
( )
max 2(
)
0
2 ,
t
sor
P σ =
∫
x p xσ dx. (6)Let p1,p2and p3denote probabilities that a sample of the input signal belongs to the first, second or third quantization cell, respectively:
( )
( )
max(
)
2 3 1 2 max , 2 exp 1 1 2 2
2 exp 1
t
t
p p p x dx
t t σ σ σ σ σ = = − − = − − −
∫
, (7)( )
2(
)
2 2 max 0 2 exp 1 2 , 2 exp 1 t t
p p x dx
t σ σ σ σ − − = = − −
∫
. (8)The quantizer representative levels are encoded using the Huffman code. The level having the highest probability is encoded with codeword ‘0’ and the other two levels are encoded with the codewords ‘10’ and ‘11’.
The bit rate is defined as [20]:
( )
3( )
1 N
i i
i
R σ = p σ l
=
=
∑
, (9)where li is the length of the Huffman codeword corresponding to the level yi.
1 2 3 4 5 6
5.5 6 6.5 7 7.5 8 8.5
tmax / σref
SQ
N
R [dB]
Restricted N = 3 Unrestricted N = 3
Figure 2. SQNR dependence on the upper bound threshold tmaxfor the proposed three-level restricted quantizer
In Figure 2, we illustrate the dependence of SQNR of the restricted quantizer QR, which is designed for different values of the support region upper bound tmax (using Lloyd-Max’s algorithm) and σ= σref = 1. We observe the gain in performance in terms of SQNR compared to the unrestricted quantizer QUR(tmax → ∞) [5], especially when QUR is designed for smaller tmax values. Note that designing for larger tmax (e.g. for 6σref) provides the SQNR score close to the one of QUR.
The dependence of the probability that a sample of the input signal belongs to a particular quantization cell on tmax is depicted in Figure 3, demonstrating that p2 representing the cell α2 = (-t2, t2) is more probable than the other two. The probability p2 increases for higher tmax.
We can guarantee that the restricted quantization is a suitable solution for the sources bounded by the amplitude, but the situation changes when we deal with the unrestricted ones. This effect is visible in Figure 4, where the higher probability that the sample occurs outside the restricted quantizer support region indicates the higher amplitude mismatch (between the designed range of the quantizer and the input infinite range), leading to larger quantization error.
In order to eliminate this drawback, we propose the switched quantization that will be described in the next subsection.
(3)
Step3. Interruption of the Lloyd-Max’s algorithm when next iteration does not produce any change in distortion.
The mean squared distortion D, which is used as a measure of the error introduced by the restricted quantizer, is given by [4, 10, 11, 20]:
Forward Adaptive Laplacian Source Coding Based on the Restricted Quantizers
( ) ( )
(
)
( )(
)
max 2 max 2 1 3 , , i i re t t i t t f refxp x dx y
p x dx
σ
σ + =
∫
∫
, i=1,2,... (2)
( )1 2( )1 3( )1
2 2
i i
i y y
t
+ +
+ = +
, i=1,2,... (3) Step3. Interruption of the Lloyd-Max’s algorithm
when next iteration does not produce any change in distortion.
The mean squared distortion D, which is used as a measure of the error introduced by the restricted quantizer, is given by [4, 10, 11, 20]:
( )
(
)
(
) (
)
2 max 2 2 0 2 3 2 , 2 , t t tD x p x dx
x y p x dx
σ σ
σ =
+ −
∫
∫
. (4)SQNR, which is used as a measure of the quality of the quantized signal, is given by [4, 10, 11, 20]:
( )
10log10( )
( )
SQNR
PsorD σ σ σ =
, (5)
where Psor(σ) is the power of the input source defined as [11]:
( )
max 2(
)
0
2 ,
t
sor
P σ =
∫
x p xσ dx. (6)Let p1, p2 and p3 denote probabilities that a sample of the input signal belongs to the first, second or third quantization cell, respectively:
( )
( )
max(
)
2 3 1 2 max , 2 exp 1 1 2 2
2 exp 1
t
t
p p p x dx
t t σ σ σ σ σ = = − − = − − −
∫
, (7)
( )
2(
)
2 2 max 0 2 exp 1 2 , 2 exp 1 t t
p p x dx
t σ σ σ σ − − = = − −
∫
. (8)The quantizer representative levels are encoded using the Huffman code. The level having the highest probability is encoded with codeword ‘0’ and the other two levels are encoded with the codewords ‘10’ and ‘11’.
The bit rate is defined as [20]:
( )
3( )
1 N
i i
i
R σ = p σ l
=
=
∑
, (9)where li is the length of the Huffman codeword corresponding to the level yi.
1 2 3 4 5 6
5.5 6 6.5 7 7.5 8 8.5
tmax / σref
SQ
N
R [dB]
Restricted N = 3 Unrestricted N = 3
Figure 2. SQNR dependence on the upper bound threshold tmax for the proposed three-level restricted quantizer
In Figure 2, we illustrate the dependence of SQNR of the restricted quantizer QR, which is designed for different values of the support region upper bound tmax (using Lloyd-Max’s algorithm) and σ= σref = 1. We observe the gain in performance in terms of SQNR compared to the unrestricted quantizer QUR (tmax → ∞) [5], especially when QUR is designed for smaller tmax values. Note that designing for larger tmax (e.g. for 6σref) provides the SQNR score close to the one of QUR.
The dependence of the probability that a sample of the input signal belongs to a particular quantization cell on tmax is depicted in Figure 3, demonstrating that p2 representing the cell α2 = (-t2, t2) is more probable than the other two. The probability p2 increases for higher tmax.
We can guarantee that the restricted quantization is a suitable solution for the sources bounded by the amplitude, but the situation changes when we deal with the unrestricted ones. This effect is visible in Figure 4, where the higher probability that the sample occurs outside the restricted quantizer support region indicates the higher amplitude mismatch (between the designed range of the quantizer and the input infinite range), leading to larger quantization error.
In order to eliminate this drawback, we propose the switched quantization that will be described in the next subsection.
(4)
SQNR, which is used as a measure of the quality of the Figure 1
The proposed restricted three-level quantizer
6
it provides reduction of the granular distortion (improves the signal quality) with the decrease of the support region for a fixed number of quantization
levels N (the levels density is increased). The proper
choice of bounds for the support region is of extreme importance [13, 14].
Recently, restricted quantization was analyzed in [18] and [19]. Forward adaptive restricted and unrestricted scalar compandors with the same compression function and the same number of representative levels were introduced in [18] for Laplacian sources, where the restricted compandor was used whenever all the signal amplitudes within the frame were inside the support region, else the unrestricted one was used. In this way, the granular distortion was decreased, while the overload distortion was completely eliminated. A similar analysis for the Gaussian sources was conducted in [16].
The systems exploiting three-valued alphabet have been reported in [1, 2, 5, 21, 22]. In [1] and [2], it was applied in ECG compression and sensor network systems, respectively, while in [5], it was efficiently used in delta modulation system for Laplacian source coding. The steganography method known as LSB matching was studied in [21] and [22], where the three-valued alphabet has been added to the pixel values of the cover image.
In this paper, we developed the three-level quantizer with a goal to upgrade the one-bit quantizer solution. Note that the asymptotic theory does not apply here, since the optimal performance could not be achieved. It is designed employing the Lloyd-Max’s algorithm, while its outputs are encoded using the Huffman code [7, 20]. We propose the use of switched quantization, choosing between two restricted quantizers with different support regions, unlike [16, 18, 19], where the combination of restricted and unrestricted quantizer was used. Moreover, we use a different switching rule, with minimal distortion being the criterion for switching.
The quantizers use the forward adaptation technique [11, 15, 17], which is an efficient way to improve the performance in terms of adaptability and robustness [3, 9]. Moreover, it gives better performance in the wide variance range of the input signal than the backward adaptation [17], and it is less sensitive to transmission errors [11]. However, unlike the backward adaptation, it requires the transmission of side information to the receiving part. In contrast to the solutions in [16] and [18] where the authors want to achieve the maximization in the signal quality, the proposed solution offers high data compression. The performances of the proposed codec are evaluated using the Signal to Quantization Noise Ratio (SQNR) and bit rate. The effectiveness of the proposed algorithm has been proven theoretically and experimentally. The experimental results are compared with the baselines including three-level unrestricted quantization, one-bit and two-bit Lloyd-Max quantization [4, 10, 11, 20].
The reminder of the paper is organized as follows: in Section 2 we present a detailed description of design of the restricted three-level quantizer and the switched quantizer with the forward adaptive coding scheme. In Section 3 we present and discuss the experimental results and finally we give concluding remarks in Section 4.
2. Scalar Quantizer Design
2.1. Restricted Three-Level Scalar Quantizer
The restricted three-level scalar quantizer QR is
specified by the parameters referred to as decision
thresholds ti such that -tmax = t0< t1<t2< t3=tmax,
where tmax is the upper bound and ti ∈ R, and
representative levels Y= {y1, y2, y3}⊂R, such that
y1<y2<y3, where N= 3 is a codebook size.
Quantization cells denoted with αiare defined as αi=
(ti-1,ti], i = 1, 2, 3. Each cell αiis represented by the
level yi∈αi. If the input signal value x falls into the
interval αi, that value is quantized by the level yi.
Therefore, a scalar quantizer can be defined as a
function QR: R → Y that maps value x into level yi
where QR(x) = yi,for x∈αi. The cells αiconstitute the
granular region, hence the name granular cells.
y1 t1 y2 t2 y3
−tmax tmax
Figure 1. The proposed restricted three-level quantizer
In Figure 1, we present the symmetrical three-level
quantizer involving zero level y2. Due to the
symmetry, the following equations will hold: −t1=t2
and −y1 = y3. Therefore, the design of the proposed
quantizer includes finding the parameters t2and y3for
a given tmax.
We presume that information source that needs to be quantized is memoryless and zero-mean restricted Laplacian with probability density function (pdf) [4, 10, 11, 20]:
(
)
max 2 exp 1 , 2 2 1 exp x p x tσ
σ
σ
σ
− = − − , (1)where σis the standard deviation.
Lloyd-Max’s algorithm was applied in the following steps:
Step1. Initialization of the threshold t2(0)= 0.71σref
and level y3(0)= 1.42σref [5].
Step2. Computation of new values of level y3 and
Information Technology and Control 2018/2/47 212
quantized signal, is given by [4, 10, 11, 20]:
Forward Adaptive Laplacian Source Coding Based on the Restricted Quantizers
7
( ) ( )(
)
( )(
)
max 2 max 2 1 3 , , i i re t t i t t f refxp x dx
y
p x dx
σ
σ
+ =
∫
∫
, i=1,2,... (2)
( )1 2( )1 ( )3 1
2 2
i i
i y y
t
+ +
+ = + , i=1,2,... (3)
Step3. Interruption of the Lloyd-Max’s algorithm when next iteration does not produce any change in distortion.
The mean squared distortion D, which is used as a measure of the error introduced by the restricted quantizer, is given by [4, 10, 11, 20]:
( )
(
)
(
) (
)
2 max 2 2 0 2 3 2 , 2 , t t tD x p x dx
x y p x dx
σ σ
σ =
+ −
∫
∫
. (4)SQNR, which is used as a measure of the quality of the quantized signal, is given by [4, 10, 11, 20]:
( )
10log10( )
( )
SQNR
PsorD σ σ σ =
, (5)
where Psor(σ) is the power of the input source defined as [11]:
( )
max 2(
)
0
2 ,
t
sor
P σ =
∫
x p xσ dx. (6)Let p1, p2 and p3 denote probabilities that a sample of the input signal belongs to the first, second or third quantization cell, respectively:
( )
( )
max(
)
2 3 1 2 max , 2 exp 1 1 2 2
2 exp 1
t
t
p p p x dx
t t σ σ σ σ σ = = − − = − − −
∫
, (7)
( )
2(
)
2 2 max 0 2 exp 1 2 , 2 exp 1 t t
p p x dx
t σ σ σ σ − − = = − −
∫
. (8)The quantizer representative levels are encoded using the Huffman code. The level having the highest probability is encoded with codeword ‘0’ and the other two levels are encoded with the codewords ‘10’ and ‘11’.
The bit rate is defined as [20]:
( )
3( )
1 N
i i
i
R σ = p σ l
=
=
∑
, (9)where li is the length of the Huffman codeword corresponding to the level yi.
1 2 3 4 5 6
5.5 6 6.5 7 7.5 8 8.5
tmax / σref
SQ
N
R [dB]
Restricted N = 3 Unrestricted N = 3
Figure 2. SQNR dependence on the upper bound threshold tmax for the proposed three-level restricted quantizer
In Figure 2, we illustrate the dependence of SQNR of the restricted quantizer QR, which is designed for different values of the support region upper bound tmax (using Lloyd-Max’s algorithm) and σ= σref = 1. We observe the gain in performance in terms of SQNR compared to the unrestricted quantizer QUR (tmax → ∞) [5], especially when QUR is designed for smaller tmax values. Note that designing for larger tmax (e.g. for 6σref) provides the SQNR score close to the one of QUR.
The dependence of the probability that a sample of the input signal belongs to a particular quantization cell on tmax is depicted in Figure 3, demonstrating that p2 representing the cell α2 = (-t2, t2) is more probable than the other two. The probability p2 increases for higher tmax.
We can guarantee that the restricted quantization is a suitable solution for the sources bounded by the amplitude, but the situation changes when we deal with the unrestricted ones. This effect is visible in Figure 4, where the higher probability that the sample occurs outside the restricted quantizer support region indicates the higher amplitude mismatch (between the designed range of the quantizer and the input infinite range), leading to larger quantization error.
In order to eliminate this drawback, we propose the switched quantization that will be described in the next subsection.
(5)
where Psor(σ) is the power of the input source defined
as [11]:
Forward Adaptive Laplacian Source Coding Based on the Restricted Quantizers
7
( ) ( )(
)
( )(
)
max 2 max 2 1 3 , , i i re t t i t t f refxp x dx
y
p x dx
σ
σ
+ =
∫
∫
, i=1,2,... (2)
( )1 ( )2 1 3( )1
2 2
i i
i y y
t
+ +
+ = +
, i=1,2,... (3)
Step3. Interruption of the Lloyd-Max’s algorithm when next iteration does not produce any change in distortion.
The mean squared distortion D, which is used as a measure of the error introduced by the restricted quantizer, is given by [4, 10, 11, 20]:
( )
(
)
(
) (
)
2 max 2 2 0 2 3 2 , 2 , t t tD x p x dx
x y p x dx
σ σ
σ =
+ −
∫
∫
. (4)SQNR, which is used as a measure of the quality of the quantized signal, is given by [4, 10, 11, 20]:
( )
10log10( )
( )
SQNR
PsorD σ σ σ =
, (5)
where Psor(σ) is the power of the input source defined as [11]:
( )
max 2(
)
0
2 ,
t
sor
P σ =
∫
x p xσ dx. (6)Let p1, p2 and p3 denote probabilities that a sample of the input signal belongs to the first, second or third quantization cell, respectively:
( )
( )
max(
)
2 3 1 2 max , 2 exp 1 1 2 2
2 exp 1
t
t
p p p x dx
t t σ σ σ σ σ = = − − = − − −
∫
, (7)
( )
2(
)
2 2 max 0 2 exp 1 2 , 2 exp 1 t t
p p x dx
t σ σ σ σ − − = = − −
∫
. (8)The quantizer representative levels are encoded using the Huffman code. The level having the highest probability is encoded with codeword ‘0’ and the other two levels are encoded with the codewords ‘10’ and ‘11’.
The bit rate is defined as [20]:
( )
3( )
1 N
i i
i
R σ = p σ l
=
=
∑
, (9)where li is the length of the Huffman codeword corresponding to the level yi.
1 2 3 4 5 6
5.5 6 6.5 7 7.5 8 8.5
tmax / σref
SQ
N
R [dB]
Restricted N = 3 Unrestricted N = 3
Figure 2. SQNR dependence on the upper bound threshold tmax for the proposed three-level restricted quantizer
In Figure 2, we illustrate the dependence of SQNR of the restricted quantizer QR, which is designed for different values of the support region upper bound tmax (using Lloyd-Max’s algorithm) and σ= σref = 1. We observe the gain in performance in terms of SQNR compared to the unrestricted quantizer QUR (tmax → ∞) [5], especially when QUR is designed for smaller tmax values. Note that designing for larger tmax (e.g. for 6σref) provides the SQNR score close to the one of QUR.
The dependence of the probability that a sample of the input signal belongs to a particular quantization cell on tmax is depicted in Figure 3, demonstrating that p2 representing the cell α2 = (-t2, t2) is more probable than the other two. The probability p2 increases for higher tmax.
We can guarantee that the restricted quantization is a suitable solution for the sources bounded by the amplitude, but the situation changes when we deal with the unrestricted ones. This effect is visible in Figure 4, where the higher probability that the sample occurs outside the restricted quantizer support region indicates the higher amplitude mismatch (between the designed range of the quantizer and the input infinite range), leading to larger quantization error.
In order to eliminate this drawback, we propose the switched quantization that will be described in the next subsection.
(6)
Let p1, p2 and p3 denote probabilities that a sample of the input signal belongs to the first, second or third quantization cell, respectively:
Forward Adaptive Laplacian Source Coding Based on the Restricted Quantizers
7
( ) ( )(
)
( )(
)
max 2 max 2 1 3 , , i i re t t i t t f refxp x dx y
p x dx
σ
σ + =
∫
∫
, i=1,2,... (2)
( )1 ( )2 1 3( )1
2 2
i i
i y y
t
+ +
+ = +
, i=1,2,... (3)
Step3. Interruption of the Lloyd-Max’s algorithm when next iteration does not produce any change in distortion.
The mean squared distortion D, which is used as a measure of the error introduced by the restricted quantizer, is given by [4, 10, 11, 20]:
( )
(
)
(
) (
)
2 max 2 2 0 2 3 2 , 2 , t t tD x p x dx
x y p x dx
σ σ
σ =
+ −
∫
∫
. (4)SQNR, which is used as a measure of the quality of the quantized signal, is given by [4, 10, 11, 20]:
( )
10log10( )
( )
SQNR
PsorD σ σ σ =
, (5)
where Psor(σ) is the power of the input source defined as [11]:
( )
max 2(
)
0
2 ,
t
sor
P σ =
∫
x p xσ dx. (6)Let p1, p2 and p3 denote probabilities that a sample of the input signal belongs to the first, second or third quantization cell, respectively:
( )
( )
max(
)
2 3 1 2 max , 2 exp 1 1 2 2
2 exp 1
t
t
p p p x dx
t t σ σ σ σ σ = = − − = − − −
∫
, (7)
( )
2(
)
2 2 max 0 2 exp 1 2 , 2 exp 1 t t
p p x dx
t σ σ σ σ − − = = − −
∫
. (8)The quantizer representative levels are encoded using the Huffman code. The level having the highest probability is encoded with codeword ‘0’ and the other two levels are encoded with the codewords ‘10’ and ‘11’.
The bit rate is defined as [20]:
( )
3( )
1 N
i i
i
R σ = p σ l
=
=
∑
, (9)where li is the length of the Huffman codeword corresponding to the level yi.
1 2 3 4 5 6
5.5 6 6.5 7 7.5 8 8.5
tmax / σref
SQ
N
R [dB]
Restricted N = 3 Unrestricted N = 3
Figure 2. SQNR dependence on the upper bound threshold tmax for the proposed three-level restricted quantizer
In Figure 2, we illustrate the dependence of SQNR of the restricted quantizer QR, which is designed for different values of the support region upper bound tmax (using Lloyd-Max’s algorithm) and σ= σref = 1. We observe the gain in performance in terms of SQNR compared to the unrestricted quantizer QUR (tmax → ∞) [5], especially when QUR is designed for smaller tmax values. Note that designing for larger tmax (e.g. for 6σref) provides the SQNR score close to the one of QUR.
The dependence of the probability that a sample of the input signal belongs to a particular quantization cell on tmax is depicted in Figure 3, demonstrating that p2 representing the cell α2 = (-t2, t2) is more probable than the other two. The probability p2 increases for higher tmax.
We can guarantee that the restricted quantization is a suitable solution for the sources bounded by the amplitude, but the situation changes when we deal with the unrestricted ones. This effect is visible in Figure 4, where the higher probability that the sample occurs outside the restricted quantizer support region indicates the higher amplitude mismatch (between the designed range of the quantizer and the input infinite range), leading to larger quantization error.
In order to eliminate this drawback, we propose the switched quantization that will be described in the next subsection.
(7)
Forward Adaptive Laplacian Source Coding Based on the Restricted Quantizers
7
( ) ( )(
)
( )(
)
max 2 max 2 1 3 , , i i re t t i t t f refxp x dx y
p x dx
σ
σ
+ =
∫
∫
, i=1,2,... (2)
( )1 2( )1 3( )1
2 2
i i
i y y
t
+ +
+ = +
, i=1,2,... (3)
Step3. Interruption of the Lloyd-Max’s algorithm when next iteration does not produce any change in distortion.
The mean squared distortion D, which is used as a measure of the error introduced by the restricted quantizer, is given by [4, 10, 11, 20]:
( )
(
)
(
) (
)
2 max 2 2 0 2 3 2 , 2 , t t tD x p x dx
x y p x dx
σ σ
σ =
+ −
∫
∫
. (4)SQNR, which is used as a measure of the quality of the quantized signal, is given by [4, 10, 11, 20]:
( )
10log10( )
( )
SQNR
PsorD σ σ σ =
, (5)
where Psor(σ) is the power of the input source defined as [11]:
( )
max 2(
)
0
2 ,
t
sor
P σ =
∫
x p xσ dx. (6)Let p1, p2 and p3 denote probabilities that a sample of the input signal belongs to the first, second or third quantization cell, respectively:
( )
( )
max(
)
2 3 1 2 max , 2 exp 1 1 2 2
2 exp 1
t
t
p p p x dx
t t σ σ σ σ σ = = − − = − − −
∫
, (7)
( )
2(
)
2 2 max 0 2 exp 1 2 , 2 exp 1 t t
p p x dx
t σ σ σ σ − − = = − −
∫
. (8)The quantizer representative levels are encoded using the Huffman code. The level having the highest probability is encoded with codeword ‘0’ and the other two levels are encoded with the codewords ‘10’ and ‘11’.
The bit rate is defined as [20]:
( )
3( )
1 N
i i
i
R σ = p σ l
=
=
∑
, (9)where li is the length of the Huffman codeword corresponding to the level yi.
1 2 3 4 5 6
5.5 6 6.5 7 7.5 8 8.5
tmax / σref
SQ
N
R [dB]
Restricted N = 3 Unrestricted N = 3
Figure 2. SQNR dependence on the upper bound threshold tmax for the proposed three-level restricted quantizer
In Figure 2, we illustrate the dependence of SQNR of the restricted quantizer QR, which is designed for different values of the support region upper bound tmax (using Lloyd-Max’s algorithm) and σ= σref = 1. We observe the gain in performance in terms of SQNR compared to the unrestricted quantizer QUR (tmax → ∞) [5], especially when QUR is designed for smaller tmax values. Note that designing for larger tmax (e.g. for 6σref) provides the SQNR score close to the one of QUR.
The dependence of the probability that a sample of the input signal belongs to a particular quantization cell on tmax is depicted in Figure 3, demonstrating that p2 representing the cell α2 = (-t2, t2) is more probable than the other two. The probability p2 increases for higher tmax.
We can guarantee that the restricted quantization is a suitable solution for the sources bounded by the amplitude, but the situation changes when we deal with the unrestricted ones. This effect is visible in Figure 4, where the higher probability that the sample occurs outside the restricted quantizer support region indicates the higher amplitude mismatch (between the designed range of the quantizer and the input infinite range), leading to larger quantization error.
In order to eliminate this drawback, we propose the switched quantization that will be described in the next subsection.
(8)
The quantizer representative levels are encoded using the Huffman code. The level having the highest proba-bility is encoded with codeword ‘0’ and the other two levels are encoded with the codewords ‘10’ and ‘11’. The bit rate is defined as [20]:
Forward Adaptive Laplacian Source Coding Based on the Restricted Quantizers
7
( ) ( )(
)
( )(
)
max 2 max 2 1 3 , , i i re t t i t t f refxp x dx y
p x dx
σ
σ
+ =
∫
∫
, i=1,2,... (2)
( )1 2( )1 ( )3 1
2 2
i i
i y y
t
+ +
+ = + , i=1,2,... (3)
Step3. Interruption of the Lloyd-Max’s algorithm when next iteration does not produce any change in distortion.
The mean squared distortion D, which is used as a measure of the error introduced by the restricted quantizer, is given by [4, 10, 11, 20]:
( )
(
)
(
) (
)
2 max 2 2 0 2 3 2 , 2 , t t tD x p x dx
x y p x dx
σ σ
σ =
+ −
∫
∫
. (4)SQNR, which is used as a measure of the quality of the quantized signal, is given by [4, 10, 11, 20]:
( )
10log10( )
( )
SQNR
PsorD σ σ σ =
, (5)
where Psor(σ) is the power of the input source defined as [11]:
( )
max 2(
)
0
2 ,
t
sor
P σ =
∫
x p xσ dx. (6)Let p1, p2 and p3 denote probabilities that a sample of the input signal belongs to the first, second or third quantization cell, respectively:
( )
( )
max(
)
2 3 1 2 max , 2 exp 1 1 2 2
2 exp 1
t
t
p p p x dx
t t σ σ σ σ σ = = − − = − − −
∫
, (7)
( )
2(
)
2 2 max 0 2 exp 1 2 , 2 exp 1 t t
p p x dx
t σ σ σ σ − − = = − −
∫
. (8)The quantizer representative levels are encoded using the Huffman code. The level having the highest probability is encoded with codeword ‘0’ and the other two levels are encoded with the codewords ‘10’ and ‘11’.
The bit rate is defined as [20]:
( )
3( )
1 N
i i
i
R σ = p σ l
=
=
∑
, (9)where li is the length of the Huffman codeword corresponding to the level yi.
1 2 3 4 5 6
5.5 6 6.5 7 7.5 8 8.5
tmax / σref
SQ
N
R [dB]
Restricted N = 3 Unrestricted N = 3
Figure 2. SQNR dependence on the upper bound threshold tmax for the proposed three-level restricted quantizer
In Figure 2, we illustrate the dependence of SQNR of the restricted quantizer QR, which is designed for different values of the support region upper bound tmax (using Lloyd-Max’s algorithm) and σ= σref = 1. We observe the gain in performance in terms of SQNR compared to the unrestricted quantizer QUR (tmax → ∞) [5], especially when QUR is designed for smaller tmax values. Note that designing for larger tmax (e.g. for 6σref) provides the SQNR score close to the one of QUR.
The dependence of the probability that a sample of the input signal belongs to a particular quantization cell on tmax is depicted in Figure 3, demonstrating that p2 representing the cell α2 = (-t2, t2) is more probable than the other two. The probability p2 increases for higher tmax.
We can guarantee that the restricted quantization is a suitable solution for the sources bounded by the amplitude, but the situation changes when we deal with the unrestricted ones. This effect is visible in Figure 4, where the higher probability that the sample occurs outside the restricted quantizer support region indicates the higher amplitude mismatch (between the designed range of the quantizer and the input infinite range), leading to larger quantization error.
In order to eliminate this drawback, we propose the switched quantization that will be described in the next subsection.
(9)
where li is the length of the Huffman codeword
corre-sponding to the level yi.
In Figure 2, we illustrate the dependence of SQNR of the restricted quantizer QR, which is designed for
dif-ferent values of the support region upper bound tmax (using Lloyd-Max’s algorithm) and σ= σref = 1. We ob-serve the gain in performance in terms of SQNR
com-pared to the unrestricted quantizer QUR(tmax →∞) [5], especially when QUR is designed for smaller tmax val-ues. Note that designing for larger tmax (e.g. for 6σref) provides the SQNR score close to the one of QUR.
The dependence of the probability that a sample of the input signal belongs to a particular quantization cell on tmax is depicted in Figure 3, demonstrating that p2 representing the cell α2= (-t2, t2) is more probable than the other two. The probability p2 increases for higher tmax.
Figure 2
SQNR dependence on the upper bound threshold tmax for the proposed three-level restricted quantizer
Forward Adaptive Laplacian Source Coding Based on the Restricted Quantizers
7
( ) ( )(
)
( )(
)
max 2 max 2 1 3 , , i i re t t i t t f refxp x dx y
p x dx
σ
σ
+ =
∫
∫
, i=1,2,... (2)
( )1 2( )1 3( )1
2 2
i i
i y y
t
+ +
+ = +
, i=1,2,... (3)
Step3. Interruption of the Lloyd-Max’s algorithm when next iteration does not produce any change in distortion.
The mean squared distortion D, which is used as a measure of the error introduced by the restricted quantizer, is given by [4, 10, 11, 20]:
( )
(
)
(
) (
)
2 max 2 2 0 2 3 2 , 2 , t t tD x p x dx
x y p x dx
σ σ
σ =
+ −
∫
∫
. (4)SQNR, which is used as a measure of the quality of the quantized signal, is given by [4, 10, 11, 20]:
( )
10log10( )
( )
SQNR
PsorD σ σ σ =
, (5)
where Psor(σ) is the power of the input source defined as [11]:
( )
max 2(
)
0
2 ,
t
sor
P σ =
∫
x p xσ dx. (6)Let p1, p2 and p3 denote probabilities that a sample of the input signal belongs to the first, second or third quantization cell, respectively:
( )
( )
max(
)
2 3 1 2 max , 2 exp 1 1 2 2
2 exp 1
t
t
p p p x dx
t t σ σ σ σ σ = = − − = − − −
∫
, (7)( )
2(
)
2 2 max 0 2 exp 1 2 , 2 exp 1 t t
p p x dx
t σ σ σ σ − − = = − −
∫
. (8)The quantizer representative levels are encoded using the Huffman code. The level having the highest probability is encoded with codeword ‘0’ and the other two levels are encoded with the codewords ‘10’ and ‘11’.
The bit rate is defined as [20]:
( )
3( )
1 N
i i
i
R σ = p σ l
=
=
∑
, (9)where li is the length of the Huffman codeword corresponding to the level yi.
1 2 3 4 5 6
5.5 6 6.5 7 7.5 8 8.5
tmax / σref
SQ
N
R [dB]
Restricted N = 3 Unrestricted N = 3
Figure 2. SQNR dependence on the upper bound threshold tmax for the proposed three-level restricted quantizer
In Figure 2, we illustrate the dependence of SQNR of the restricted quantizer QR, which is designed for different values of the support region upper bound tmax (using Lloyd-Max’s algorithm) and σ= σref = 1. We observe the gain in performance in terms of SQNR compared to the unrestricted quantizer QUR (tmax → ∞) [5], especially when QUR is designed for smaller tmax values. Note that designing for larger tmax (e.g. for 6σref) provides the SQNR score close to the one of QUR.
The dependence of the probability that a sample of the input signal belongs to a particular quantization cell on tmax is depicted in Figure 3, demonstrating that p2 representing the cell α2 = (-t2, t2) is more probable than the other two. The probability p2 increases for higher tmax.
We can guarantee that the restricted quantization is a suitable solution for the sources bounded by the amplitude, but the situation changes when we deal with the unrestricted ones. This effect is visible in Figure 4, where the higher probability that the sample occurs outside the restricted quantizer support region indicates the higher amplitude mismatch (between the designed range of the quantizer and the input infinite range), leading to larger quantization error.
In order to eliminate this drawback, we propose the switched quantization that will be described in the next subsection.
Figure 3
Probabilities p1 and p2 for the restricted three-level quantizer
6
1 2 3 4 5 6
0.1 0.2 0.3 0.4 0.5 0.6 0.7
tmax / σref
Pr
p1 = p3 p2
Figure 3.Probabilities p1and p2for the restricted three-level quantizer
1 2 3 4 5 6
0 0.05 0.1 0.15 0.2 0.25
tmax / σref
Pr
Figure 4.The probability of sample occurrence outside the restricted quantizer support region
2.2. Switched Quantization
In this subsection, we propose a model of switched quantizer (denoted by Qs) that instead of just one employs two restricted three-level quantizers. Let tmax1 and tmax2 =tmax1 +Δbe the upper bounds of the three-level restricted quantizers having smaller (QR1) and wider support region (QR2), respectively. Note that Δ should be determined such that all amplitudes of the input signal outside the support region of QR1 belong to the support region of QR2. Ideally, the upper bound of tmax2 should be tmax2→∞ [5] and in that case Qs provides amplitude matching for any source. However, we distinct from that scenario and design QR2with limited upper bound, in order to exploit the benefit in SQNR that offers restricted quantization compared to the unrestricted one (see Figure 2). Figure 4 shows that tmax2 ≥ 3σref is a reasonable choice of the upper bound. Moreover, it can be shown that for Laplacian pdf, 98.6% of all samples lay in the interval (-3σref, 3σref). The following switching rule is implemented to select the desired quantizer: the switched quantizer uses QR1 if it produces smaller value of distortion than QR2.
The total distortion Dt introduced by the proposed switched quantizer can be expressed as [18]:
( )
1( )
(1 ) 2( )
t
D σ =wD σ + −w D σ , (10)
where D1(σ) and D2(σ) are given by (4) and denote distortions inserted by QR1 and QR2, respectively, while wis the weight that determines the proportion of QR1.
Signal to quantization noise ratio in this case can be determined as [11]:
( )
10( )
2SQNRs 10log
t D σ σ σ =
. (11)
The bit rate of the switched quantizer can be calculated as:
( )
1( ) (
1) ( )
2 sR σ =wR σ + −w R σ . (12)
where R1 and R2 are given by (9) and represent bit rates of QR1and QR2, respectively.
0.8 1 1.2 1.4 1.6 1.8 2 2.2
0 1 2 3 4 5 6 7 8 9
R [bit / sample]
SQ
N
R [d
B]
w = 0.7 w = 0.1
Figure 5.SQNR vs. Rfor the Lloyd-Max quantizers
Let us consider the special case of Qs when it combines QR1 (tmax1 = 2σref) and QR2 (tmax2 = 4σref), where wis assumed to be 0.1 and 0.7. To determine the potential benefit of the given Qs, we use as baselines one-bit and two-bit Lloyd-Max’s quantizer [11, 20], since the number of quantization levels of the proposed quantizer is in-between the two baselines. The achieved performance is shown in Figure 5. It can be seen that it provides 3.48 dB (w= 0.7) and 1.95 dB (w = 0.1) higher SQNR value compared to the one (specified by a point on a curve) attained by the baseline quantizer having the same bit rate. Observe that SQNR increases by more frequent selection of QR1(w= 0.7).
2.3. Forward Adaptive Quantization